Transcription
JOURNAL OF INVESTMENT RESEARCHSchwab Center for Financial ResearchAN EVOLUTIONARY APPROACH TOPORTFOLIO CONSTRUCTIONAnthony B. Davidow, CIMA Vice President, Alternative Beta and Asset Allocation Strategist, Schwab Center for Financial Research Schwab believes that asset allocation and portfolio construction needs to evolveto meet the needs of investors. This paper will discuss the evolution of assetallocation and portfolio construction principles and will offer our unique point ofview. We will consider the “active” versus “passive” debate and suggest a newway of incorporating both types of strategies.In this paper:We will evaluate the historical data and discuss which types of market regimes fundamentalstrategies would have performed best in, and when they tend to lag the market-cap-weightedindexes. The following are a few of the key findings of our research: F undamental strategies have historically delivered better risk-adjusted results than theirmarket-cap equivalents. F undamental strategies have historically been able to outperform market-cap indexes andmost active mutual funds. Many active mutual funds have had difficulty in consistently outperforming market-cap indexes. ctive managers may be able to generate excess returns and provide downside protection, butAmanager selection requires dedicated resources to properly evaluate the available options. ur research has shown that combining active, market-cap, and fundamental strategies in anOoptimal fashion helps reduce the overall portfolio risk.For Institutional Use Only. Not for Further Distribution.
Schwab Center for Financial Research JOURNAL OF INVESTMENT RESEARCHWe will discuss the merits of fundamentallyweighted strategies and how to combine them withactive and traditional market-cap-weightedstrategies. Fundamental strategies are also referredto as alternative beta, strategy beta, or smart betabecause they weight securities based onfundamental factors rather than merely providingthe biggest weights to the largest companies. Withthe proliferation of ETFs and the introduction ofalternative beta strategies, there are now moreoptions in gaining exposure to market segments.The focus of the paper is on providing guidance onbuilding better portfolios. We will discuss the artand science of portfolio construction, usingbehavioral science and historical data to buildportfolios. We will share proprietary researchconducted by Schwab and offer insights onmodern portfolio construction techniques andimplementation giesActivelyManagedStrategiesFundamental IndexWe believe that advisors should consider strategiesalong a continuum. Passive (cap-weighted)strategies are designed to provide cheap beta,while active strategies seek to generate excessreturn (alpha). Fundamental strategies belongsomewhere between passive and active. They applya rules-based discipline that establishes the criteriafor selecting, weighting, and rebalancing securities.These strategies are neither truly passive nor active.Schwab Center for Financial Research (SCFR)believes that rather than determining whether it ispreferable to allocate to active or passive options,there is a more evolved view of how to employ bothin portfolios. In fact, we will demonstrate the valueof incorporating active, traditional beta andalternative beta strategies in client portfolios.Academic Research andInvestment TheoryThe basic tenets of modern portfolio theory (MPT)were developed in the 1950s and 1960s. HarryMarkowitz introduced the concept of portfoliodiversification in 1952,1 and Bill Sharpe introducedthe capital asset pricing model (CAPM) in 1964.2Both would eventually win Nobel Prizes for theirwork. MPT wasn’t broadly adopted until the 1990sas institutions and individual investors began todevelop asset allocation strategies.In 1986, Gary Brinson published “Determinants ofPortfolio Performance” in Financial Analysts Journal.The study suggested that “90% of a portfolio’schange in returns over time is attributable to assetallocation policy.”3 This was a significant stepforward and helped shape investment theory.Investors began to focus their energies ondeveloping the optimal combination of assetclasses (also referred to as the efficient frontier).To develop asset allocation models, institutions andconsultants began to use the traditional market-capweighted indexes as market proxies. It’s importantto note that the original market-cap indexes werenever designed to be investable products. They weredesigned to be benchmarks to assist managers andinstitutions in measuring success. Investors couldgauge the performance of one market segmentversus another (S&P 500 Index vs. Russell 20001. Harry Markowitz, “Portfolio Selection,” Journal of Finance, Vol. 7, No. 1, March 1952, 77–91.2. William Sharpe, “Capital Asset Prices: A Theory of Market Equilibrium Under Conditions of Risk,” Journal of Finance, Vol. 19, No. 3, Sept. 1964, 425–42.3. Gary Brinson, Randolph Hood, and Gilbert Beebower, “Determinants of Portfolio Performance,” Financial Analysts Journal, Vol. 42, No. 4, July–Aug. 1986, 39–44.2For Institutional Use Only. Not for Further Distribution.
An Evolutionary Approach to Portfolio ConstructionIndex vs. MSCI EAFE Index), or investment managerscould compare their results relative to benchmarksand measure their value added.The efficient market hypothesis (EMH) states that itis impossible to “beat the market” because themarkets are efficient, and all known information isreflected in stock prices. According to the EMH,stocks always trade at their fair value, making itimpossible for investors to make money buying orselling stocks. As such, it should be impossible tooutperform the overall market through stockselection or market timing, and the only way aninvestor can possibly obtain higher returns is bypurchasing riskier investments. Although initiallyaccepted, many critics began to challenge the EMH.In 1973, Burton Malkiel wrote A Random WalkDown Wall Street, in which he claimed that achimpanzee throwing darts could do as well as aprofessional in beating the market. His assumptionwas that the market was efficient, and thereforenobody could consistently outperform the market.Of course, this was long before the birth ofalternative weighting methodologies.Many academics have challenged the EMH since itbecame popular in the 1970s. In particular, criticshave challenged the efficacy of EMH in periods of“bubbles.” As Robert Shiller has noted, “Thefundamental value of stocks is hard to measure,and, moreover, if speculative bubbles (either positivebubbles or negative bubbles) last a long time, theneven the fundamental relation may not be observedexcept in very long sample periods.”4 Unfortunately,we have experienced a number of shocks in recentyears, and have seen both “irrational exuberance” inthe late 1990s and fear and pessimism in thepost–2008 financial crisis period.After the 2008 financial crisis, advisors began tochallenge the merits of MPT. They pointed to thehigher correlations during periods of market stress,and experienced diminished diversification benefitswhen they needed them the most. Advisorscontended that MPT needed to evolve to reflect thenew market realities and respond to “tail risk.” MPTassumes a normal distribution of returns and willunderestimate the true value for tail risk due to fattails in financial data.Post-modern portfolio theory (PMPT) represents anevolutionary step forward. MPT defined risk as thestandard deviation of returns. PMPT uses thestandard deviation of negative returns as themeasure of risk. MPT assumes that risks aresymmetrical, whereas PMPT assumes asymmetricalrisk. Downside risk captures what investors fearmost—negative returns. We will discuss investors’attitude of risk later in the paper. We believe thatPMPT, a more evolved view of investment theory,shows us how we need to challenge conventionalwisdom to seek better outcomes.Academic theory has evolved a great deal over theyears. MPT provided some basic frameworks forallocating assets. With the expansion of assetclasses and the number of ways to gain exposure,investors need to evolve their allocation process. Wemust learn from history and adopt a more informedand forward-looking approach to allocating assets.Active and PassiveFor many years, academics and investors havedebated whether active or passive managementrepresented a better way of investing. Activemanagers will claim skill and insights not readilyavailable in the marketplace. They will point to theirabilities to analyze balance sheets and find an edgein understanding a company’s growth potential.Critics will point to the data showing the inability ofactive managers to consistently generate alpha.Many point to the exceptional growth of ETFs as arealization that managers are not worth theadditional fees. A growing number of advisors haveembraced ETFs as better building blocks forportfolio construction. With the growth in the4. Robert Shiller, “From Efficient Markets to Behavioral Finance,” Journal of Economic Perspectives, Vol. 17, No. 1, Winter 2003, 83–104.For Institutional Use Only. Not for Further Distribution.3
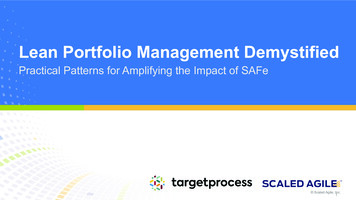
Schwab Center for Financial Research JOURNAL OF INVESTMENT RESEARCHnumber of ETFs, investors now have multiplechoices in gaining market exposure.We believe there is a role for both active andpassive investment options. We understand thatactive managers have had difficulties in generatingconsistent alpha; however, we also know that somemanagers have outperformed in rising marketsand protected better in falling markets. There aresome exceptional managers and some mediocremanagers. There are managers who haveconsistently outperformed their benchmarks andpeers. The challenge, of course, is to find them.Manager selection—the ability to find the superiormanagers—requires skills and resources. Advisorsneed to be able to analyze historical data and makea judgment about the manager’s ability to generatesimilar results in the future. There are a number ofvaluable tools to assist in the screening andevaluation of manager results. We recognize thatinvestors need to devote time and energy to identifythe skillful managers and carefully monitor thoseresults over time. Investors may choose to hiresomeone with the skills, resources, and acumen toidentify managers on their behalf.Fortunately, there are numerous active and passiveinvestment options readily available in the market.The explosive growth in ETFs allows investors to gainexposure to virtually every market segment, as well asdifferent index construction methodologies (marketcap and fundamental weight). A plethora of mutualfund and separately managed account (SMA) optionspresent both challenges and opportunities. The tablebelow compares some of the features of active,market-cap, and fundamental weighted strategies.We understand that not all advisors have theskills and resources to appropriately evaluatemanagers, and therefore may choose to cede theargument and utilize passive options. Active andpassive options have their pros and cons. Webelieve that investors should evolve their viewsand embrace both types of strategies.Alternative BetaA lot of academic research challenges the notion thattraditional market-cap-weighted indexes are the mostappropriate market benchmark. In fact, much of theresearch shows that fundamental strategies haveoutperformed their cap-weighted counterparts overlonger intervals. Fundamental indexes screensecurities based on fundamental factors like adjustedsales, retained cash flow, and dividends buybacks,and then weight securities based on these factors.Traditional market-cap indexes weight securitiesbased on market capitalization. In other words, thelargest companies by market capitalization wouldhave the largest weight in an index.Rob Arnott and his colleagues at ResearchAffiliates have championed the use of fundamentalindexing for many years. In an article published inFinancial Analysis Journal, Arnott et al. criticizeCAPM and some of the assumptions used, mostnotably the use of cap-weighted indexes as themarket benchmark. Based on their research,Research Affiliates has shown significantoutperformance relative to traditional indexes: “Webelieve these results are not mere accidents ofhistory but are likely to persist into the future. Themean-variance superiority of the fundamentalindexes is robust and significant.”5ActiveMarket CapFundamentalPortfolio WeightingVaries by managerCap-weightedFactor-basedPortfolio ConstructionVaries by managerLarger-cap biasValue-tiltPortfolio TurnoverBuy and sell disciplineReconstitutionRebalancingTax EfficientNot typicallyTypicallyTypicallyCost StructureVaries by manager and vehicleLowest costLow cost5. Robert D. Arnott, Jason C. Hsu, and Philip Moore, “Fundamental Indexation,” Financial Analysts Journal, Vol. 61, No. 2, March–April 2005, 83–97.4For Institutional Use Only. Not for Further Distribution.
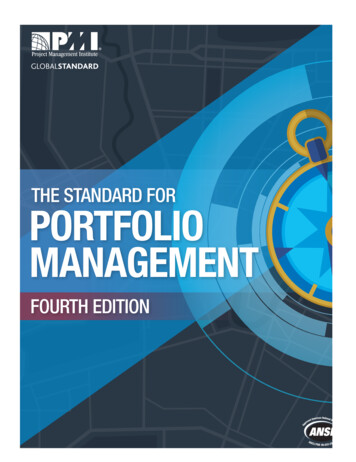
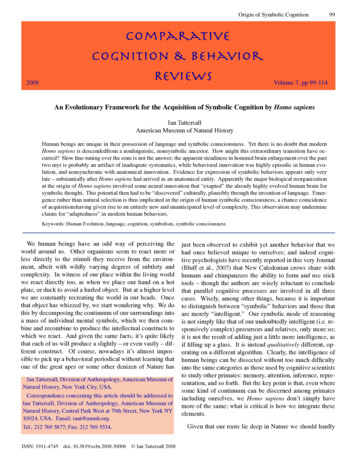
An Evolutionary Approach to Portfolio ConstructionArnott may have started the debate, but others havejoined in the discussion, leading to the introductionof multiple fundamental index strategies. Accordingto Nöel Amenc, “[T]he reason behind the new indicesfor the vast majority of investors, and doubtlesstheir promoters, is probably the superiority of theirperformance compared to traditional cap-weightedindices. Alternative beta, advanced beta or smartbeta are therefore a response from the market to aquestion that forms the basis of modern portfoliotheory since the work of Harry Markowitz: how toconstruct the optimal portfolio.”6Exhibit 1 shows the top 10 holdings in the Russell1000 Index and the Russell Fundamental U.S. LargeCap Index. While many of the companies appear inboth, the weights can be quite different. As you cansee, Apple is the largest position in the Russell1000 Index based on the fact that it is the largestcompany by market capitalization. Conversely, Exxonis the largest position in the Russell FundamentalIndex. This is due to its strong sales, cash flow, anddividend payment characteristics.As noted below, Apple is the largest company in theRussell 1000 Index, and isn’t even in the top 10largest in the Russell Fundamental Index (as ofDec. 31, 2012, Apple was the 51st-largest companyin the Russell Fundamental Index). Through the firstthree quarters of 2012, Apple was up over 65%.Fundamental indexes and most active managersunderweighted Apple, making it very difficult tooutperform. Market-cap weighting generally performsbetter in market environments that reward mega-capstocks due to their overweighting of the largestcompanies, and often outperforms in “boom”periods (for instance, during the tech bubble).Unlike market-cap strategies that tend to overweightthe overvalued stocks and underweight theEXHIBIT 1Russell Fundamental U.S. Large Company IndexRussell 1000 IndexCompanyWeightCompanyWeightExxonMobil Corp.5.19%Apple Inc.3.43%Chevron Corp.2.56%ExxonMobil Corp.2.78%Bank of America Corp.2.05%General Electric Co.1.53%AT&T Inc.2.02%Chevron Corp.1.47%ConocoPhillips1.74%International Business Machines Corp.1.44%General Electric Co.1.64%Microsoft Corp.1.38%Proctor & Gamble Co.1.60%AT&T Inc.1.36%Microsoft Corp.1.53%Johnson & Johnson1.32%Wal-Mart Stores Inc.1.48%Pfizer Inc.1.29%Verizon Communications Inc.1.39%Procter & Gamble Co.1.28%Total21.20%Total17.28%Source: Russell Investments and Research Affiliates (as of Dec. 31, 2012).6. Nöel Amenc, “Beyond Smart Beta Indexation,” Edhec-Risk Indices and Benchmarks, Nov. 2012, 012-11-29.5604.For Institutional Use Only. Not for Further Distribution.5
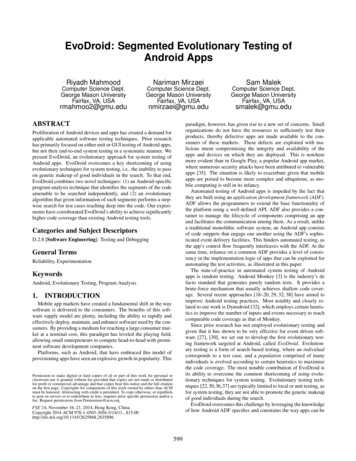
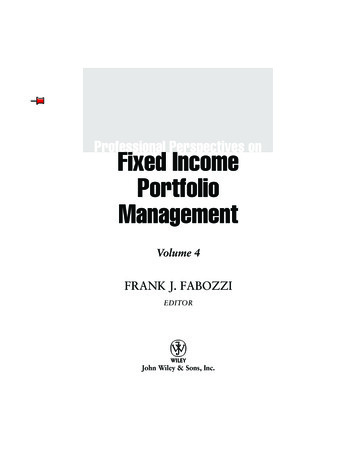
Schwab Center for Financial Research JOURNAL OF INVESTMENT RESEARCHundervalued stocks, fundamental strategies weightsecurities based on predetermined factors. Asshown in Exhibit 1, fundamental strategies will havedifferent weights than their market-cap counterparts.In certain market environments, the differences willbecome pronounced and can lead to dramaticallydifferent client experiences. For example, sinceApple is the largest company in the Russell 1000Index, the rise and fall of Apple will have a largereffect on the overall index performance than thefundamental strategy. Fundamental indexes mayalso have a small-cap tilt.We believe that it is important for investors tounderstand the differences between fundamental andtraditional market-cap-weighted strategies andunderstand how each strategy performs in a givenmarket environment. Previously, we covereddifferences in the construction methodologies.We believe that both provide value, and each willdeliver different results depending on the marketenvironment. Although over longer intervalsfundamental indexes have been able to deliver excessreturns, there are environments in which market-capweighted strategies will generate better results.As referenced in Exhibit 2, fundamental indexes havegenerally outpaced traditional indexes over the longrun. The excess returns ranged from a low of 1.8%for the Russell Fundamental Developed ex U.S.Small Company Index to a high of 6.5% excess returnfor the Russell Fundamental Emerging Markets LargeCompany Index. However, we should also point outthat they also exhibit higher tracking errors relativeto the cap-weighted index. The Russell FundamentalEmerging Markets Index had an 8% tracking errorversus the Russell Emerging Markets.EXHIBIT 2(1996–2012)ReturnRussell Fundamental U.S. LgRussell 1000S&P 500Russell Fundamental U.S. sVolatilitySharpe ll 20007.6%Russell Fundamental Dev x U.S. Lg8.6%Russell Large Cap Developed x U.S.5.8%2.8%17.8%0.184.2%0.66MSCI EAFE Lg4.5%4.0%17.8%0.114.6%0.87Russell Fundamental Developed ex U.S.Small Company8.0%17.5%0.31Russell Small Cap Developed x 2Russell Fundamental Emerging MarketsLarge CompanyRussell Emerging Markets5.7%1.8%14.2%7.7%6.5%Source: Research Affiliates, LLC, based on data from Russell Investments and Bloomberg. The Russell Fundamental Indexes were created on 2/24/11. Performance andstatistical data on Russell Fundamental Indexes for periods prior to each index’s inception is back tested, but was calculated in the same manner as more recent, factual indexdata. The performance information presented represents back-tested performance based on combined simulated data and live from 8/01/1996 to 12/31/2012. Back-testedperformance is hypothetical, done with the benefit of hindsight, and is provided for informational purposes only to indicate historical performance had the stocks actually beeninvested in over the relevant time period. Commissions and other fees were not taken into consideration; if they had been, performance would have been substantially lower.6For Institutional Use Only. Not for Further Distribution.
An Evolutionary Approach to Portfolio ConstructionFundamental indexes are created based oneconomic factors. Market-cap indexes weightsecurities by market capitalization, and they aredisproportionately affected by the price movementsof the biggest companies in the index. Market-capindexes have a larger-cap bias. Since fundamentalindexes tend to screen securities based on valuefactors, they introduce a value bias. However, itis important to note that fundamental indexesare not value indexes. Fundamental indexes willown value, growth, and core stocks dependingon their fundamental characteristics. Valueindexes will screen securities to identify valuestocks and then typically weight them based onmarket capitalization.Fundamental indexes have generallyoutpaced traditional indexes over thelong run. The excess returns rangedfrom a low of 1.8% for the RussellFundamental Developed ex U.S. SmallCompany to a high of 6.5% excess returnfor the Russell Fundamental EmergingMarkets Large Company.SCFR evaluated the sources of outperformance todetermine whether they were sustainable over time.The two primary sources of excess return camefrom the value-tilt, favoring value factors inscreening securities and disciplined rebalancing.The source of alpha comes from the dynamic valueeffect and is realized through the rebalancingprocess. Rebalancing allows a fundamental index tocapitalize on price movements without deviatingfrom its rules-based discipline.Active Manager SelectionAs previously discussed, it is challenging to findmanagers that can consistently outperform theirbenchmarks. While there are superior managersthat have outperformed in rising markets andprotected better in falling markets, it requiresdedication and resources to do it well. However,there are managers who earn their fees by beatingtheir benchmarks.S&P Indices has created a Persistence Scorecard totrack the consistency of top-performing mutualfunds over rolling time periods. Working with theUniversity of Chicago’s Center for Research inSecurity Prices (CRSP) Survivor-Bias-Free US MutualFund Database, the Persistence Scorecard ranks allfunds available at each point in time and tracks thetop-quartile and top-half performers throughout thetime period. In their December 2012 report “DoesPast Performance Matter?”7 they note that very fewfunds manage to consistently stay at the top. Ofthe 707 funds that were in the top quartile as ofSeptember 2010, only 10% were still in the topquartile at the end of September 2012. For thethree years ending September 2012, 23.60% oflarge-cap funds, 15.49% of mid-cap funds, and29.37% of small-cap funds maintained a top-halfranking over three consecutive 12-month periods.Part of the difficulty in consistently outperforming isthe natural rotation that occurs in the market. Thereis a rotation from growth to value and a rotationamong the types of value and growth managers thatperform well in a given market environment. Activemanager selection requires advisors to understandthe types of managers that perform well in a givenmarket environment.There are tools that can assist in screeningmanager data over multiple time periods. Thesetools can assist in evaluating managers’ absolute7. Aye Soe and Frank Luo, “Does Past Performance Matter?: The Persistence Scorecard” S&P Dow Jones Indices, Dec. 2012.For Institutional Use Only. Not for Further Distribution.7
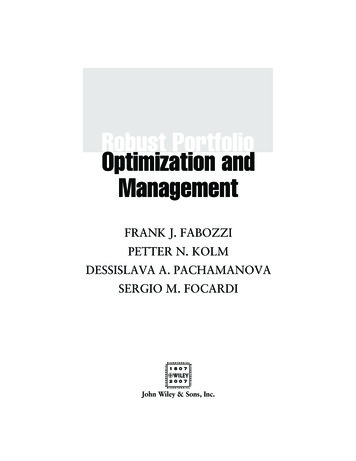
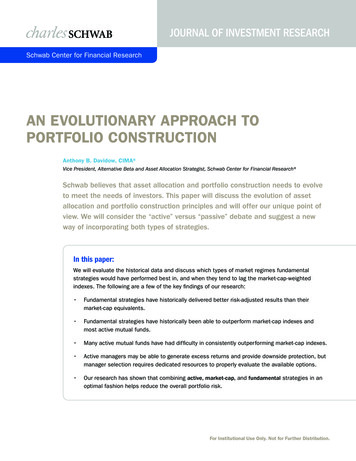
Schwab Center for Financial Research JOURNAL OF INVESTMENT RESEARCHand relative results versus their benchmarks andpeer groups. They can allow investors to measure amyriad of risk statistics, including alpha, beta,standard deviation, Sharpe ratio, Sortino ratio,capture ratio, and information ratio. By analyzingdata over multiple time periods, advisors candetermine the consistency of results.Many advisors also evaluate qualitative factors andoften conduct due diligence on such factors as theorganization and ownership structure, assets undermanagement growth, strategy capacity, tradingpractices, contingency plans, compliance, andoperations. The due diligence can be conducted viaquestionnaires and onsite visits. The goal of theevaluation is to determine the soundness andrepeatability of the investment process, as well asthe ability to handle growth in the strategy. Poorperformance is often a symptom of a largerorganization issue, such as deviation from stateddiscipline, loss of key personnel, exceeding capacitythresholds, and changes in ownership structure.Building Better PortfoliosAs previously discussed, SCFR believes in the valueof combining active and passive investment options.We also believe that investors will have a differentexperience with market-cap and fundamentallyweighted strategies. We believe that assetallocation strategies need to be integrated intosound portfolio construction techniques. Therefore,we wanted to evaluate the best way of incorporatingthese types of strategies in an integrated portfolio.In evaluating allocations among active, market-cap,and fundamental investment options, we wanted tolook at the risk-adjusted results across multiplemarket segments. We compared active, market-cap,and fundamental strategies across the major equitysegments: domestic large cap, domestic small cap,international large, international small, andemerging markets.For the active option, we used our internal ratingsystem and screened our ‘A’- and ‘B’-rated managers.EXHIBIT 3Sharpe Ratio0.8Sharpe Ratio0.70.60.50.40.30.20.10Domestic Large Co.Domestic Small Co.International Large Co.Market CapFundamentalInternational Small Co.Emerging MarketsActiveSource: Charles Schwab Investment Advisory. The performance information presented represents back-tested performance based on combined simulated data and live from 1/1992to 5/2012 for Domestic Large Co., Domestic Small Co., and International Large Co., 1/2004–5/2012 for International Small Co., and 1/2002–5/2012 for Emerging Markets. Backtested performance is hypothetical, done with the benefit of hindsight, and provided for informational purposes only to indicate historical performance had the stocks actually beeninvested in over the relevant time period. Commissions and other fees were not taken into consideration; if they had been, performance would have been substantially lower.8For Institutional Use Only. Not for Further Distribution.
An Evolutionary Approach to Portfolio ConstructionThe rating system is based on a proprietary modelthat rates 16,000 open-end mutual funds based ontheir relative performance prospects for the next12–36 months. The ratings combine risk and returndata with other fund attributes to create a unifiedrating. For this exercise, we ranked the ‘A’ and ‘B’funds by their downside correlation (i.e., downsidecapture ratio relative to the appropriate benchmark).We then selected the top 10% of funds exhibitingthe best downside correlation. Each fund wasequal-weighted, and at the end of every year wereranked the funds and repeated the process. Theresults are reflected in our analysis below.Exhibit 3 shows the Sharpe ratios of the active,fundamental, and market-cap indexes acrossmultiple asset classes. Note that the fundamentalstrategies have generally provided the best Sharperatios. The exception is international small cap,where the active managers delivered the highestSharpe ratio. It seems intuitive that activemanagers should be able to demonstrate skill inthe less efficient markets.In considering portfolio construction optionsacross active and passive options, we wantedto evaluate the options through a common lens.We have compared the active, fundamental, andmarket-cap-weighted index options with thecomparable Morningstar Universe. The data inExhibit 4 compares the Russell Large CapFundamental Index and the S&P 500 with theMorningstar Large Cap Universe. This comparisonallows us to evaluate the market-cap andfundamental options relative to a broad universe.As shown in Exhibit 4, the Russell Fundamental U.S.Large Cap Index delivered significant excess returnrelative to its cap-weighted equivalent (9.19% vs.6.60%). The fundamental index delivered an attractiveupside/downside capture ratio (101.84/99.63),outperforming in rising markets and protecting betterin falling markets. The Fundamental Index generatedan impressive alpha, Sharpe ratio, and informationratio. Our research has shown similar results aswe evaluate fundamental strategies across othermarket segments (e.g., domestic small cap,international large cap, international small cap,and emerging markets).Portfolio ConstructionMPT provides a theoretical framework for allocatingassets but provides little guidance on the practicalimplications of portfolio constructions. Portfolioconstruction incorporates asset allocation theoryand strategies to gain exposure to the assetclasses. Portfolio construction requires advisorsto evaluate different strategies and structures todetermine the right combination of solutions tomeet investor needs and objectives.We believe that portfolio construction requires bothart and science. We have already shared analysison active, fundamental, and traditional marketcap-weighted indexes. We now want to considerbehavioral finance and how investors react to risk.Daniel Kahneman and Amos Tversky have studiedhow people respond to risk. Their research onprospect theory serves as a factor in our portfolioconstruction process.One very important result of Kahneman and Tversky’swork is demonstrating that people’s attitudes towardrisks concerning gains may be quite different fromtheir attitudes toward risks concerning losses. Forexample, when given a choice between getting 1,000 with certainty or having a 50% chance ofgetting 2,500, they may well choose the certain 1,000 in preference to the uncertain chance ofgetting 2,500 even though the mathematicalexpectation of the uncertain option is 1,250. This isa perfectly reasonable attitude that is described asrisk aversion.88. Daniel Kahneman and Amos Tversky, “Prospect Theory: An Analysis of Decision Under Risk,” Econometrica, Vol. 47, No. 2, March 1979, 263–92.For Institutional Use Only. Not for Further Distribution.9
Schwab Center for Financial Research JOURNAL OF INVESTMENT RESEARCHEXHIBIT 4Universe Comparison (2003–2012) Russell Fundamental U.S. LargeCompany Index1028927S&P 500 Index826Peer Group 25th Percentile725624Peer Group MedianPeer Group 75th ualizedStdDevUpsideCapture %DownsideCapture ualizedStdDevUpsideCapture %DownsideCapture %AnlzdAlphaSharpeRatioInfoRatioRussell Fundamental U.S. Large Index9.1925.19101.8499.632.420.531.33S&P 500 Index6.6025.03100.00100.000.000.39—Peer Group 25th Percentile7.1426.24101.31101.290.690.440.13Peer Group Median6.2625.0599.3899.98-0.330.37-0.17Peer Group 75th Percentile5.4923.7895.4695.71-1.120.32-0.50Peer Group 95th Percentile3.9715.9182.9982.37-3.510.17-1.41As of 12/31/2012Peer Group: Morningstar Category Large Blend. Number of investmen
In 1973, Burton Malkiel wrote A Random Walk Down Wall Street, in which he claimed that a chimpanzee throwing darts could do as well as a professional in beating the market. His assumption was that the market was efficient, and therefore nobody could consistently outperform