Transcription
Proceedings of theAnnual Stability ConferenceStructural Stability Research CouncilAtlanta, Georgia, April 21-24, 2020Analysis of non-symmetric cross-sections relative to the provisions of AISC360-10Edward J. Sippel1, Ronald D. Ziemian2, Hannah B. Blum3AbstractNon-doubly symmetric sections are used for a variety of applications that range from the mainmember of a large portal frame to angles framing small roof penetrations in steel structures.These non-doubly symmetric sections challenge the structural analysis process with morecomplex displacements and stability limits compared to doubly symmetric sections due to nonconcentric shear centers and centroids. This project investigated the response identified by astructural analysis that meets the current analysis requirements of the AISC specification andassumes doubly symmetric cross sections versus an analysis that more accurately models nondoubly symmetric cross section information. Beam finite element models were created inmultiple structural analysis programs to perform this evaluation. The results were compared toshell-element models created in Abaqus and experimental results when available. The modelingprocesses used were verified to meet the design requirements of the Direct Analysis Method andAdvanced Analysis Method. These procedures were used to model three single memberexamples that included non-doubly symmetric cross sections to compare the calculation ofdisplacements and stability limits. Finally, a mono-symmetric I-beam portal frame was evaluatedto consider the impact of sharing forces within a system.1. IntroductionThe Direct Analysis Method was introduced in the 2005 AISC Steel Specification (AISC 2005)as an alternative method to design steel structures of all frame types and sections (Griffis &White 2013) from the Effective Length Method that had previously been the industry standard.Chapter C of the 2016 AISC Steel Specification (AISC 2016) lists the current requirements tofollow the Direct Analysis Method. The Direct Analysis Method encompasses a full designapproach that allows the engineer to complete one type of structural analysis and assess thoseforce distributions with a specific set of design requirements. The provisions of the DirectAnalysis Method indicate that the analysis needs to consider flexural, shear, axial, and all othercomponent deformations that contribute to the displacement of the structure. The analysis mustalso consider the effects of P-δ and P-Δ for the structure. The Direct Analysis Method has no1Graduate Research Assistant, University of Wisconsin-Madison, esippel@wisc.edu Professor, Bucknell University, ziemian@bucknell.edu 3Assistant Professor and Alain H. Peyrot Fellow, University of Wisconsin-Madison, hannah.blum@wisc.edu 2
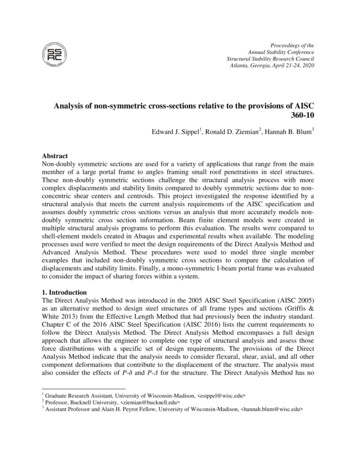
requirements for the inclusion of torsion and second order twisting effects. The consideration ofthese effects and the determination if they would have a significant influence on structuralperformance is left to the discretion of the engineer. A structure composed of doubly symmetricsections such as standard I-beams and HSS members will have negligible twisting effects if themembers are loaded in a single plane and do not have eccentricity out of that plane. However, ifeither of those conditions is not met these doubly symmetric sections will begin to twist and thiscan lead to significantly different results as discussed by Ziemian et al. (2018). The use of nondoubly symmetric sections such as channels, angles, and tees further complicates this issue.These cross sections have a nonconcentric centroid and shear center, which means an appliedload may cause a resulting torsion and cause the cross section to begin to move out of plane evenwhen the load appears centered on the section.In addition to the decisions made by the engineer as to what is critical to include, the engineer isoften limited to the abilities of the structural analysis software available to them. Many structuralanalysis programs utilize a beam (line) element that assumes a doubly symmetric cross sectionwith six degrees of freedom per end of the element regardless of the actual shape. Non-doublysymmetric cross sections are allowed to be used within these programs, but limitations exist. Theunderlying mechanics of the members are typically assumed to still behave the same as a doublysymmetric section. The consideration of what effect the nonconcentric shear center and centroidhave is left to the user to decide the appropriate alterations to make to a typical model with somedirection from design guides, help forums, and experience. Recent work by Liu et al. (2018,2019) defined a new line element that removes the doubly symmetric assumption and directlyaccounts for the different behavior of non-doubly symmetric sections. This element has beenimplemented into MASTAN2 (Ziemian et al. 2019) with additional tools to readily model nondoubly symmetric sections.In this paper an initial comparison of the different results from the structural analysis of nondoubly symmetric sections is presented. The focus of the study was on comparing how ananalysis approach that would meet the requirements as part of the Direct Analysis Method wouldbe different when working with a method that treated all sections as doubly symmetric versusone that includes behavior related to asymmetry. The project started by focusing on themechanical responses that were required to be included as part of the Direct Analysis Method.After observing how single non-doubly symmetric members behave, the project then proceededto evaluate a system of singly symmetric cross sections in a model following the Direct AnalysisMethod. The objective of this study is to highlight locations where and what type ofdiscrepancies can exist.2. Structural Analysis UtilizedMany different options and methods are available to engineers to complete their structuralanalysis. A common approach for practicing engineers is to use a commercially availablestructural analysis program that implements a line element that assumes a doubly symmetriccross section. This project included results from both SAP2000 (CSI America 2018) and RFEM(Dlubal Software 2012) to represent this possibility. Another approach would be to utilize amethod that does not assume doubly symmetric. One method available within many structuralanalysis programs would be to use shell or solid elements to build the model. This wasconsidered for this project using Abaqus (Dassault Systems 2015b) to create shell element2
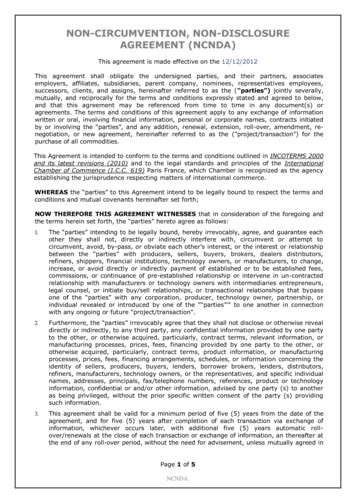
models for each problem. However, even a small structure modeled this way would becomeunwieldly quite quickly; therefore a line element model that removes the doubly symmetricassumption would be an alternative to not substantially change from common current modelingprocedures. This project chose to employ MASTAN2 (Ziemian et al. 2019) and Abaqus as twoprograms that allow for the inclusion of asymmetric properties while using line elements. Whenidentifying the results in tables and graphs, line element models will be identified by the programname and the shell element model in Abaqus will be identified by the label “shells”.2.1 Analysis for the Direct Analysis MethodThe Direct Analysis Method is one design procedure alternative to follow for the design of asteel building structure. The method requires a structural analysis meeting specific requirementsto follow different design rules. Some analysis requirements direct the actions of the user, whilea few other provisions indicate the minimum requirements of the structural analysis method orprogram. It was determined to verify that each program used could model the effects of flexuraland axial deformations in addition to P-δ and P-Δ considerations. The verification wascompleted by following the example problems provided in the AISC commentary (AISC 2016)and an indeterminate example from the referenced design guide (Kaehler et al. 2011). The threebeam problems solved are shown in Figure 1 and also list the common parameters used. Examplebeam 1 verifies the inclusion of both P-δ and P-Δ effects while beam 2 and beam 3 highlight justthe P-δ effects in a member. Example beam 3 was included to verify that the convergence studywithin each program was not being artificially lowered due to the problem symmetry.Figure 1: Direct Analysis Method Verification ProblemsA model for each problem from Figure 1 was built within each program utilizing the lineelements. The programs of SAP2000, RFEM, and MASTAN2 have one option to choose for aframe element supporting moments and axial force, but additional features of the element inMASTAN2 could be included based on the properties defined and boundary conditions includingwarping and asymmetric considerations. The line element used in Abaqus was the two-nodethree dimensional open section that included warping, B31OS (Dassault Systems 2015a),integrated during the analysis. For the verification problems, the section properties of theW14x48 were taken from program provided AISC-based tables for SAP2000, RFEM, andMASTAN2. In Abaqus, there were alternatives to use a generic cross section where the sameidentical section property information could be assigned; however, as the integration featureduring analysis was used the dimensions were needed to be provided to allow Abaqus tocalculate the section properties and other necessary information itself. The mesh of these modelswas varied from 2 elements to 64 elements using a factor of 2 along the length of the memberresulting in elements varying from 168 inches to 5.25 inches. The loading was applied asdistributed loads on members and discrete point loads on nodes at the locations indicated inFigure 1.3
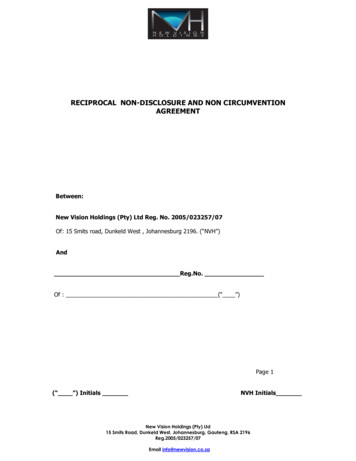
A model consisting of shell elements was also created in Abaqus for each problem. A shellelement model was chosen since a cross section effective length to thickness ratio of 3 or largercould be captured by a thick or thin shell mechanical response (Akin 2010). The shell modelsutilized the S4R shell element that has a 4 node linear formulation with reduced integration,hour-glass control, and a general formulation that includes both the thick and thin shell behavior(Dassault Systems 2015b). The I-beam members consisted of three planes of elements attachedtogether to form the complete section as illustrated in Figure 2. The section was defined with anoverall height equal to the web and with top and bottom flanges offset to the edge of the elementto model the full cross section without overlap as shown below. The full member was meshedbased on a single seed value to have consistent sized, approximately square elements along thefull length. The largest seed value of 4 inches was based on half of the flange width which wasdecreased for the mesh study by factors of 2 until there were 128 elements across a single flange.Since none of the Direct Analysis Method verification problems shown in Figure 1 were alteredby having free or fixed warping end conditions, the end nodes of all members were rigidly tiedtogether which fixed warping and allowed for boundary conditions and point loads to be appliedat a single reference node. Distributed loading was applied as a series of point loads at all nodeson the neutral axis of the member based on the tributary length of the elements.Figure 2: Shell Model Offsets in I-BeamAll of the structural analysis programs considered were able to solve the Direct Analysis Methodverification problems. Since the solution trends were similar among all three problems, only thesolution to Beam 3 will be discussed in detail. The analytical solution was provided in DesignGuide 25 (Kaehler et al. 2013) and follows in Eq. 1 through Eq. 4.𝑤𝐿46Δ 192𝐸𝐼 [𝑢4 [(2 sec 𝑢 𝑢2 2) 𝑀 𝑤𝐿28[(tan 𝑢 𝑢)(sec 𝑢 1)2(tan 𝑢 𝑢)𝑢2 (11 )2𝑢 tan 2𝑢𝜋𝑃𝑢 2 𝑃𝑃𝑒𝐿 𝑒𝐿𝜋 2 𝐸𝐼𝐿211 2𝑢 tan 2𝑢]]](1)(2)(3)(4)where E is the modulus of elasticity, I is the moment of inertia, L is the length, PeL is the elasticbuckling load for a simply supported beam, P is the applied axial load, w is the applied4
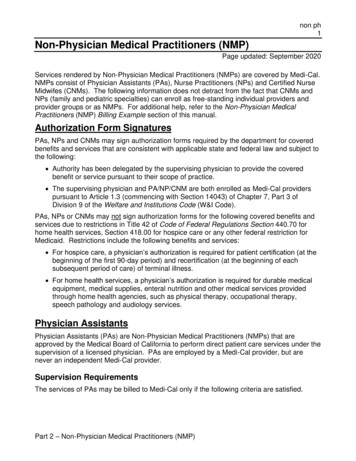
distributed load, M is the moment reaction at the support, and Δ is the beam deflection atmidspan. Table 1 summarizes the calculated results to beam 3 from the analytical solution andeach program at the finest mesh size modeled.Table 1: Analysis Results of Beam 3: A Propped CantileverAnalytical SAP2000RFEMMASTAN2 ABAQUSVertical Displacement at Midspan, 330.1480.1650.1650.1640.166Support Moment, 28327328328375389388389389ProgramP (kip)03006009001200P 234257288330393It can be seen that the program solutions are very consistent, but do not match the analyticalsolution exactly. The analytical solution accounted for bending deformation due to the axial andlateral loading. However, the solution from each of the structural analysis programs accounts forshear deformations and the effects of axial compression. This difference was previouslyobserved in the first two beams shown in Figure 1 and resulted in the updated reference valuesprovided in the AISC 2016 commentary (AISC 2016) that do not exactly match the analyticalsolution shown in previous editions (AISC 2005, AISC 2010), but include the effects of bending,shear deformations, and axial compression similar to the results in Table 1.ErrorDeflection Convergence at P 1200 248163264Number of Elements Along BeamFigure 3: Deflection Convergence for Beam 3The convergence of the solutions varied both across structural analysis programs and with theapplied axial load. When a small axial load was applied, the analysis displayed little nonlinearityand converged rapidly with minimal meshing. As shown in Figure 3 and Figure 4, it was foundthat at a large axial load with nonlinearity required a finer mesh size to accurately solve the5
problem. It was found the analyses were exhibiting less than a 1% change to the solution whenusing a mesh size of at least 32-10.5 inch long elements per member. The shell element modelwas excluded from these figures as the number of elements across the cross section was notsensitive in this analysis. The use of an approximately square mesh size caused even the coarsestmesh size with a seed length of 4 inches to have 84 elements along the length of the beam. Theresults were indicating quick convergence of the solution since the problems in Figure 1 do notinclude variation in the stress across the width of the flange unlike the remaining problems in thisanalysis.ErrorMoment Convergence at P 1200 48163264Number of Elements Along BeamFigure 4: Moment Convergence for Beam 32.2 Advanced Analysis OptionsA structural analysis method that meets the requirements of an analysis as part of the DirectAnalysis Method is only required to meet the previously mentioned requirements in a twodimensional analysis. Additional checks were completed with each structural analysis program toassess the ability to include out of plane rotations, warping, twisting effects, and non-doublysymmetric sections. The ability of the programs to transmit moments through corners withrotations was assessed using a right angle frame shown in Figure 5(a), which was experimentallytested by Spillers et al. (1993) and had a Young’s modulus of 10,800 ksi and Poisson’s ratio of0.35. This frame is similar to the one used by Argyris et al. (1979) and discussed by McGuire etal. (2001). The structural analysis program is only capable of obtaining an accurate solutionwhen accounting for the effects of finite rotations at the corner as excluding this term finds asubstantially lower buckling mode. The warping and twisting effects were evaluated using theexample problem for advanced analysis from the AISC Steel Specification Appendix 1commentary (AISC 2016) shown in Figure 5(b). The problem is evaluated at 0.8 times theYoung’s Modulus with typical properties of E 29000 ksi and v 0.30 and has an initial lateraldisplacement equal to L/1000. The provided solution was evaluated without shear deformation.The displacement response and resulting final equilibrium position was found to be quitedifferent based on whether or not the structural analysis program includes warping and/orsecondary twist effect making it possible to discern the type of analysis completed. Finally, acantilevered monosymmetric I-beam was loaded with point loads in all three principal directionsto identify variations from a typical doubly symmetric beam response.6
Figure 5: Advanced Analysis Verification ProblemsWhen evaluating the frame from Spiller and the AISC example problem, it was found that not allstructural analysis procedures could obtain the correct solution. A solution that evaluated theinitial P-δ effects alone would not be able to capture an accurate result. Finding an accurateresult to these problems required evaluating the equilibrium of the structure in the deformedconfiguration.The frame from Spiller has a first failure mode of lateral torsional buckling. The frames wereloaded with the vertical load and a small lateral load of 0.001 lb at the tip concurrently to add animperfection to the model. The superposition of these loadings alone would miss the torsion ofthe horizontal arm and weak axis moment about the column which could hide the instability.When the problem was reevaluated in the updated equilibrium position it was observed that thelateral displacement of the knee of the frame would rapidly increase thus indicating buckling.The experimental testing by Spiller observed a buckling load of approximately 25 lbs. Theprograms used for this project all exhibited a buckling failure between 22.7 lbs to 26.8 lbs. Thisrange was deemed acceptable based on the variability in defining an exact buckling load. Theeffort of defining buckling was complicated by a stable post buckling response that included anincreasing maximum displacement which was sensitive to the applied imperfection. Efforts weremade to have similar total displacement at the final loading, but some variation still existed.Case1Case2Table 2: Advanced Analysis Example SolutionMuxMuyδyδxAnalysis Type(k-ft)(k-ft)(in)(in)Without Warping23862580.694 0.967Including Warping239955.80.589 0.214Without Warping12351920.342 0.833Including Warping12371400.318 0.616θ(rad)0.10780.02330.04710.0266The AISC example problem allowed for the verification of the displacements and forcescalculated in an analysis with a member experiencing second order twist effects. The inclusion ofa problem that has twisting required the identification of whether warping is included. Theeffects of warping make the member stiffer in torsion resulting in smaller rotations and whenconsidering second order twist effects smaller displacements, as summarized for this problem inTable 2. Provided in the table are the moments in the rotated equilibrium orientation, Mux aboutthe strong axis and Muy about the weak axis, as well as the vertical displacement δy, horizontaldisplacement δx, and the rotation θ at the middle of the member. While the solution for the major7
axis moment did not substantially change, the remaining components of the solution aresignificantly different.The inclusion of warping is not a commonly found structural analysis feature. Most programs donot include it as an option because the analysis is often deemed to be conservative when ignoringwarping. Both SAP2000 and RFEM were used to run an analysis without warping on an assumeddoubly symmetric cross section. There was a module within RFEM that allowed for the analysisof part of a structure including warping, but that was not utilized for this project except whereexplicitly stated. The inclusion of warping was considered in both MASTAN2 and Abaqus.While options exist within both programs to ignore warping, the behavior of non-doublysymmetric sections exhibit warping behaviors that cause important effects that were to beconsidered in the following stages of this project. This caused the solutions from each program tobe grouped into two distinct responses as shown in Table 3.ProgramMux (k-ft)Muy (k-ft)δy (in)δx (in)θ (rad)Mux (k-ft)Muy (k-ft)δy (in)δx (in)θ (rad)Table 3: Advanced Analysis Example ResultsSAP2000RFEMMASTAN2 ABAQUSWithout WarpingIncluding WarpingCase 680.9670.2130.220.10790.10790.02310.0238Case 398670.6290.2620.028012381530.3430.6750.0313The results from each program match reasonably well with the anticipated results. The analysiscompleted in SAP2000, RFEM, and MASTAN2 were all done without the considerations ofshear deformations and using AISC provided section properties to best match the tabulatedvalues. The analyses in Abaqus, both the shell element and line element models, were completedwith the consideration of shear deformations and ignoring fillets. While this did introduce adiscrepancy from the tabulated solution for these models, this decision allowed for bettercomparison for the shell element model as it was not possible to ignore shear deformations inthat method of evaluation. The results from SAP2000 and RFEM were nearly identical with onlyminor variations in the lateral displacement and twist under the presence of axial loading. Theevaluations with warping included did have a bit more variability as expected. The solution fromMASTAN2 was closest to the tabulated values with a conservative weak axis moment being thegreatest discrepancy. The values from Abaqus exhibited slightly larger deformations due to sheardeformations. The use of a generic section for the line element model in Abaqus did require anoverlap of the web and half the flange thickness at both ends, but this resulted in a reasonableapproximation for the impact of fillets on the analysis. The shell element analysis was found tohave slightly larger results than all previous analyses, but closely followed the trends from theAbaqus line element analysis results. Overall, all methods and programs were able to obtainresults that could capture the second order twist effects.8
The observed convergence of the line element models did not change substantially whenintroducing the twisting effects. However, the convergence of the shell element model changedfrom the Direct Analysis Method verification problems. The advanced analysis problemsintroduced variations in the stress across the flanges that required a significantly greater numberof elements to minimize error. The advanced analysis example had increased convergencerequirements with the largest variation observed in Case 2 and are shown in Figure 6. The strongaxis moment and vertical deflection were found to have errors that quickly decreased, but theoverall lateral displacement of the cross section required many more elements to converge. Theanalysis was completed with a maximum of 128 elements across the flange of the I-beam using amesh seed size of 0.0593 in. For the completed analysis to only have a 1% difference comparedto that solution at least 32 elements across the flange which equates to a mesh seed size of 0.237in were needed. As a result, the remaining evaluations in this project were completed with atleast that number of elements across the extreme flange.ErrorShell Model 0%0.0%Muxδyδx248163264128Number of Elements Across Flange WidthFigure 6: Shell Element Model Convergence in Case 2 of the Advanced Analysis ExampleFigure 7: Mono-symmetric I-beam CantileverThe evaluation of the cantilevered mono-symmetric I-beam shown in Figure 7 consistently foundthat the commercially available programs treated the members the same as doubly symmetricsections. The load was applied to the member with considerations of rigid links from the endnode to the centroid of the cross section. Programs defaulted to the input node being at thecentroid location. User documentation provided guidance to the engineer to keep the crosssection centered at the centroid and to add any additionally necessary moment to the section(Dlubal Software 2019) or to offset the member such that the input node is the shear center to9
automatically include torsional effects from transverse loads (CSI America 2014). Thesemethods worked to achieve the desired loading effects when applied appropriately, but each hadlimitations such as accidentally applying a moment from applying F3, a pure axial loading, whileusing offsets. There was an exception observed in SAP2000 that automated some of theconsiderations of the offset shear center for certain situations, but those features were not utilizedfor the models used in this project. It was possible to obtain the singly symmetric responses inMASTAN2 and Abaqus. MASTAN2 treated the end node as the centroid of the cross section andadded in appropriate moments from only the transverse shear F2 as desired. The line elementmodels created in Abaqus utilized a generic cross section which allowed any location to bepicked as the reference node for the member. Applying loads at the centroid required theinclusion of a rigid link from the centroid to the reference node on the cross section which forthis analysis was defined as the shear center. The user documentation indicated the choice of thislocation was arbitrary (Dassault Systems 2015b) and initial evaluations found the use of theshear center was able to consistently solve the initial problems.3. Member ModelingThe work by Liu et al. (2018, 2019) has shown that MASTAN2 with recent improvements iscapable of solving problems with a non-doubly symmetric cross section. These problemscaptured various responses that cannot be found by typical doubly symmetric structural analysisprocedures. Rather than repeating these models within the other structural analysis programs toobtain a baseline comparison, three new single member problems were considered. Theseproblems presented additional member responses that would not occur within doubly symmetricmembers, but would be exhibited by non-doubly symmetric members.3.1 Pure Torsion on an AngleA single member subjected to equal and opposite end torques is one of the simplest twistingproblems that can be solved. Even when the ends of the member are free to warp the introductionof noncircular sections introduces warping and resulting deformations. A simple example of astandard I-beam section would result in a member that twists about the concentric shear centerand centroid and results in an overall shortening as to not cause a net tension (Attard 1986). Thisproblem is further complicated in a non-doubly symmetric section as the location of the shearcenter moves laterally as shown by Gregory (1960) for an equal angle. Gregory utilizedequilibrium of the cross section to calculate the movement of the shear center which wasvalidated by experimental results. Attard (1984) found a similar relationship for non-doublysymmetric sections using nonlinear torsion theory. Eq. 5 and Eq. 6 define the movement of theshear center of a singly symmetric section which is equivalent to the equations found by Gregorywhen assuming a thin-walled equal angle cross section.𝑣 𝛽1 /2(1 𝑐𝑜𝑠𝜙)𝑤 𝛽1 /2(𝜙 𝑠𝑖𝑛𝜙)(5)(6)where v is the displacement parallel to the plane of symmetry, w is the displacement inperpendicular to the plane of symmetry, β1 is the Wagner coefficient, and 𝜙 is the total twist ofthe section. This equation is slightly different from the one presented by both Gregory and Attarddue to the definition of β1 being updated to match the formulation used by MASTAN2 andCUFSM.10
Figure 8: Equal Angle Subjected to Pure TorsionThe model was based on the experiment completed by Gregory (1960) where an equal angle,brass member was subjected to pure torsion. Figure 8 shows the cross section dimensions of theangle and analysis model set-up. Material properties used were a modulus of elasticity of 89,660MPa and a Poisson’s ratio of 0.44. A 177.8 mm length segment was modeled as a cantileveredbeam with an applied end rotation up to 100 . The line element models were meshed with 64elements measuring 2.78 mm. At the end of the member a vertical rigid link was added from theend node to the shear center to track its position. The shell element model was defined at thecenterline of the cross section and meshed with a seed size of 0.487 mm for 30 elements per leg.The nodes on the fixed end where restrained for torsion and both transverse shears. Only the 2nodes on the tips and the corner node were restrained axially to allow the section to warp whilestill providing enough support to satisfy equilibrium. The same three nodes on the free end weretied to a reference point at the centroid where the end rotation was specified.Shear Center Displacement864w v (mm)Figure 9: Shear Center Displacement of an Equal Angle Subjected to Pure TorsionThe resulting displacements from the programs considered are shown in Figure 9 in addition tothe analytical solution utilizing a thin-wall approximation for β1. The relationship with the twistof the cross section made the overall response quite nonlinear. While a twist of 25 would11
already be significantly larger than expected in many structural applications, the first 25 of twistonly captures the first 1 mm of weak axis displacement in the plotted solution. Since the lateraldisplacements correspond to a specific rotation, Table 4 and Table 5 were also provided forreference. The two very distinct displacement patterns were expected. The solutions fromSAP2000 and RFEM are accurately displaying the result assuming a doubly symmetric section.A doubly symmetric section would have the rotation centered at the centroid which would beconcentric with the shear center. As
Analysis of non-symmetric cross-sections relative to the provisions of AISC 360-10 Edward J. Sippel1, Ronald D. Ziemian2, Hannah B. Blum3 Abstract Non-doubly symmetric sections are used for a variety of applications that range from the main member of a large portal frame to an