Transcription
4Q20 Financial ResultsJanuary 15, 2021 2021 Wells Fargo Bank, N.A. All rights reserved.
Supporting customers, communities and employees in 2020Supporting Our Customers Helped 3.6 million consumer and small business customers bydeferring payments and waiving feesFunded approximately 194,000 loans totaling 10.5 billion under thePaycheck Protection Program and provided an additional 51 millionin liquidity for Community Development Financial Institutions (CDFIs)and African American owned Minority Depository Institutions (MDIs)Helped over 635,000 homeowners with new low-rate loans to eitherpurchase a home or refinance an existing mortgage: over 265,000purchases and nearly 370,000 refisClosed 2.1 billion in new commitments for affordable housing underthe GSE and FHA programs (77 properties nationwide with 12,560total units including 10,650 rent restricted affordable units)The Renewable Energy & Environmental Finance group providedapproximately 2.4 billion in financing to the renewable energyindustry in 2020, a nearly 1 billion increase over 2019During the height of the market volatility caused by the COVID-19pandemic, Wells Fargo Investment Institute (WFII) hosted dailymarket volatility calls for clients; overall WFII hosted 44 marketvolatility calls in the first half of 2020 with more than 150,000participants4Q20 Financial ResultsHelping Our Communities and Small Businesses Charitable Contributions: Deployed 475 million in philanthropiccontributions, including:- 225 million in philanthropic contributions for COVID-19 relief- More than 84 million through the Open for Business Fund helpingentrepreneurs keep roughly 50,000 small business jobsInvesting in Minority Depository Institutions: (MDIs): Announced theplanned investment of up to 50 million in African American MDIsFighting Hunger: Provided 82 million meals to families in need, resultingfrom a combination of food bank events and a 10 million donation toFeeding AmericaAddressing Housing Insecurity: Kept 200,000 individuals housed throughour support of rent relief, eviction prevention and other housinginitiativesAssisting Employees Aided more than 23,000 employees via a 25 million grant to the WECare employee relief fundMore than 22,000 employees utilized enhanced childcare benefits amidthe pandemicRaised minimum hourly pay levels in a majority of U.S. markets withmore than 25,000 employees receiving a pay adjustment2
4Q20 resultsFinancial Results Net Income of 3.0 billion, or 0.64 per diluted common share– Revenue of 17.9 billion, down 10%– Noninterest expense of 14.8 billion, down 5% Results included:( in millions, except EPS)Restructuring charges impactROE: 6.4%ROTCE: 7.7%1Efficiency ratio: 83%2Reserve release due to the announcedsale of our student loan portfolioPre-tax Income (781) 757Customer remediation accruals impact(321)EPS(0.14)0.14(0.06) Effective income tax rate of 3.5% Average loans of 899.7 billion, down 6% Average deposits of 1.4 trillion, up 4%Credit QualityCapital and LiquidityCET1: 11.6%3LCR: 133%4 Provision for credit losses of (179) million, down 823 million– Total net charge-offs of 584 million, down 185 million Net loan charge-offs of 0.26% of average loans (annualized), down from 0.32%– Allowance for credit losses for loans of 19.7 billion, down 758 million from 3Q20 predominantly due to the announced sale of our student loanportfolio Common Equity Tier 1 (CET1) capital of 138.3 billion3CET1 ratio of 11.6% under the Standardized Approach and 11.9% under the Advanced Approach3Common stock dividend of 0.10 per share, or 414 millionThe Company’s Board of Directors approved an increase in the Company’s authority to repurchase common stock by an additional 500 millionshares, bringing the total authorized amount to 667 million common sharesComparisons in the bullet points are for 4Q20 versus 4Q19, unless otherwise noted.1. Tangible common equity and return on average tangible common equity (ROTCE) are non-GAAP financial measures. For additional information, including a corresponding reconciliation to GAAP financial measures, see the “Tangible Common Equity” table on page 22.2. The efficiency ratio is noninterest expense divided by total revenue.3. See page 23 for additional information regarding Common Equity Tier 1 (CET1) capital and ratios. CET1 is a preliminary estimate.4. Liquidity coverage ratio (LCR) is calculated as high-quality liquid assets divided by projected net cash outflows, as each is defined under the LCR rule. LCR is a preliminary estimate.4Q20 Financial Results3
4Q20 earnings in millions (mm), except per share dataNet interest income Noninterest incomeTotal revenueNet charge-offsChange in the allowance for credit lossesProvision for credit lossesNoninterest expensePre-tax incomeIncome tax 5vs. .3.5 %Effective income tax rate (%)vs. 3Q20 Net income 2,9922,0352,873 957119Diluted earnings per common share 0.640.420.60 0.220.04Diluted average common shares (mm)#4,151.34,132.24,234.619(83)Return on equity (ROE)6.4 %4.25.9220 bps50 bpsReturn on average tangible common equity (ROTCE)17.75.17.126060Efficiency ratio838179200400NM- Not meaningful1. Tangible common equity and return on average tangible common equity are non-GAAP financial measures. For additional information, including a corresponding reconciliation to GAAP financial measures, see the “Tangible Common Equity”table on page 22.4Q20 Financial Results4
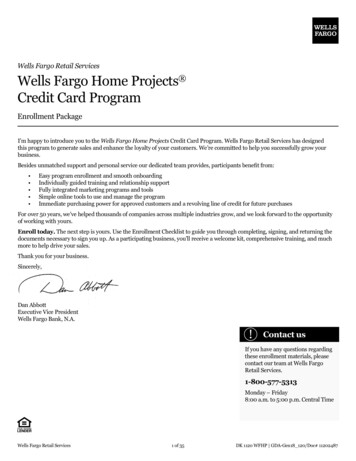
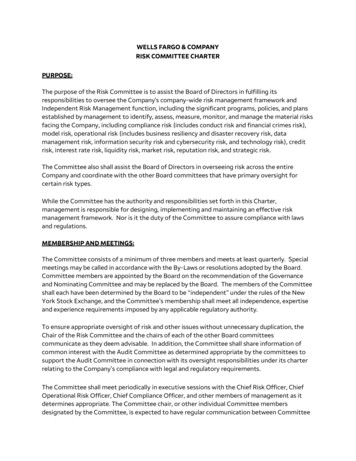
Credit quality of the loan portfolioAllowance for Credit Losses for Loans ( in millions)Provision Expense and Net Charge-offs on Loans ( in %0.32%6447694Q191,1139091Q20Provision for Loan Losses0.29%7512Q20Net 191Q2011,66911,54211,5162Q203Q204Q20(144)Net Charge-off Ratio Both commercial and consumer loan portfolios saw declines in losses and netcharge-off rates- Commercial net loan charge-offs were impacted by a small number of creditexposures in the commercial real estate portfolio- Consumer losses decreased as the impacts of government stimulus programs andcustomer accommodations, including payment deferrals, continued to impactperformance Nonperforming assets increased 709 million, or 9%, to 8.9 billion– Nonaccrual loans increased 706 million primarily due to increases in thecommercial real estate, residential mortgage, and lease financing portfolios, partiallyoffset by a decrease in the commercial and industrial portfolioCommercialConsumerAllowance coverage for total loans Allowance for credit losses for loans down 758 million almost entirely due to theannounced sale of our student loan portfolio Allowance coverage for total loans stable reflecting continued uncertainty due toCOVID-19Comparisons in the bullet points are for 4Q20 versus 3Q20.4Q20 Financial Results5
Consumer loan deferrals due to COVID-19 14.3 billion unpaid principal balance (UPB) of modified consumer loans were still in deferral as of 12/31/20, down from 22.7 billion as of 9/30/201As of December 31, 2020Unpaid principal balanceof modified loans still indeferral period % of loan class( in millions)Residential mortgage-first lien Residential mortgage-junior lienCredit cardAutoOther consumer1Total Consumer210,54441,35563731,911126 14,309As of September 30, 2020Unpaid principal balanceof modified loans still indeferral period % of loan class% As of June 30, 2020Unpaid principal balanceof modified loans still indeferral period% of loan 4,8801013 %317 22,738% 15 %638 36,140%310 %1. Excludes student loans in deferral due to the announced sale of our student loan portfolio and the transfer of these loans to loans held for sale. Prior period amounts of other consumer loans have been revised to exclude student loan balances indeferral of 740 million and 1.0 billion at September 30, 2020 and June 30, 2020, respectively.2. Excludes 15.9 billion, 19.1 billion and 7.1 billion at December 31, 2020, September 30, 2020 and June 30, 2020, respectively, of residential mortgage-first lien loans insured by the Federal Housing Administration (FHA) or guaranteed by theDepartment of Veterans Affairs (VA) that were primarily repurchased from GNMA loan securitization pools. FHA/VA loans are entitled to payment deferrals of scheduled principal and interest up to a total of 12 months.4Q20 Financial Results6
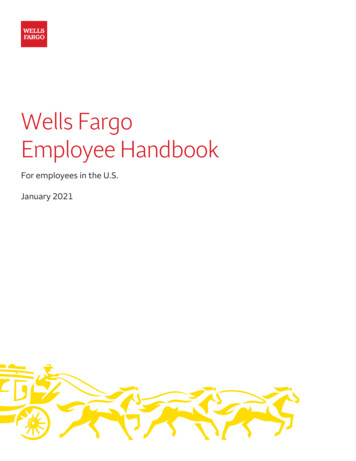
Average loans and depositsAverage Loans Outstanding ( in .50%520.5512.64Q191Q20Commercial Loans545.32Q20Consumer Loans931.7434.03.41%497.73Q20Average Deposits and Rates ( in 0145.4258.8266.2Total Average Loan YieldAverageDeposit Cost Average loans down 56.8 billion, or 6%, year-over-year (YoY), and down 32.0billion, or 3%, from 3Q20 driven by lower commercial and industrial loans andresidential real estate loans Total average loan yield of 3.39%, down 2 bps from 3Q20 and down 98 bps YoYreflecting the repricing impacts of lower interest rates, as well as continued loanmix 1,399.0192.3Consumer Banking and LendingCorporate and Investment BankingCorporate4Q20 Financial Results1,386.70.05%Commercial BankingWealth and Investment Management Average deposits up 58.2 billion, or 4%, YoY driven by growth in ConsumerBanking and Lending, and Wealth and Investment Management deposits Average deposits down 18.9 billion, or 1%, from 3Q20 reflecting targetedactions to manage to the asset cap, primarily in Corporate and InvestmentBanking, Corporate Treasury and Commercial Banking Average deposit cost of 5 bps, down 4 bps from 3Q20 and 57 bps YOYreflecting the lower interest rate environment7
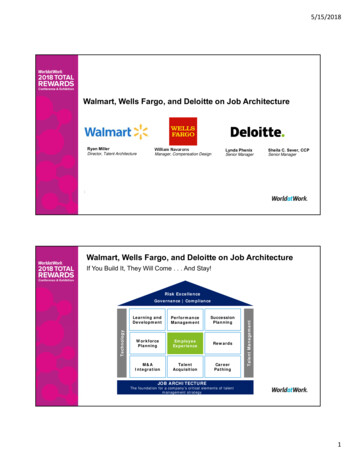
Net interest incomeNet Interest Income ( in millions)11,20011,3129,8809,3689,275 Net interest income decreased 1.9 billion, or 17%, YoY reflecting theimpact of lower interest rates, which drove a repricing of the balancesheet, lower loans primarily due to weak customer demand and elevatedprepayments, lower investment securities, as well as higher mortgagebacked securities (MBS) premium amortization (4Q20 MBS premiumamortization was 646 million vs. 445 million in 4Q19) Net interest income decreased 93 million, or 1%, from 3Q20 reflectinglower loan balances on lower customer demand and elevatedprepayments, and the impact of lower interest rates, which drove arepricing of the balance Net Interest Income4Q20 Financial ResultsNet Interest Margin8
Noninterest expenseNoninterest Expense ( in millions) Noninterest expense down 5% from 6246218,948- Operating losses down 1.3 billion and included 321 million of customerremediation accruals primarily for a variety of historical matters, comparedwith a 4Q19 which included 1.5 billion of litigation accruals- Other non-personnel expense down 9% on lower travel expense andadvertising expense as a result of the COVID-19 pandemic, and lowerprofessional and outside services expense due to efficiency initiatives- Partially offset by 781 million of restructuring charges, primarily severanceexpense, as well as technology impairments and facility closure costs Noninterest expense down 3% from 3Q204Q191Q20Personnel ExpenseRestructuring Charges4Q20 Financial Results2Q203Q20Operating LossesOther Non-personnel Expense4Q20- Personnel expense up 4% on higher incentive compensation expense- Other non-personnel expense down 5% benefitting from efficiency initiatives9
Consumer Banking and LendingSummary Financials4Q20 in millions (mm)vs. 3Q20vs. 3)35(98)16(25)(469)3516,4411,8211,364 (289)(904)660493(134)(980)6457324Q2010.7 enue by line of business:Consumer and Small Business Banking (CSBB)Consumer Lending:Home LendingCredit CardAutoPersonal LendingTotal revenueProvision for credit lossesNoninterest expensePre-tax incomeNet income 4,701 Selected MetricsReturn on allocated capital2Efficiency ratio1Retail bank branchesDigital (online and mobile) active customers 3 (mm)3Mobile active customers (mm)#5,03232.026.0 Total revenue down 5% YoY and 6% from 3Q20- CSBB revenue down 8% YoY primarily due to the impact of lower interest ratesand lower deposit-related fees on reduced transaction activity and higher feewaivers provided in response to the COVID-19 pandemic- Home Lending revenue down 21% from 3Q20 on lower servicing income andMSR valuation adjustments reflecting higher prepayments; lower mortgageoriginations were offset by higher spreads- Credit Card revenue up 2% from 3Q20 on higher net interest income on lowercustomer payment deferrals, as well as seasonally higher spend volume Provision for credit losses down from a 3Q20 build in allowance for creditlosses (ACL)- Net loan charge-offs of 332 million, down 37 million from 3Q20 on lowercredit card losses and higher home lending recoveries Noninterest expense down 12% from 3Q20 driven by lower operating lossesreflecting lower customer remediation expense ( 329 million in 4Q20 vs. 871 million in 3Q20)Average Balances and Selected Credit Metrics in billions, unless otherwise 90.62BalancesLoansDepositsCredit PerformanceNet charge-offs as a % of average loans 0.35 %1. Return on allocated capital is segment net income (loss) applicable to common stock divided by segment average allocated capital. Segment net income (loss) applicable to common stock is segment net income (loss) less allocated preferred stockdividends.2. Efficiency ratio is segment noninterest expense divided by segment total revenue.3. Digital and mobile active customers is the number of consumer and small business customers who have logged on via a digital or mobile device, respectively, in the prior 90 days.104Q20 Financial Results
Consumer Banking and LendingMortgage Loan Originations ( in 23.11Q2061.653.928.862%52%Debit Card Point of Sale (POS) Volume and Q203Q204Q201.1Q2023.12Q20105.32.32.33Q204Q20POS Transactions (billions)Credit Card POS Volume ( in billions)6.55.64Q192Q20POS Volume ( in billions)Refinances as a % of OriginationsAuto Loan Originations ( in 9.95.45.33Q204Q2022.917.54Q191Q202Q203Q204Q20Debit card purchase volume and transactions reflect combined activity for both consumer and business debit card purchases.4Q20 Financial Results11
Commercial BankingSummary Financials4Q20 in millionsRevenue by line of business:Middle Market BankingAsset-Based Lending and LeasingOtherTotal revenue 1,149 1,0292102,388691,690629Provision for credit lossesNoninterest expensePre-tax incomeNet income 473 vs. 3Q20vs. )(424)278(319)3Q203.0754Q1914.363 Total revenue down 18% YoY and up 1% from 3Q20- Middle Market Banking revenue down 26% YoY and 4% from 3Q20 due to theimpact of lower interest rates and lower loan balances- Asset-Based Lending and Leasing revenue up 5% from 3Q20 on higher loansyndication fees and net gains on equity securities Provision for credit losses down 80% from a 3Q20 ACL build- Net loan charge-off ratio of 17 bps, down 17 bps from 3Q20 driven largely bylower losses in Middle Market Banking Noninterest expense down 4% from 3Q20 on lower lease expense, as well aslower personnel expense reflecting efficiency initiativesSelected Metrics4Q208.6 %71Return on allocated capitalEfficiency ratioAverage loans by line of business ( in billions)Middle Market BankingAsset-based Lending and Leasing and OtherTotal loansAverage deposits4Q20 Financial 0192.3 102.788.2 12
Corporate and Investment BankingSummary Financials4Q20 in millionsRevenue by line of business:Banking:LendingTreasury Management and PaymentsInvestment BankingTotal Banking Commercial Real EstateMarkets:Fixed Income, Currencies and Commodities (FICC)EquitiesCredit Adjustment (CVA/DVA) and OtherTotal Markets424 3843481,156vs. 3Q20vs. al revenue3,106(181)(223)Provision for credit lossesNoninterest expensePre-tax incomeNet income1861,7981,122841 307(193)(295)(221)109(23)(309)(232)4Q208.8 %3Q2011.44Q1912.4Other Selected MetricsReturn on allocated capitalEfficiency ratio4Q20 Financial Results586155 Total revenue down 7% YoY and 6% from 3Q20– Banking revenue down 13% YoY primarily due to lower Treasury Managementand Payments revenue predominantly driven by the impact of lower interestrates and lower deposit balances, and up 4% from 3Q20 on higher InvestmentBanking revenue driven by higher advisory fees and equities origination– Commercial Real Estate revenue up 15% from 3Q20 on higher CMBS volumesand improved gain on sale margins, as well as an increase in low income housingtax credit income– Markets revenue down 26% from 3Q20 on lower trading volumes across FICCand Equities, as well as lower Credit Adjustment and Other revenue Provision for credit losses up from a 3Q20 ACL release– Net loan charge-off ratio of 29 bps, up 10 bps from 3Q20 on highercommercial real estate losses Noninterest expense down 10% from 3Q20 primarily reflecting lowerpersonnel expense driven by lower revenue-based incentive compensationAverage Balances ( in billions) 4Q2082.4 26.1258.8Trading-related assets190.4192.7234.7Loans by line of businessBankingCommercial Real EstateMarketsTotal loans4Q1992.8103.754.3250.913
Wealth and Investment ManagementSummary Financials4Q207153,0743,789 in millionsNet interest incomeNoninterest incomeTotal revenue Provision for credit lossesNoninterest expensePre-tax incomeNet income(4)3,056737548 vs. 3Q20(3)159156vs. Q198.793 Net interest income down 19% YoY driven by the impact of lower interest rates,partially offset by higher loan and deposit balances Noninterest income up 5% from 3Q20 primarily driven by higher asset-basedfees, as well as higher retail brokerage transactional activity Noninterest expense down 17% YoY primarily due to lower operating losses anddeferred compensation plan expense, as well as lower equipment expense froma 4Q19 which included 158 million of software impairment expense; up 2%from 3Q20 primarily reflecting higher financial advisor commission expenseSelected Metrics ( in billions, unless otherwise noted)4Q2023.6 %81Return on allocated capitalEfficiency ratioAverage loansAverage depositsClient assetsAdvisory assetsOther client assetsTotal client assetsAnnualized revenue per advisor ( in thousands) 1Wells Fargo Asset Management assets undermanagement 80.1169.9 081,8861,0139431,0026036075091. Represents annualized revenue (excluding Wells Fargo Asset Management) divided by average total financial and wealth advisors for the period.4Q20 Financial Results14
CorporateSummary Financials4Q20 in millionsNet interest income Noninterest incomeTotal revenueProvision for credit lossesNoninterest expense(273)vs. 3Q20 35vs. 6959301,817Pre-tax income (loss)(61)(187)(494)Income tax expense (benef
Dec 31, 2020 · Effective income tax rate of 3.5% Average loans of 899.7 billion, down 6% Average deposits of 1.4 trillion, up 4% Provisi