Transcription
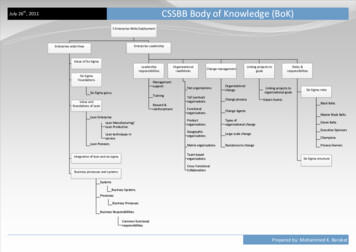
CSSBB Body of Knowledge (BoK)July 26th , 2011II Enterprise-Wide DeploymentEnterprise LeadershipEnterprise-wide ViewValue of Six SigmaLeadershipresponsibilitiesSix SigmaFoundationsManagementsupportSix Sigma gurusTrainingValue andfoundations of LeanReward &reinforcementLean EnterpriseLean Manufacturing/Lean ProductionLean techniques inserviceLean PioneersOrganizationalroadblocksChange managementFlat organizationsOrganizationalchangeTall (vertical)organizationsChange processFunctionalorganizationsChange AgentsProductorganizationsTypes oforganizational changeGeographicorganizationsLarge scale changeMatrix organizationsResistance to changeTeam-basedorganizationsIntegration of lean and six sigmaLinking projects togoalsRoles &responsibilitiesLinking projects toorganizational goalsSix Sigma rolesKaizen EventsBlack BeltsMaster Black BeltsGreen BeltsExecutive SponsorsChampionsProcess OwnersSix Sigma structureCross FunctionalCollaborationBusiness processes and systemsSystemsBusiness SystemsProcessesBusiness ProcessesBusiness ResponsibilitiesCommon functionalresponsibilitiesPrepared by: Mohammed K. Barakat
CSSBB Body of Knowledge (BoK)July 26th , 2011III Process ManagementProcess ManagementoverviewStakeholder nchmarkingTypesFinancial measuresMetricsCost-Benefit AnalysisOverviewCOQProcessBusiness level metricsReturn on Assets (ROA)CTDPerformanceOperations level metricsReturn on Investment (ROI)CTPProjectProcess level metricsNet Present Value (NPV)CTSstrategicProcess elementsProcess levelsHarry’s Six SigmaBreakthrough StrategiesMeasurement systemconsiderationsInternal Rate of Return (IRR)Payback PeriodBenchmarking sequencesTraditional cost conceptBenchmarking activitiesOrigin of quality cost measurementsJuran benchmarksCost of Poor Quality (COPQ)Omdahl CI processPreventionBenchmark approachesAppraisalInternal FailureExternal FailureOptimum quality costsQuality cost improvement sequenceQuality cost comparison basesTypical quality cost reportAdvantages of quality cost systemLimitations of quality cost systemQuality cost pitfallsPrepared by: Mohammed K. Barakat
CSSBB Body of Knowledge (BoK)July 26th , 2011IV Team ManagementTeam FormationTeam FacilitationTypes of TeamsTeam DynamicsTeam motivationTime ManagementGroupthinkRisky ShiftSynopsis of TeamApplicationsMotivationtechniquesTeam RolesThe HawthorneStudiesMember SelectionAbraham MaslowSelecting teammembersDouglas McGregorFrederick W.HerzbergAdding new teammembersEmployee Nominal GroupTechniqueVotingSample MeetingformsMultivotingEffort/ImpactForce Field AnalysisAffinity oachDMAICIDEATree DiagramsPrioritizationMatricesMatrix DiagramsProcess DecisionProgram ChartsActivity NetworkDiagramsOrganizational EmpowermentTeam StagesBelbin Team RolesTeam Lifecycle characteristicsTeam communicationsCompany team benefitsTeam member benefitsTeam resourcesManagement supportThe Steering Committee roleInitial project selectionTeam OperatingguidelinesTeam ConsensusPDCAManagement ActionsTeam diversityTeam building activitiesBrainstormingTeam MeetingstructureManagement &Planning ToolsProblem-solvingmethodologiesJob EnrichmentRemoving teammembersTeam sizeLaunching TeamsCommon teamproblem areasDecision-makingToolsA3 ReportTeam Evaluation &RewardTeam performanceevaluationTeam performancefactorsTeam reward andrecognitionManagementpresentationsPrepared by: Mohammed K. Barakat
CSSBB Body of Knowledge (BoK)July 26th , 2011V DefineVoice of thecustomerCustomeridentificationProject CharterCustomer feedbackProject stakeholdersIdentify the customerInternal customersCustomerrequirementsCustomer metricsselectionCollectingcustomer dataBusiness levelExternal customersEnd UsersIntermediateCustomersImpactedPartiesExternal customeridentificationCustomer serviceOperations levelProcess levelVoice of internalcustomerVoice of externalcustomerCharter contentDetermining criticalcustomerrequirementsProblem StatementProject ScopeGoal StatementCustomerexpectationsProject MeasuresProject Management& benefitsProject decisionanalysisProject portfolioanalysisWork BreakdownStructurePlanning toolsMilestones/DeliverablesNetwork planningrulesCustomer prioritiesResources requiredPERTVoice of theCustomer (VOC)CPMGantt (Bar chart)Critical to Quality(CTQ) TreeProjectdocumentationQuality FunctionDeploymentInstruments to gather dataCustomer loyaltyProject planelementsProject measuresCustomer needsCustomer surveysCustomer retentionProject managementBusiness CaseKano modelSurvey pitfallsCharter negotiationProject trackingProject ReviewSimplified approachesCustomer servicemeasurementCustomer dataanalysisStatistical testsLine graphsControl chartsMatrix diagramsCause-and-EffectMatrixPerceptual MapsMeasurement ofproject activityMilestonesreportingProject ReportDocumentarchivingPareto analysisOther comparativeanalysisPrepared by: Mohammed K. Barakat
CSSBB Body of Knowledge (BoK)July 26th , 2011VI Measure-DataProcesscharacteristicsInput & OutputvariablesData collectionProcess analysistoolsTypes of DataCollectionMethodsAttributeSIPOCValue StreamMappingCause &EffectMatrixValue StreamMapping iconsFlow Charts/Process MappingProcess flowmetricsProceduresLean glossaryLean e Stream(Value Chain)Venn (Circle)DiagramsValue FlowPull ValuePerfectionTakt TimeLean esAutomaticMeasurementLocationalData CodingConversion ofAttribute mplingMethodsCheck SheetsRecordingCheck SheetTally SheetChecklistsMeaslesChartsMeasurementSystem nAttributeScreensRandomSamplingTool suring dataaccuracy &integrityGage BlocksSpringVernierOpticalComparatorsSurface PlatesMicrometersRing GagesPlug GagesDial HardnessMeasurementTorqueMeasurementImpact TestSteel RuleUnits ofMeasurementR&RSI system unitsRange methodAverage &Range methodANOVA methodMeasurementCorrelationBiasLaser DesignedGagingLinearityNDT and NDETechniquesUltrasonic TestingDialMagnetic Particle TestingDigitalLiquid Penetrant TestingMetrologyGage ring Machines(CMM)Visual InspectionEnterpriseMeasurementSystemsPercent AgreementCalibrationTotal ProductVariabilityMeasurement ErrorCalibration IntervalCalibration StandardsISO 10012 iation (P/TV)ANOVAControl ChartMethodsEddy Current TestingRadiographyNeutron RadiographyOther NDTTechniquesPrepared by: Mohammed K. Barakat
CSSBB Body of Knowledge (BoK)July 26th , 2011VII Measure-StatisticsBasic StatisticsBasic TermsProbabilityGraphical MethodsCentral LimitTheoremBoxplotsStem and Leaf PlotsConditions forProbabilityScatter DiagramsSimple EventsDescriptive StatisticsMean lytical(inferential)studiesNull & AlternateHypothesisTest StatisticProbability Density FunctionTypes of errorsCumulative DistributionFunctionChi Square apability StudiesPerformance IndicesIdentifyingcharacteristicsShort-term vs LongtermChoosing correctDiscrete distributionIdentifying Specs/TolerancesUnionStudent’s t DistributionEvent RelationshipsDeveloping SamplingPlansExponentialDistributionVerifying Stability& NormalityLognormalDistributionNormal DistributionPerformance MetricsWeibullDistributionCapability IndicesWidely hipsMutually ExclusiveEventsCapability IndexFailure RatesTesting for eventrelationshipProcess CapabilityIndicesThe Additive LawNon-Normal DataAttributes DataThe Z ValueThe Multiplicative LawEnumerative(descriptive) studiesBivariate NormalDistributionF DistributionComplementof an eventStandard DeviationCoefficient ofVariation (COV)Poisson DistributionIntersectionMeasures of DispersionRange (R)Normal DistributionOther distributionsBinomial DistributionRun (Trend) ChartsModeMedian (Midpoint)Commonly useddistributionsCompound EventsSample CorrelationCoefficient (r)Measures of CentralTendencyBasic conceptsProcess CapabilityCpm IndexYieldRelationshipsRolled ThroughputYield (RTY)SigmaRelationshipsPrepared by: Mohammed K. Barakat
CSSBB Body of Knowledge (BoK)July 26th , 2011VIII AnalyzeMeasuring &ModelingRelationshipsbetween VariablesHypothesis TestingTerminologyRegressionSimple LinearRegression ModelThe Method ofLeast SquaresHints on RegressionAnalysisCalculating Se2, anEstimator of SigmaE2Inferences about B1(slope of line)Confidence Intervalestimate for slopeMultiple LinearRegression1st Order LinearModel2nd Order LinearModelMultivariate ToolsNull HypothesisPrincipal ComponentsAnalysis (PCA)Factor AnalysisCluster AnalysisCanonical CorrelationAnalysisMANOVACorrelation vs CausationOne-tail vs Twotail TestSignificancePractical vs StatisticalSignificancePower of TestHypothesesTests for MeansZ TestStudent’s t TestHypotheses Tests forVarianceChi Square TestHypothesis Tests forProportionsP TestPaired-ComparisonHypotheses Tests2 Mean, EqualVariances, t testSample SizeMulti-vari studiesSampling Plan DesignProcedureAttributes Data AnalysisLogistic RegressionLogit RegressionModelCorrelation CoefficientCoefficient of DeterminationTypes of errorsDiscriminant AnalysisLogit AnalysisCorrelationCoefficientTest StatisticMajor TestsProbit AnalysisEstimates2 Mean, UnequalVariances, t testEstimatorsPaired t TestF TestPoint EstimationInterval Estimate(CI)CI for MeansContinuous dataLarge samplesContinuous dataSmall samplesCI for VariationCI for ProportionANOVAA comparison of3 or more meansOne-Way ANOVATwo-Way ANOVAGodness-of-fit TestsUniform Distribution (GOF)FMEA Process StepsNormal Distribution (GOF)Risk Assessment & RPNPoisson Distribution (GOF)Risk AssessmentBinomial Distribution (GOF)Failure Mechanismsvs Failure ModesContingencyTablesAdditional AnalysisMethodsTypes of FMEAsGap Analysis“Where do we wantto be?” ToolsScenario PlanningDesign FMEAsHoshin PlanningContingency TablesProcess FMEAsBenchmarkingCoefficient ofContingency (C)System FMEAsSWOT AnalaysisPEST AnalysisCorrelation ofAttributesNonparametricTestsParametric vsNonparametric TestsNonparametric TechniquesKendall Coefficient ofConcordanceSpearman RankCorrelation Coefficient (rs)Kruskal-Wallis OneWay ANOVA by Ranks2 Factor, Two-Way ANOVAMann-Whitney U Test2 Factor, Two-Way ANOVAwith InteractionWilcoxon-MannWhitney Rank Sum TestComponents of VarianceLevene’s TestANOVA table for AxBFactorial ExperimentMood’s Median TestANOVA table forRandomized Block DesignFailure Mode andEffects Analysis(FMEA)Nonparametric TestSummaryFunctional FMEAsPorter’s fivecompetitive forces“Where are we now?”Root Cause AnalysisOrganizational Assessments“How are we going tomeasure results?”5 WHYs5 Ws and HOrganizational MetricsCause-and-Effect(Fishbone) DiagramsWaste AnalysisPareto DiagramsTypical Pareto DiagramOverproductionWeighted Pareto AnalysisInventoryFord 8D Problem SolvingFault Tree tingAdditional Classes of WastesPrepared by: Mohammed K. Barakat
CSSBB Body of Knowledge (BoK)July 26th , 2011IX ImproveDesign ofExperiments (DOE)IntroductionOne Factor DesignsTerminologyRandomized BlockPlansLatin Square DesignsDesign PrinciplesApplications of DOEDOE stepsExperimentalObjectivesSelect and scaleprocess variablesDesign guidelinesPlanning ExperimentsA typical DOEChecklistExperimentalAssumptionsInteraction casestudyGraeco-Latin DesignsHyper-Graeco-LatinDesignsFractional FactorialDesigns2-level FractionalFactorialPlackettBurman DesignsWaste Elimination5S (Housekeeping),WorkplaceOrganizationCycle TimeReductionCycle TimeReductionKaizenKaizenTheory of Constraints(TOC)Theory of Constraints(TOC)Kaizen BlitzPoka-Yoke / MistakeProofingContinuous FlowManufacturing(CFM)ImplementingImproved ProcessesPilot Run or PilotStudyRisk AnalysisSWOT AnalysisStrengths & WeaknessesOpportunities & ThreatsSimulationSWOT Analysis DeploymentStandard WorkSetup ReductionDemonstrationPrototype TestingVisual ControlsTakt TimeDrum-Buffer-RopeImplementationMethodsPEST AnalysisQuick ResponseManufacturingKanban-PullA Design from aDesign CatalogueA 3-factor, 3-levelExperimentEVOP (EvolutionaryOperations)Full Factorial DesignsFull FactorialexampleA comparison toFractional FactorialExperimental NotationPrepared by: Mohammed K. Barakat
CSSBB Body of Knowledge (BoK)July 26th , 2011X ControlStatistical ProcessControlObjectivesSelection ofvariabesOther Control ToolsControl ChartselectionControl ChartanalysisControl Charts for VariablesX-bar and R Chart TermsRationalSubgroupingSteps for constructingX-bar and R chartsX-bar and Sigma ChartsRationalSubgroupingSources ofVariabilityCapability from X-barand S chartsMedian Control ChartsControl ChartinterpretationFive Common RulesProcess In Controlwith Chance VariationTrendsMX-bar and MR ChartsX-MR ChartsRecurring CyclesP-ChartDesigning for Maintainability& AvailabilityTPM MetricsOther unusual patternsJumps inprocess levelControl Charts forAttributesTotal ProductiveMaintenance (TPM)Steps to implementTPMAutonomous TPMSmall Group ActivitiesVisual FactoryMaintain ControlsSustainImprovementsMeasurement SystemRe-analysisControl PlanTypes of ControlPlansControl PlanorganizationLessons LearnedTraining PlanDeploymentDocumentationOngoing EvaluationControl Plan inputsourcesDescription of ControlPlan line itemsControl PlansummaryPoints near oroutside limitsLack of variabilitynp-Chartc-Chartu-ChartRuns Test forRandomnessMoving AverageShort Run SPCOther Short RunapproachesPrepared by: Mohammed K. Barakat
CSSBB Body of Knowledge (BoK)July 26th , 2011XI Design for Six Sigma(DFSS)Common DFSSMethodologiesStage Gate ProcessDesign for X (DFX)Robust Design andProcessUsage of DFXTechniques & ToolsRobust Design introductionDFX characteristicsRobust Design ApproachProduct DevelopmentIDOVDMADVDMADOVThe French DesignModelRobust Design ExampleRobust DesignPrinciplesConcept DesignSpecial Design ToolsStrategic MethodsPorter’s FiveCompetitive ForcesThe Threat ofNew EntrantsThe Power ofSuppliersTactical MethodsTheory of InventiveProblem-Solving (TRIZ)Systematic DesignCritical ParameterManagement (CPM)Pugh AnalysisParameter DesignThe Power ofCustomersTolerance DesignSubstitute ProductsFunctional RequirementsIndustry RivalryParameter DesignSignal-to-Noise RatioPortfolio ArchitectingSet-Based DesignParameter Designcase studyThe Loss FunctionTolerance DesignTaguchi’s Quality ImperativesStatistical TolerancingPrepared by: Mohammed K. Barakat
July 26th, 2011 CSSBB Body of Knowledge (BoK) II Enterprise-Wide Deployment Enterprise-wide View Enterprise Leadership Value of Six Sigma Six Sigma Foundations Value and foundations of Lean Integration of lean and six sigma Business processes and systems Six Sigma gurus Lean Enterprise L