Transcription
Twitterrific AdsTLDRThe Iconfactory is offering advertising in our Twitterrific app: 1,000 taps on your ad willcost 100.Why Did We Create Our Own Ad Network?For many years, we used the Deck Network to provide ads for Twitterrific. We all lovedThe Deck, but for various reasons, the network shut down in March 2017. We lookedaround for other options and finally settled on AdMob as a provider.AdMob was disappointing. The ads were ugly, poorly targeted, and click through rates(CTR) were about 0.05% (or 5 taps for every 10,000 impressions.) We work hard tomake a great looking app and these mobile ads just crapped things up for very littlefinancial gain.After about a month of running these ads, we realized that it made more sense to pitchour own products and forego a few hundred dollars of ad revenue every month. Our adincome became our ad budget.We also contacted some developer friends and past clients to see if they wanted to bea part of our experiment. It added some variety and let us share the love.
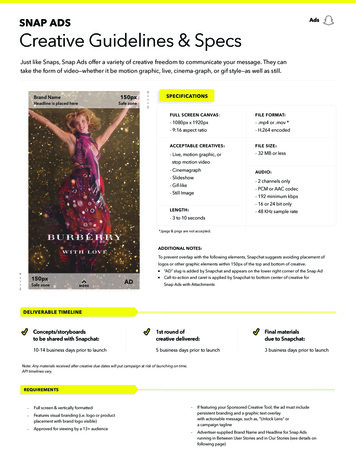
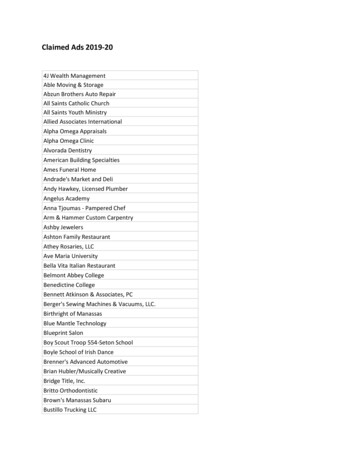
Test ResultsOur test ads ran much longer than we expected: we funded a Kickstarter just afterstarting running ads in March. The rest of 2017 was spent shipping a new Mac product!At the beginning of this year, we started analyzing the collected data. The followinggraphs show results from March 7th, 2017 to January 2nd, 2018 — we think theypresent a good case for opening up this system to other developers.Impressions and TapsOver approximately 10 months we went from serving about 250,000 ads per day toover 400,000:
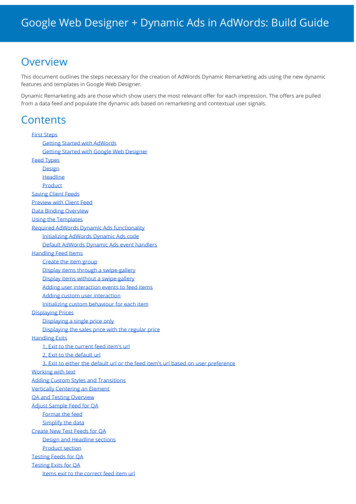
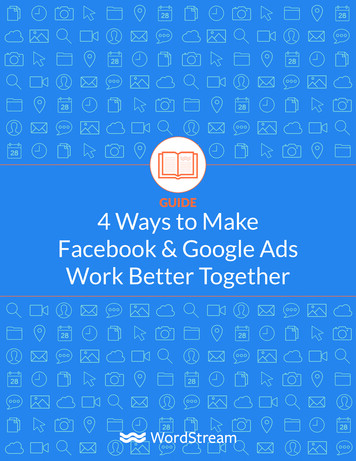
Throughout this time the ratio of taps to impressions (TTR Tap Through Rate) hasremained fairly constant - about 0.3% of the ads displayed result in a tap:Our suspicion that people would interact more with ads that were well designed andtargeted was confirmed: the TTR was 6x higher than it was with AdMob.Despite the fact that the ad rotation didn't change over the 10 month period, therewasn't a significant decline in TTR. Still, we expect the TTR to go up as we move newads into the rotation: somewhere like it was in April 2017 when the ad run was fresh.
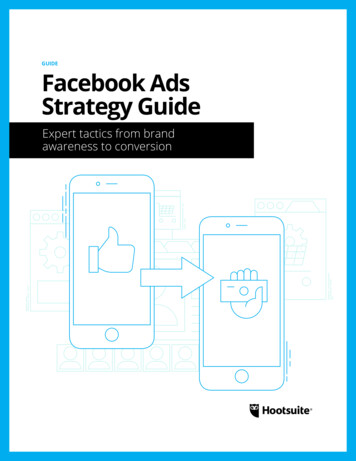
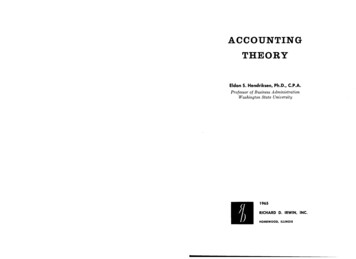
Product TypesTaps vary by type of product, but the deviation isn't large: all products generated about1,000 taps per month. Here's a graph that's broken down by product category:Twitterrific's own ads (to get rid of the banner) generated a lot of taps. To be completelytransparent here, that's one of the features of these ads for us — it's an incentive forpeople to upgrade. It's also one of the reasons we can offer these ads at such anattractive rate: ad revenue is not our primary source of product income.Another outlier was Tweet Seeker, one of our client projects – it's not too surprising thata Twitter-related app would perform well in a timeline of tweets.
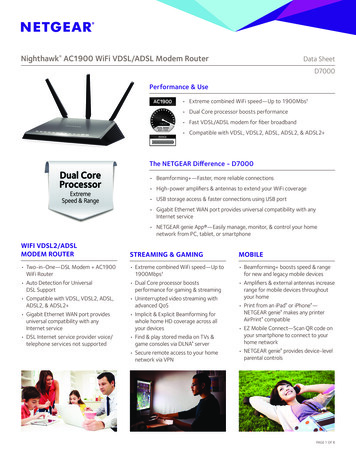
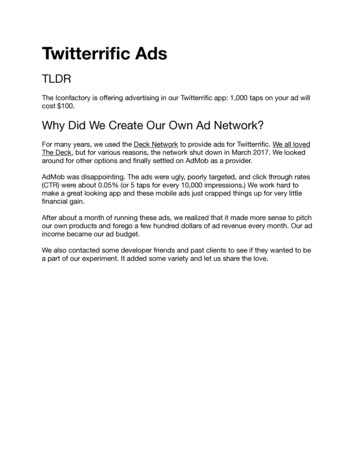
More importantly, apps for both iOS and macOS, services for design and development,and a book all generated a lot of traffic. This shows that the customers viewing theseads have a wide range of interests.Device BreakdownOur last graph shows how the ads performed by device. We served four times as manyads on the iPhone as the iPad. Customers on the iPhone were also 40% more likely totap on an ad:Twitterrific's install base is approximately 85% for iPhone and 15% for iPad. Thatexplains the large difference in impressions, but it's not clear why there's moreengagement on the smaller screen.
Purchase TrackingSince most of the ads we ran were for products on iOS, we also integrated our systemwith both the iTunes Affiliate Program and App Analytics.iTunes Affiliate ProgramOver the course of the test, we saw about a 30% conversion rate with affiliate links. Forevery 100 taps into an App Store page, there were about 30 purchases. Unfortunately,we can't tie this information directly into the sales of the products being advertised,because the affiliate program reports on all purchases done after the referral.App AnalyticsWe also generate a unique Campaign name and use a Provider ID to show results inthe App Analytics section of iTunes Connect. This lets us partially track the productpage views and sales for each ad run.The data in App Analytics is incomplete: there are missing Impressions metrics prior toAugust 18th, 2017. And there are still some bugs being worked out. This isunderstandable when you consider Apple is tracking billions of interactions onhundreds of million devices.Another anomaly is that Product Page Views in App Analytics are about half theamount reported as "clicks" by affiliate program. In theory, these should be fairly closesince they represent the same thing: someone looking at your app on the App Store.In spite of this incomplete dataset, we can still do some analysis. We'll focus on relativeamounts, using percentages instead of absolute values. (This also protects the privatesales data of the other developers in our beta test.)The products we're looking at are BitCam and Exify. Both are low-volume products thatearn a couple of hundred dollars per month.
The following table shows how many app units were sold for each product page viewin the last quarter of 2017:Campaigns - Q4 2017Conversion Rate(App Units / Product Page Views)BitCam Ad (COLUMBA 12)BITCAM SITEExify Ad (COLUMBA 13)4.5%38.9%0.2%EXIFY BLOG10.2%EXIFY SITE17.4%It shouldn't come as a surprise to see lower conversion rates on 2 paid app (Exify)versus a free one (BitCam has a 2 IAP.) We saw similar results across all the iOSproducts being advertised in Twitterrific, averaging 0.3% for paid apps and 5% for freeapps.The graphs below show unique product page views for the weeks from April toDecember 2017:
The SITE campaigns come from the respective web sites for BitCam and Exify. TheEXIFY BLOG campaign was from a new version announcement. COLUMBAcampaigns are ads in Twitterrific.This data shows that our ads provide a steady stream of customers to product pages.The decision that needs to made is where you want to put those eyeballs. For someproducts, you'll want to direct attention to a website where you can explain yourproduct and get a higher conversion ratio. For others, you're better served by sendingthe customer directly to the App Store where a download is just a tap away.After seeing this data we changed the Exify ad from the App Store to the productwebsite. We don't yet have enough data to analyze this change.
Website TrackingWe're also using ads to let folks know about our various websites. In cases where aproduct like xScope is not on the iOS App Store, we also open a web page instead.The ads provide a steady stream of visitors: the graph below shows visitors to ourDesign Services website for the last two months of 2017:The blue area is total number of sessions while the orange line is sessions generatedfrom our ads. (Columba is the project name: it's also the genus for carrier pigeons.)We ran two ads during that time and they generated 33% of the traffic to the site.That's roughly 35 sessions per day for each ad, or just over 1,000 new visitors eachmonth.Of course, most of these these visits don't lead to a signed contract, but they do agreat job of generating visibility for our business. Each visitor from a Twitterrific adspent three minutes on the site vs. our normal average of about 45 seconds per page.
Live DataThroughout the test, we used a simple website to keep track of the ads. This data wasalso used to generate some of the charts you saw above. If you'd like to see our adserver in action, check this out: https://iconfactory.com/columba/app/As we move forward, we'd like to maintain this transparency. In our opinion, there aretoo many hidden things in the mobile ad business. Trackers, by design, try to followyour movement without you knowing. We think this needs to change.
Pricing and StructureAds in Twitterrific are competitively priced: we'd prefer to serve smaller developers withgreat products instead of big brands that are just trying to get bigger. We know thatmargins are tight on iOS and that there's often not a lot of money available to marketyour product.Apple's own estimate for cost-per-tap with Search Ads is 0.50. This average price canvary quite a bit depending on what you're pitching.Our own experience with a recent campaign for Linea cost about 0.21 per tap.At just 0.10 per tap, an ad in Twitterrific is a fantastic value.Ad DisplayAds are displayed prominently at the top ofthe timeline.The ads are sized appropriately for both theiPhone and iPad and designed to work wellin both the dark and light theme. The ad isdisplayed for 50 seconds at a time.If you're advertising an iOS app, tappingon the ad opens your product pageabove the current timeline of tweets.Other ads are opened in a new Safariwindow using a URL you provide.
FeaturesFree ad design – we'll help make sure your ad looks great and reads wellNo invasive user tracking – we respect the privacy of our customersNot affected by ad blockers – ads are displayed natively in Twitterrific withoutweb viewsGreat audience – ads are seen by people who appreciate good design in iOSproductsIntegration with App Analytics – a unique campaign token lets you dig into thedetails using your provider IDCompatible with Google Analytics segments – we'll send any URL trackingparameters you needSecure – All resources loaded directly from iconfactory.com using TLS 1.2Accessible – Ads are read by VoiceOver to many loyal customersWe're also offering free ads for our design services clients. If you're working on a newapp, we can offer icon or UI design and help you get the word out at launch. Pleaseget in touch.
Terms of SaleAn ad run has a fixed cost of 100 US per month. We guarantee that the ad will get1,000 taps that either lead to your product page on the App Store or a web site. Wereserve the right to adjust inventory as necessary as ad viewership changes over time.All sales are final. No refunds or cancellations.The Iconfactory may edit ad content for technical, layout, or style-conformancepurposes (such as resizing images or minor copy editing, if necessary.) We'll be happyto help with the content or design of your ad.Once you purchase an ad, it must be approved by the Iconfactory before it goes live,which typically occurs within 24 hours. The Iconfactory reserves the right to reject anad for any reason, such as (but not limited to) billing issues, quality concerns,inappropriate content for a general audience, poor fit for the audience, etc.If your ad is not accepted, your payment will be refunded if possible, with the refundpro-rated if the ad has already run for a portion of its purchased duration.
App Analytics We also generate a unique Campaign name and use a Provider ID to show results in the App Analytics section of iTunes Connect. This lets us partially track the product page views and sales for each ad run. The data in App Analytics is incomplete: there are missing Impressions me