Transcription
Understanding YourCosts in an EvolvingPaymentEnvironmentSession 1: Cost Allocation Getting the Basics Right
Session Titles and DescriptionsSession 1: Cost Allocation: Getting the BasicsRightSession 2: Preparing Internal Systemsfor Gathering Cost DataSession 3: Cost Allocation Methodologyfor Value-Based Payment SystemsSession 4: Utilizing Cost Data to DriveProgrammatic Change 2020 Capital Link, Inc.
We’ve Got Some Catching Up To Do The introduction of modern costaccounting in health care may proveto be the same type of breakthroughthat it was in other industriesdecades ago.Michael Porter, Harvard UniversitySource: What is Value in Health Care?; New England Journal of Medicine 2020 Capital Link, Inc.
But It Won’t Be Easy“As organized today, primary care is a missionimpossible. Most primary care practices attemptto meet the disparate needs of heterogeneouspatients with a single “one size fits all”organizational approach. This leads to frustrationfor both patients and the clinicianswho attempt to serve them.” and the back office charged with keeping track of it all Redesigning Primary Care: A Strategic Vision To Improve Value ByOrganizing Around Patients’ Needs, Health Affairs, Porter, March 2013 2020 Capital Link, Inc.
And some things never change:Developing the capacity to accuratelytrack, allocate, and compare costsacross service lines is an essential toolin the successful management of ahealth center.But HOW you do it will change 2020 Capital Link, Inc.
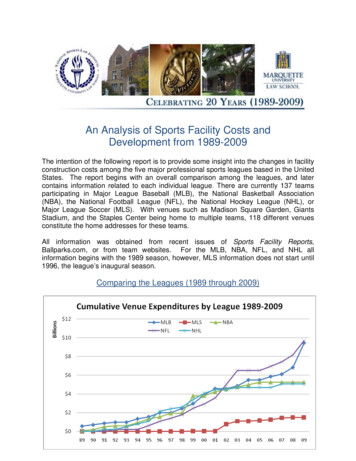
Getting From Here to There It’s not a straight line between payper visit and pay for outcomes!Graphic from Veritus Group 2020 Capital Link, Inc.
Current ApproachThis Capital Link publicationprovides guidance on the payper visit methodology.Available at:http://www.caplink.org/cost-per-visitOriginally published as a NACHC Information Bulletin entitled Cost Per Visit—MeasuringHealth Center Performance, in December 2003 and updated by Capital Link in 2018;http://www.caplink.org/cost-per-visit 2020 Capital Link, Inc.
ComponentsofCostPerVisitorPatientComponents of Cost per Visit or PatientAll expenses at the organization can be classified intoone of the following categories: Provider costDirect Support costDirect Enabling costOverhead costAncillary and Other cost 2020 Capital Link, Inc.
Provider CostProvider costs are direct costs incurred by billable providers deliveringservices. Provider cost does not include items such as subscriptions, continuingmedical education, or other non-personnel services.EXAMPLEEastside Family Health Center8.0 FTE physicians whose Total Salaries 1,400,000Fringe benefit and payroll tax rate of 20% 280,000Total provider cost 1,680,000Medical providers generated 25,000 billable visits over the period.Provider Cost Per Medical Visit at Eastside Family Health Center is 67( 1,680,000 divided by 25,000 visits)If those 25,000 visits involved 7,700 Medical patients:Provider Cost Per Medical Patient 218( 1,680,000 divided by 7,700 patients) 2020 Capital Link, Inc.
Provider Cost Per Visit/PatientFour key factors that impact upon providercost per visit are: CompensationProductivityNon-Clinical ActivitiesProvider Staffing MixSneak Peek: In a future presentation we discuss adding outcomes asan additional criteria. 2020 Capital Link, Inc.
Provider Cost Per Visit: CompensationWhile the labor market generally determines compensation for providers inprivate practice, compensation for providers working in health centers has beenbelow the market as a result of limited funding and other resource constraints.Family PracticeInternal urces:Health Center(50th percentile) (1) 193,800 (3) 192,800 175,500 240,000 233,572 93,180Physicians inPrivate Practice (2) 231,000 243,000 225,000 303,000 260,000 107,460*(1) Health Center Salary and Benefits Report 2019-2020 NACHC(2) Medscape Physician Compensation Report 2019 (*ZipRecuiter.com)(3) Average of Family Physicians with and w/o OB Deliveries 2020 Capital Link, Inc.
Provider Cost Per Visit/Patient: CompensationIn response to this challenging situation, many health centers have begunto implement incentive-based provider compensation systems thatreward providers on a variety of measures designed to hold themaccountable for aspects of service and production as determined bymanagement/board. An incentive compensation plan can be based onone or more of the following criteria: ProductivityPatients/members satisfactionQualityEffectiveness at managing utilizationPeer reviewCompliance with the health center’s policies 2020 Capital Link, Inc.
Provider Cost Per Visit/Patient:Non-billable FactorsWhen analyzing provider cost per visit/patient, it is necessary toalso take into account the non-billable factors related to providerperformance, including: Length of standard workweekNumber of clinic sessionsInpatient and on-call visitsClinical teamsTravel timeDocumentationContinuing Medical Education (CME) 2020 Capital Link, Inc.
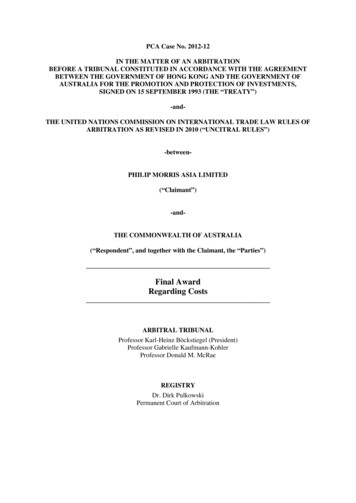
Provider Cost Per Visit/Patient:Provider Staffing MixThe mix of provider staff should be taken into account when analyzing providercost per visit/patient. The chart below illustrates why this is important:NursePhysicianPractitioner Assistant50th hysician% Avg. APPto Physician 100,000 101,100 193,80051.9%2,5042,7912,90091.3%Presumably this relationship holds between Psychiatrists and Psychiatric NursePractitioners (PNPs - avg. 2020 salary of 120,000), but the UDS does notprovide productivity figures for PNPs.Source: 2019-20 NACHC Salary Survey and 2018 UDS 2020 Capital Link, Inc.
Provider Cost Per Visit: ProductivityTotal SalaryCostTotal VisitsVisits /FTECost per VisitFamily Practice (4 FTEs) 700,00012,3003,075 56.91Internist (1.5 FTEs) 262,5004,4502,967 58.98Pediatrician (2 FTEs) 326,0006,5003,250 50.15OB/GYN (1 FTE) 225,0002,8502,850 78.94Psychiatrist (1 FTE) 230,0002,1002,100 109.52Psychologist (2 FTE) 186,0002,2001,100 84.55 1,929,50030,40015,342 63.47Physician TypeTotalIf Eastside Health Center can increase productivity by 15%, that would result in 34,960 visits.Assuming that salary costs remained the same, the total provider cost per visit would decrease to 55.19 - generating an additional 251,660 to be applied to incentives or other service costs. 2020 Capital Link, Inc.
Direct Support Cost Per Visit/PatientDirect Support costs are costs of non-provider staff or items that aredirectly involved in the delivery of healthcare services to patients.These include: Nurses (RNs and LPNs), medical receptionists, medical assistants,and clinical managed care support Direct dental support (includes dental assistants and dentalreceptionists) Mental health support (includes mental health receptionists) Supplies(Note that this is not an exhaustive list—some health centers may employ othersupport staff positions depending upon the major service lines offered.) 2020 Capital Link, Inc.
Direct Support Cost Per Visit/PatientEXAMPLEEastside Family Health Center3.0 FTE Dental Assistants whose Total Salaries 2.0 FTE Dental Technicians whose Total Salaries Total combined salaries Fringe benefit and payroll tax rate of 20% Dental supplies Total direct support cost 105,000 107,000 212,000 42,400 200,000 454,400There were 7,500 dental visits over the period under analysis.Direct Dental Support Cost per Visit at Eastside Family Health Center was 61If those 7,500 visits involved 3,000 Dental patients:Direct Support Cost per Dental Patient 152( 454,400 divided by 3,000 patients) 2020 Capital Link, Inc.( 454,400 divided by 7,500 visits).
Direct Support StaffCost Per Visit/PatientThe major factors that impact the Direct SupportStaff Cost Per Visit/Patient include: CompensationProductivityStaffing MixRatio of Support Staff to Providers 2020 Capital Link, Inc.
Direct Support Staff Cost Per Visit/PatientRatio of Support Staff to ProvidersThe average health center in 2018 (UDS) had: 1.75 FTE medical support staff (nurses, other medical personnel)per medical provider FTE;o 1.97 (2018) for health centers 75th percentile for medical providerproductivity.o 1.47 (2018) for health centers 25th percentile for medical providerproductivity 1.39 FTE dental support staff (Dental Assistants, Aides, Techs)per dental provider FTE .27 FTE mental health support staff (Other Mental Health Staff)per mental health provider FTE 2020 Capital Link, Inc.
Direct Enabling Cost Per VisitDirect Enabling costs are those costs associated with social services orenabling services that are outside of the traditional definition ofmedical services. These services may include: Case managementAcross the general patient population,Patient/community educationEnabling Cost Per Patient will vary asneed/utilization varies. However if patientsOutreach programsare grouped in care pathways, there mayTransportationbe more uniformity in utilization and anTranslation servicesability to document necessary costs toEligibility specialistsjustify reimbursement.Community health programsChild care programs, nutrition education, other SDOH outreachOther services outside the scope of the delivery of primary careservices even if these services are considered medicallynecessary 2020 Capital Link, Inc.
Overhead Cost Per Visit/PatientOverhead costs include: Rent, interest, and depreciation expense( other facilities costs) Administrative and facility staff salaries andfringe benefits Malpractice insurance Office supplies, legal/accounting fees Other costs not already classified into a category 2020 Capital Link, Inc.
Overhead Cost Per Visit/PatientApproximately 70%-75% of health center costs are personnel-relatedexpenses. Of the remaining 25-30% of costs, approximately 5-10%are facility costs and another 2-5% are other fixed costs, which aredifficult to reduce.On average, the percentage of total costs at a health center that areaccounted for by administrative overhead is between 25% and 40%.Cost reduction considerations include: Improving ProductivityStaffingAdministrative Staff CompensationFacility OverheadAdministrative Overhead 2020 Capital Link, Inc.Under a VBP system, thefeasibility of reducing costs bymanipulating these factorscould change.
Ancillary and Other Costs Per VisitAncillary and Other costs are those costs associated with services that are outsideof traditional primary or specialty care. It is important to note that with the growth,diversification and evolution of FQHC services some traditional ancillary servicessuch as vision and pharmacy can now be considered to be their own direct servicelines.Typical Ancillary services include: Radiology LaboratoryBe sure to base your calculation on medical visits (as opposed to total visits) unless the centeroffers both medical radiology and dental radiology services then separating those costs andassociated visits is appropriate.Planned and necessary routine Ancillary costs might be integrated into a care pathwayfor a chronic care group under a Pay-for-Outcomes system. 2020 Capital Link, Inc.
Ancillary Care Cost Per Visit/PatientDue to the wide variation throughout the country, there is no“standard” set of ancillary services offered at health centers Range of Services Providedo On-Site vs. Off-Siteo Availability of Serviceso Fixed and Variable Costs Utilization of Services Calculation of Costs QualitySneak Peek – but there could be, as part of an outcomebased set of procedures within a clinical pathway. 2020 Capital Link, Inc.
Ancillary CareCost Per Visit and ProcedureSTEP ONE : Calculate Laboratory DirectCostsSalaries and Wages3 Lab Technicians at 39,333 118,0001 Lab Supervisor at 67,00067,000Subtotal 185,000Fringe Benefits (20%) 37,000Subtotal Personnel Costs 222,000Direct Supplies 75,000Total Laboratory Direct Costs 297,000STEP TWO : Calculate Laboratory OverheadAllocationTotal Laboratory Direct Costs 297,000Total HC Direct Costs 3,000,000 9.9% 2020 Capital Link, Inc.
Ancillary CareCost Per Visit and ProcedureSTEP THREE : Determine Laboratory Overhead CostsTotal Overhead Costs 1,750,000Laboratory Overhead Allocation x 9.9%Laboratory Overhead Costs 173,250STEP FOUR : Calculate Total Laboratory CostsLaboratory Direct Costs 297,000Laboratory Overhead Costs 173,250Total Laboratory Costs 470,250STEP FIVE : Calculate Laboratory Costs Per Visit andLaboratory Cost per ProcedureTotal Laboratory Costs 470,250Total Health Center Visits 32,500Laboratory Cost per Visit 14.47Total Laboratory Procedures 22,000Laboratory Cost per Procedure 21.38 2020 Capital Link, Inc.
Summary of Componentsof Cost Per Visit/PatientBy analyzing the individual components of cost, it is possible to compare yourcenter’s cost-competitiveness to the average for all health centers on a per visitand per patient basis (from the 2018 UDS).Cost per Visit - 2018 UDS AverageLab & XEnabling Overhead Ray CostDirect Cost ServicesCost // Med./ VisitCost/VisitVisitVisitTotalMedical 125.82 17.57 69.77 5.91 219.07Dental 140.86 68.22 209.09Mental Health &Substance Abuse Cost 134.15 65.74 199.89Vision Services 115.50 61.85 177.35Pharmacy* 11.45 5.59 17.04Pharmaceuticals* 26.12 26.12Other Professional 86.49 42.37 128.85Other Related & QI* 7.00 2.71 9.71* based on Medical Visits/Patients only** based on all Visits/Patients 2020 Capital Link, Inc.Cost per Patient - 2018 UDS AverageEnablingLab & XDirect Services Overhead Ray CostCost /Cost /Cost // Med.Patient Patient Patient PatientTotal 407.18 56.87 225.78 19.12 708.95 363.44 176.01 539.45 644.19 154.29 37.05 84.53 256.74 28.57 315.71 82.63 18.09 125.77 11.06 959.91 236.92 55.14 84.53 382.52 39.64
In a FFS world, more visits equals more revenueso productivity is a keyRevenue Model driverBUTIn a typical capitated system, the FQHC isrewarded by not seeing the patient as often(but seeing more, different patients) 2020 Capital Link, Inc.
In a pay for outcomes world, it willlikely be up to the care team todetermine the optimal number of visitsto be able to demonstrate compliancewith quality care / outcomesmeasures.** This is the fundamental business model change that iscoming and will be discussed in greater depth in thefollowing presentations in this series. 2020 Capital Link, Inc.
Pitfalls, Barriers and ChallengesWhy Sometimes We Get the Basics Wrong Need for a very detailed Chart of Accounts to capture all costs bysite/dept./program Need to utilize EHR/Practice Mgmt. system to capture stats on denialsand other adjustments that affect finances Need to make sure the HR system can sufficiently track hours/costs bysite/dept./program.But not all the reasons are about our systems:– “Grants don’t really cover our overhead, so we don’t fully allocate ouroverhead costs to some funding sources.”– “This program is important to our patients so we keep offering it eventhough the funding has gone away.” 2020 Capital Link, Inc.
Conclusion: Looking Toward the FutureFee for Service and capitation are still the dominantmodalities for reimbursement of FQHCs and for thatreason the methodologies and issues discussed in thispresentation are still relevant for most centers.However, many centers may already beparticipating in ACOs, shared savings andPay-For-Performance programs thatchange the calculus. 2020 Capital Link, Inc.
Conclusion: Looking Toward the FutureNotwithstanding the complications ofoperating in this current hybrid paymentenvironment, centers face an irreversible(we are told) transition to a system in whichthey will be paid based on producingvalue/outcomes, which will be definedby the payer and the patient.(whose interests may not always align!) 2020 Capital Link, Inc.
Sneak Peak: What Will That Look Like?Valueis defined as theHealth Outcomes Achieved / Dollar Spent“In a well-functioning health care system, the creation of valuefor patients should determine the rewards for all other actors inthe system. Since value depends on results, not inputs, value inhealth care is measured by the outcomes achieved, not thevolume of services delivered, andshifting focus from volume to value is a central challenge.”What Is Value in Health Care?, NEJM Michael E. Porter, Ph.D 2020 Capital Link, Inc.
Sneak Peak:What Will That Look Like?“Cost, the equation's denominator, refers to thetotal costs of the full cycle of care for thepatient's medical condition, not the cost ofindividual services.To reduce cost, the best approach is often tospend more on some services to reduce the needfor others.” 2020 Capital Link, Inc.
Coming Up .Please join us for the next webinar in this series:Preparing Internal Systems for Gathering Cost DataFebruary 18, 2020, 3:00 ETWe review how to set up your internal systems ina way that will allow you to accurately capturecost data in a meaningful/flexible way. 2020 Capital Link, Inc.
Thank youContact Capital Link:Allison ColemanChief Executive Officeracoleman@caplink.orgJonathan ChapmanChief Project Officerjchapman@caplink.orgDave Kleiber, MBAProject Consultantdkleiber@caplink.orgVisit us Online: www.caplink.orgFor more information on the Delta Centerplease visit deltacenter.jsi.com oremail deltacenter@jsi.com
Salary 100,000 101,100 193,800 51.9% Average Productivity 2,504 2,791 2,900 91.3% The mix of provider staff should be taken into account when analyzing provider cost per visit/patient. The chart below illustrates why this is important: Source: