Transcription
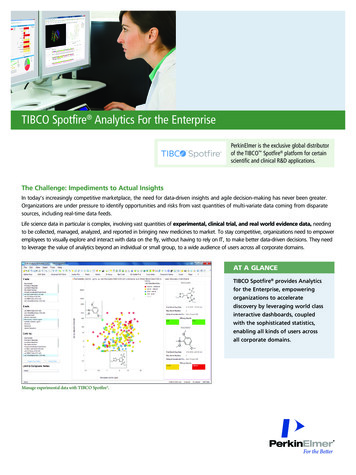
TIBCO Industry AnalyticsEnergy Solutions / Spotfire TemplatesTIBCO offers many pre-configured TIBCO Spotfire templates for data analysisin the energy industry. These analyses are configured with controls for datapreparation, visualization, and predictive analysis. Each template accepts aprimary data table containing raw starting data and optional metadata such as adata dictionary.A Spotfire user may replace the starting table with their own data to run theanalyses. Templates adapt to columns in the new data. Some coordinate columnsmay need to be specified, for example, date/time, latitude, and longitude. Theanalysis then progresses using sensible default settings, which can be tuned bythe user.DECLINE CURVE ANALYSISThis analysis fits thousands of well production decline curves in minutes. Resultsinclude Estimated Ultimate Recovery (EUR) and type curves. Monthly or dailyraw production data are input, then in batch mode, outliers are flagged withadaptive processes, and production curves are fit. Users can adjust which datapoints to include or exclude. Fit choices include hyperbolic, modified hyperbolic,exponential, stretched exponential, power law exponential, and Duong methods.Outputs include well-by-well fits and interactive visualization and q-D-bdiagnostic plots, with EUR specified by time or by a specified abandonment rate.Sensible default settings are used for initial analysis. Users can adjust settingsto control outlier detection; minimum, maximum Arps Hyperbolic b value;abandonment rate; modified hyperbolic transition; and other parameters.
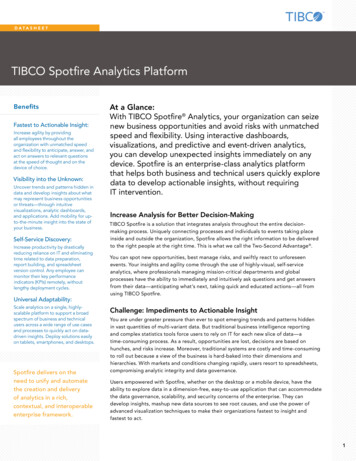
DATASHEET 2PRODUCTION PERCENTILES [P10, P50, P90]AND AGGREGATION ANALYSISAnalyzes production from existing wells to estimate the probability offuture production.PROBABILITY FITTINGAnalyzes production (for example, initial production or EUR) of a collection ofwells, showing P10, P50, P90 and other estimates of future production (p90is production that is 90% likely to be met). Interactive Spotfire filtering andmarking selects wells for analysis by geographical region, vintage, and otherattributes. Probability choices include lognormal (the most common statisticalframework), Weibull, and gamma parametric distributions, plus nonparametricbootstrap methods.AGGREGATION ANALYSISWhen the distribution has been fit, aggregation analysis finds the P10, and theP90 for average production of a group of planned wells (the more wells, thehigher the P90, even in the same distribution). Alternatively, it enables finding theminimum number of wells needed to attain a certain P10, P90 production value.CLUSTER ANALYSIS (PART OF COMPLETIONS OPTIMIZATION)Analyzes any collection of geological attributes (porosity, permeability, watersaturation, silica, TOC, and others) to find natural groupings of locations withsimilar attributes. This analysis provides an alternative to geographic/regionaltype curves. It also enables a geology-based approach to predict production bygeology outside a collection of producing wells (for example, the square gridshown below).
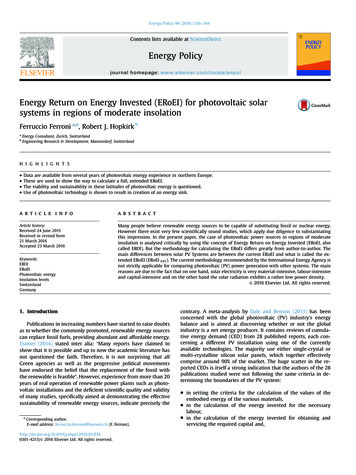
DATASHEET 3COMPLETIONS OPTIMIZATION WITH MACHINE LEARNINGAnalyzes well production (for example, initial production or EUR) as a functionof available information such as geology (porosity, permeability, formationthickness, and other attributes) and well completions information (for example,operator, lateral length, amount and types of fluid and proppant) or any relevantmeasurement or descriptor. It builds a multivariable model using machinelearning methods. It sorts and displays the most significant predictors fromthe candidate variables. And it displays the model fit to the data, enablinginvestigation of any unusually high or low production not fully captured by theavailable predictor variables.NORMALIZATION AND WHAT-IF SCENARIOSThe model may be used to create on-the-fly predictions for production, holdingcompletions steady across the play. If geology information is available in a newregion, the model can provide what-if predictions for production in the new region.
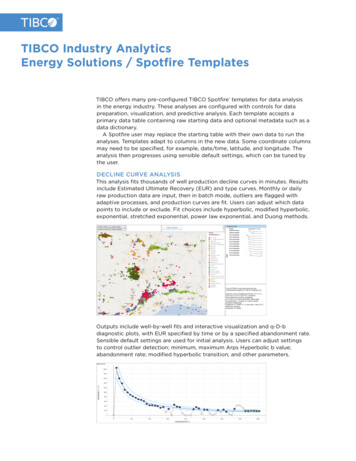
DATASHEET 4GEOSPATIAL INTERPOLATIONSMOOTHING AND INTERPOLATIONAnalyzes any spatially measured quantity (for example, production, geology bylatitude and longitude) and interpolates these values onto a grid in Spotfire. Thegrid can be used for adding contours and providing a complete grid of values formodeling. Users can control the degree of smoothing for interpolation; the defaultuses cross validation to select the smoothing parameters.INTERPOLATION TOOLBOXAnalyzes spatial data with many different variables and estimates missing valuesin each variable via interpolation. Each variable is interpolated separately becausedifferent measurements often have highly differing patterns of missing values.It replaces missing values in user-defined portions or the entire region via usercontrolled smoothing. A choice of replacement methods includes smoothed value,simple mean, and user-specified value.KRIGING ANALYSISComputes a sample variogram to establish spatial correlation behavior; fits thevariogram using a choice of spherical, exponential, or Gaussian functional forms withoptional nugget and sill effects. It uses the fitted variogram in Kriging analysis tointerpolate the measurements based on the natural statistics of the data.All of the above methods can be used to estimate missing values at specificpoints, compute interpolated values across a uniform grid of locations, andproduce contour maps in Spotfire.
DATASHEET 5PRODUCTION SURVEILLANCE AND DOWNTIME ANALYSISProvides a view of production across wells within plays, fields, regions, andoperators, including assessment of production loss due to planned or unplanneddowntime. Also provides visualization of root cause of downtime related toequipment and down hole and work processes, for example. Collections ofwells may be marked from a map chart in Spotfire or selected from otherattributes (fields, regions, operators, and others). Combined with the predictivemaintenance solution, this analysis enables optimal management of downtimeevents. The analysis may be applied to any production metric.FAILURE ANALYSIS AND PREDICTIVE MAINTENANCETo keep maintenance costs down, components (for example, pumps, valves, andbearings) operating across multiple locations need to be inspected or replaced ona timetable that avoids catastrophic (expensive) unplanned failure events.This template analyzes the failure characteristics of components from lifetimedata that includes both unplanned failures and planned maintenance, usingthe Weibull reliability analysis framework. Probability plots enable detection ofoutliers and multiple failure modes. Hazard plots distinguish between decreasingfailure hazard (burn-in or early part failures due to defective manufacturing)and increasing failure hazard (indicating the normal wear-out of parts). Thesecombine to form the typical bathtub shaped failure probability vs. time plot.An optimal maintenance schedule is found within this framework by balancingthe high costs of unplanned failures against the costs of planned maintenance.Components for which failure is extremely costly receive an aggressivemaintenance schedule.
DATASHEET 6REFINERY BLEND OPTIMIZATIONIn some types of production plants (chemicals, food, others) source componentsare combined to produce a blended product. Blended products need to staywithin certain specifications, even in the face of variations in the quantity orspecifications of the inputs. The objective is to minimize the cost of the product,as input constituents normally differ in their cost and availability.This analysis file performs general optimization for this blending problem. Inthe case shown, blended gasoline is produced, and the octane and vapor pressureneed to be within some specifications. The source components are domestic andimported blends, which have variable specifications as well as cost and availability.GASOLINE REFINERY BLEND OPTIMIZATION Your refinery produces two types of gasoline (top) which you sell to servicestations at prices shown. Produced gasoline must meet specifications shown (top). You have refined oil on hand as shown (bottom). Need to calculate the percentage blend of foreign and domestic oils thatmaximizes profit.PRODUCED GASOLINE LLINGPRICE, /BBLREGULAR2388100k50k 138PREMIUM239320k5k 151RAW MATERIALS (REFINED OIL) ON HANDVAPORPRESSUREOCTANERATINGINVENTORY,BBLCOST, /BBLDOMESTIC258580k 90FOREIGN159840k 150
DATASHEET 7ENERGY PROJECT PORTFOLIO OPTIMIZATIONOptimizes a portfolio mix across different plays/assets. The objective functionof the optimization is typically an asset return metric, for example, net presentvalue (NPV), and the constraints include capital expenditure (CAPEX) requiredto develop the play/field. Additional constraints may include forcing a mix ofthe different types of assets in the portfolio, for example, deep water, tight gas,unconventional oil, and others.The solution enables the user to select a CAPEX value and the constraints, andthen returns the mix of assets with NPV plotted vs. CAPEX. Spotfire drill-down tocontextual metadata and maps is readily available.
DATASHEET 8REAL TIME EQUIPMENT MONITORINGIndustrial equipment such as electric submersible pumps in the energy industry isheavily instrumented with sensors to capture important operational performancediagnostics such as motor temperature, intake pressure, and current. Historicalsensor data can be analyzed in Spotfire to identify leading indicators and correlationswith equipment issues, shutdowns, and failures, and then monitored in real time inTIBCO StreamBase to detect these conditions as they happen. When these leadingindicators are detected, an alerting and equipment management process is triggered.This process can include email notifications, tasks created in business processmanagement and asset management systems, notifications to mobile devices,publishing into databases, and a wide range of other notifications and alertingtasks for human and automated interventions. The published databases may becontinuously mined to understand patterns in the notifications. This can identifymore subtle patterns in the bad actors, for example, manufacturers with repeatedissues and differing operating conditions in different regions. Results from thismining build institutional knowledge and can be fed back in to the leading indicatorthresholds for continuous improvement of the system.To learn more about Spotfire Energy Solution templates and how you can implementthem in your operations, contact us at mdd@tibco, or call 866-240-0491.Global Headquarters3307 Hillview AvenuePalo Alto, CA 94304 1 650-846-1000 TEL 1 800-420-8450 1 650-846-1005 FAXwww.tibco.comTIBCO Software Inc. is a global leader in infrastructure and business intelligence software. Whether it’soptimizing inventory, cross-selling products, or averting crisis before it happens, TIBCO uniquely delivers theTwo-Second Advantage — the ability to capture the right information at the right time and act on it preemptivelyfor a competitive advantage. With a broad mix of innovative products and services, customers around the worldtrust TIBCO as their strategic technology partner. Learn more about TIBCO at www.tibco.com. 2015, TIBCO Software Inc. All rights reserved. TIBCO, the TIBCO logo, TIBCO Software, Spotfire, and Streambase are trademarks or registered trademarks ofTIBCO Software Inc. or its subsidiaries in the United States and/or other countries. All other product and company names and marks in this document are theproperty of their respective owners and mentioned for identification purposes only.08/21/15
TIBCO offers many pre-configured TIBCO Spotfire templates for data analysis in the energy industry. These analyses are configured with controls for data preparation, visualization, and predictive analysis. Each template accepts a primary data table con