Transcription
IBM ResearchModel-Data Ecosystems:Challenges, Tools, and TrendsPeter J. HaasIBM Almaden Research CenterNCAR CommunityAtmosphere Model (CAM)PODS 2014 2012 IBM Corporation
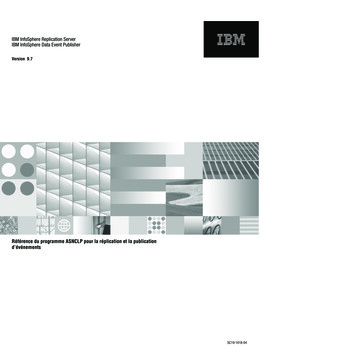
IBM ResearchGreat Progress in Analytics by the Database CommunityTransactions &Reports, IMSStatisticalanalysisData miningText analyticsMachine learningOLAPMassive Data/Cloud DBUncertain dataRelational model &SQLSemi-structured &Unstructured textWeb dataStreaming data Semantic data 20112012 IBM Corporation
IBM ResearchGreat Progress in Analytics by the Database CommunityStatisticalanalysisData miningTransactions &Reports, IMSText analyticsMachine learningOLAPMassive Data/Cloud DBUncertain dataRelational model &SQLSemi-structured &Unstructured textWeb dataStreaming data Semantic dataBUT: Why do enterprises care about(big) data in the first place? 20112012 IBM Corporation
IBM ResearchBecause Enterprises Need to Make DECISIONS“Analytics is a complete [enterprise] problem solvingand decision making process”Descriptive Analytics: Finding patterns andrelationships in historical and existing dataPredictive analytics: predict future probabilitiesand trends to allow what-if analysisPrescriptive analytics: deterministic and stochastic optimizationto support better decision making 2012 IBM Corporation
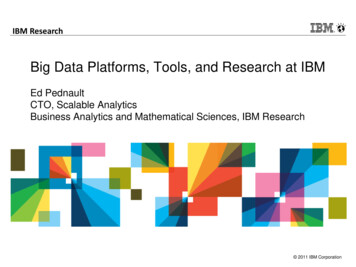
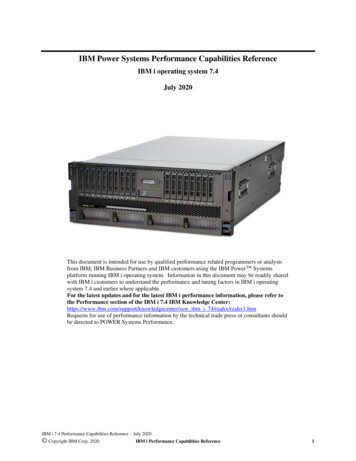
IBM ResearchShallow Versus Deep Predictive AnalyticsExtrapolationUnited States House Prices 275,000 250,000Actualprices 225,000 200,000 150,000NCAR CommunityAtmosphere Model (CAM) 125,000 100,000 75,000 50,000 198819861984198219801978197619741972 01970Price 175,000YearExtrapolation of 1970-2006median U.S. housing prices 2012 IBM Corporation
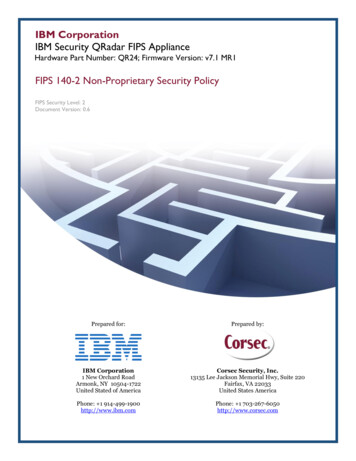
IBM ResearchData is dead Without What-If ModelsDescriptive and shallow predictiveanalytics are last resorts fordecision making in complex systems System structureCausal relationshipsDynamicsWhen you can’t find the domainexperts but they are the main focus ofmost database and IM technologyand research!Need to supplement data withfirst-principles simulation models The notion that quantitative, numericaldata are the only type of information neededto build an accurate model is flawed. In fact,I believe that the typical business obsession withnumeric data can do more damage than good.- Eric BonabeauDataGenerates hypotheses forModelsgeneratesGuides collection ofDataparameterizesModelsEcosystem of Data and Models 2012 IBM Corporation
Confluence of Researchon (Big) Data Management & Predictive AnalyticsIBM ResearchToday: An idiosyncratic whirlwind tour ofSimulation and information integration Information integration via agent-based simulationFusing real & simulated data (data assimilation)Imputing missing data with modelsand correcting models with data(e.g., wildfire spread)Data-intensive simulation Composite simulation models Data transformation between models Query optimization simulation-run optimizationIncorporating simulation into DB systems and vice versaModeling large complex systems(e.g., obesity, epidemics)Goal: Some interesting examples to stimulate your thinking - shaped presentation, additional topics in paper (metamodeling) 2012 IBM Corporation
IBM ResearchSimulation and information integration Information integration via agent-based simulationFusing real & simulated data (data assimilation) 2012 IBM Corporation
IBM ResearchInformation Integration via Agent-Based Simulation 2012 IBM Corporation
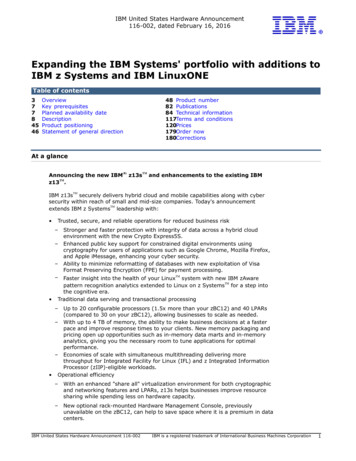
IBM ResearchII via Agent-Based Simulation: Marketing Example[Bonabeau, WSC 2013]Many drivers ofconsumer behavior Non-overlapping datasetsstudied in isolation are now integratedSource: Eric Bonabeau 2012 IBM Corporation
IBM ResearchII via Agent-Based Simulation: Marketing Example[Bonabeau, WSC 2013]Key problem is model calibration(see paper)Many drivers ofconsumer behavior - Maximum likelihood- Method of simulated moments- Machine learning?Non-overlapping datasetsstudied in isolation are now integratedSource: Eric Bonabeau 2012 IBM Corporation
IBM ResearchFusing Real and Simulated Data (Data Assimilation) 2012 IBM Corporation
IBM ResearchFusing Real and Simulated Data: Data AssimilationIntegrate real and simulated data via particle filtering [Xue et al., 2012]Classical Monte Carlo estimation of density n (x 1:n ) n (x 1:n ) / Z nN 1 ˆn (x 1:n ) i 1 X i (x 1:n ) so thatN 1:nE[g(X1:n )] g (x 1:n ) n (x 1:n ) dx 1:n1N g (x 1:n ) ˆn (x 1:n ) dx 1:n i 1 g ( X 1:n )N Can fail when n is large and/or n is complex (Zn is often the culprit)Importance sampling Sample from an “easier” importance density qn and correct:w n (x 1:n ) n (x 1:n ) / q n (x 1:n ) n (x 1:n ) w n (x 1:n ) q n (x 1:n ) / Z n andZn w n (x 1:n ) q n (x 1:n ) d x 1:n So draw N i.i.d. samples (particles) from qn and insert MC approx. for qn above: ˆn (x 1:n ) i 1WNi X i (x 1:n )N1:nwhere W w n ( X 1:n ) / j 1w n ( X 1:n )iNiNjZn not needed tocompute weights 2012 IBM Corporation
IBM ResearchData Assimilation, ContinuedSequential importance sampling (SIS)n Importance sampling where q n (x 1:n ) q 1 (x 1 ) k 2 q k (x k x 1:k 1 ) Recursive formula for weights:w n (x 1:n ) w n 1 (x 1:n 1 ) (x 1:n ) where n n (x 1:n ) n 1 (x 1:n 1 )q n (x n x 1:n 1 )SIS with resampling (SISR) Stabilize SIS by resampling according to Wn1 ,Wn2 , ,WnN at each step This is a sample from ˆn --- set all new weights equal to 1/N{ (2, 0.7), (4, 0.2), (5, 0.1) } { (2, 1/3), (2, 1/3) (5, 1/3) }Particle filtering (SISR for hidden Markov models) Discrete time Markov chain {Xn}n 1 with transition probability density pn(xn xn-1) Observation process {Yn}n 1 with probs pn(yn xn) of observation given true state Take n (x 1:n ) p n (x 1:n , y 1:n ) so n (x 1:n ) p n (x 1:n y 1:n ) Optimal importance density (minimizes variance of weights):q n* (x n x n 1 , y n 1 ) p n (x n x n 1 ) p n (y n x n ) 2012 IBM Corporation
IBM ResearchData Assimilation, ContinuedApplication to data assimilation[Xue et al., 2013] DEVS-FIRE model– Models stochastic progression of wildfire overgridded terrain– State {unburned, burned, burning-intensity}– Merge model data x and sensor data y: pn(xn yn) Gaussian sensor model: pn(yn xn) Original importance density: pn(xn xn-1), n 1– To sample from importance density (step 6), runsimulation for 1 time step– Analytical expressions (step 8) reduce to sensormodel– Ignores sensor readingrecall: q n* (x n x n 1 , y n 1 ) p n (x n x n 1 ) p n (y n x n ) Improved sensor-aware importance density underdevelopment– Model and sensors weighted according to“confidence”– Kernel density estimation used to obtainanalytical expressions (step 8) 2012 IBM Corporation
IBM ResearchData-intensive simulation Composite simulation models Data transformation between models Query optimization simulation-run optimizationIncorporating simulation into DB systems and vice versa 2012 IBM Corporation
IBM ResearchComposite Simulation Models 2012 IBM Corporation
IBM ResearchComposite Simulation Models: Overview Motivation:– Domain experts have different worldviews– Use different vocabularies– Sit in different organizations– Develop models on different platforms– Don’t want to rewrite existing models! Composite modeling approach– Combines data integration with simulation– Loose coupling via data exchange– Metadata for detection and semi-automaticcorrection of data mismatches– Ex: Splash prototype [Tan et al., IHI 2012] Advantages– Model curation and re-use– Flexibility– No need for “universal” platform, API, etc. 2012 IBM Corporation
IBM ResearchComposite Simulation Models: Splash ExampleSADL metadata languageKepler adapted for model compositionDesign-timecomponentsRun-time components:19- Kepler adapted for model execution- Experiment Manager(sensitivity analysis, metamodeling, optimization)Data transformation tools:- Clio - Time Aligner (MapReduce algorithms)- Templating mechanism 2012 IBM Corporation
IBM ResearchComposite Simulation Models: Data transformation I Algebra of “gridfields” [Howe and Maier, VLDBJ 2005]– Grid: collection of cells (of various dimension) incidence relation x ‚ y if- dim(x) dim(y) and x y; or- dim(x) dim(y) and x “touches” y– Gridfield grid mappings from cells to data values– Key operation on gridfields: regrid Maps set S of source cells to a given target cell Applies aggregation functions to S to compute associated data values– Restrictions (a kind of selection) commute with regrid optimizationsSource: Howe & Maier 2012 IBM Corporation
IBM ResearchComposite Simulation Models: Data Transformation IIMassive scale time alignment Common Splash time alignment operation:Interpolating (massive) time-series data Parallelize on Hadoop Linear interpolation: easy Cubic spline interpolation: hard– Computing spline constants solvingmassive tri-diagonal linear system– Solution: distributed stochastic gradientdescent algorithm (see paper) h0 h1 3 h1 6 A 0 0 h16h1 h23 h26 000 00 00 0 hm 360 0hm 3 hm 23hm 26 0 hm 2 6 hm 2 hm 1 3 0Solve: Ax bd2 d1 d1 d0 h1h0 d3 d2 d2 d1 b h2h1 dm dm 1 dm 1 dm 2 hm 2 hm 1 2012 IBM Corporation
IBM ResearchComposite Simulation Models: Optimizing Simulation RunsMotivating example: Two models in series, 100 repsDeterministicStochastic Naïve approach: execute composite model(i.e., Models 1 & 2) 100 times A better approach:– Execute Model 1 once and cache result– Read from cache when executing Model 1Question: Can result-caching idea be generalized?IBM Confidential 2012 IBM Corporation
IBM ResearchOptimizing Simulation Runs (Continued)Result-Caching: General Method for Two Models [Haas, WSC 2014] Running example: Two models in seriesStochasticStochastic Goal: Estimate E[Y2 ] based on n replications Result-caching approach:Ex: n 10, n 41. Choose (0,1] (the re-use factor)2. Generate n outputs from Model 1 and cache them3. To execute Model 2, cycle through results4. Estimate by n nIBM Confidential 1 ni 1Y2;iDependent 2012 IBM Corporation
IBM ResearchResult-Caching: Optimizing the Re-Use FactorBudget-constrained setting [Glynn & Whitt 1992]n n Cost of producing n outputs from Model 2 is Cn j 1 1;j j 1 2;j (random) Under (large) fixed computational budget c:– Number of Model 2 outputs produced is N(c) max{n 0 : Cn c}– Estimator is U(c) N(c) (average of a random # of dependent variables)Key result: a central limit theoremSuppose that E[ 1 2 Y 22 ] . Then U(c) is asymptotically N( , g( ) / c).where r 1 / and g( ) ( E[ 1 ] E[ 2 ]) Var[Y2 ] 2r r (r 1) Cov[Y2 , Y2' ](expected cost per obs.) x (variance per obs.) Thus, minimize g( ) [or maximize asymptotic efficiency 1 / g( ) ]IBM Confidential 2012 IBM Corporation
IBM ResearchResult-Caching: The Optimal Re-Use FactorOptimal solution Assume that Cov[Y2 , Y2' ] 0 Approximate r by 1 / 1/2 E[ 2 ] / E[ 1 ]* ' Var[Y2 ] / Cov[Y2 , Y2 ] 1 1Observations– If Model 1 cost is large relative to Model 2, then high re-use of output– If Model 2 insensitive to Model 1 (Cov Var), then high re-use– If Model 1 is deterministic (Cov 0), then total re-useOngoing work Generalize to 2 models (math similar to sampling-based join-size estimation) Develop techniques to compute/approximate needed statistics In general: Extend query optimization to “simulation-run optimization”IBM Confidential 2012 IBM Corporation
IBM ResearchIncorporating Simulation into DB Systems 2012 IBM Corporation
IBM ResearchIncorporating Simulation into DB I: MCDBCREATE TABLE optionVal (opID, val) AS[Jampani et al., TODS 2011]Stochastic tableFOR EACH o IN optionWITH oVal AS optionSim(optionSim Value generation (VG) functionVALUES(o.initVal, o.r, o.sigma, o.k, o.m, o.T))SELECT o.opID, v.VALUE FROM oVal vRandom DB DSchemaVG FunctionsParameterTablesQ(D) Select c.opID, SUM( ) GeneratorQ(d1)Q(d2):Q(dn)Instantiations(possible worlds)EstimatorEˆ [ totVal ]ˆ [ totVal ]Varˆ [ totVal ]q.01HistogramError bounds Implementation uses “tuple bundle” techniques, parallel DB & MapReduce execution Challenges: extreme quantiles, threshold queries ( 2% decline in sales with prob 50%) 2012 IBM Corporation
IBM ResearchIncorporating Simulation into DB II: SimSQL Re-implementation and extension of MCDB [Cai et al., SIGMOD 2013]– Database sequence: D[0], D[1], D[2], – VG function for D[i] can be parameterized on any table in D[i-1]– I.e., Can simulate database-valued Markov chains Potential application to massive-scale agent-based simulations[Wang et al., VLDB, 2010]IDLocXLocYDStateVaccinated? agent12.342.48InfectedN agent23.573.72recoveredN agent350.2080.9susceptibleY Agent-based simulation sequence of self-joins– Often, only nearby agents interact, so can exploit parallel processing– Not really explored in SimSQL setting 2012 IBM Corporation
IBM ResearchIncorporating DB Systems into Simulation 2012 IBM Corporation
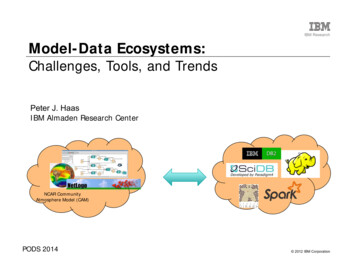
IBM ResearchIncorporating DB into Simulation: Indemics Indemics system for simulating epidemics [Bisset et al., ACM TOMACS 2014]– Uses HPC for compute-intensive tasks (disease propagation), DBMS for dataintensive tasks (state assessment and intervention)– Observer can stop simulation, input an intervention, then resumeSource: Bisset et al.Network epidemic modelIBM ConfidentialDatabase of demographic info 2012 IBM Corporation
IBM ResearchIndemics, ContinuedExample intervention strategy:Formal model of system: Coevolving Graphical Discrete Dynamical System (CGDDS) Partially observable Markov decision process (POMDP)IBM Confidential 2012 IBM Corporation
IBM ResearchConclusions Intertwining of data management and simulation — both are needed Many problems in early stages, need formalization Lots of room for interesting research!Data-intensive simulation Composite simulation models Data transformation between models Query optimization simulation-run optimizationIncorporating simulation into DB systems and vice versaSimulation and information integration Information integration via agent-based simulationFusing real & simulated data (data assimilation) 2012 IBM Corporation
IBM ResearchModel-Data Ecosystems:Challenges, Tools, and TrendsPeter J. HaasIBM Almaden Research .com/researcher/view.php?person us-phaasNCAR CommunityAtmosphere Model (CAM)PODS 2014 2012 IBM Corporation
Data Generates hypotheses for Guides collection of parameterizes generates Ecosystem of Data and Models System structure Causal relationships Dynamics Need to supplement data with first-principles simulation models The notion that quantitative, numerical data are the only type of information