Transcription
CER Residential ElectricityResults 2016Prepared for:Prepared by:&May 2016
What to look out for in this presentation Rising satisfaction levels across all suppliers. Evidence of an active market, with increased competitive customer contact across allsuppliers Customers continue to demonstrate sticky behaviour, notwithstanding the high level ofcontact activity i.e. limited switching activity Some concern about the perceived ease of switching Bill understanding is quite low, as just half (48%) of electricity customers can easilyidentify if their bill is an actual reading or an estimateEvidence of migration to electronic channels for bill receiptKnowledge of cost composition (unit and standing charge) of the bill remains lowImproved awareness of competitors, particularly more recent competitors in the marketLimited evidence of engagement with offers, probably underpinned by perceived lack ofclarity of the offers availableEmerging concern about the tone and frequency of the customer interactionSwitching inertia is increasingly demonstrated by automatic rollover at contractrenewal time3
Respondent &Market Profile4
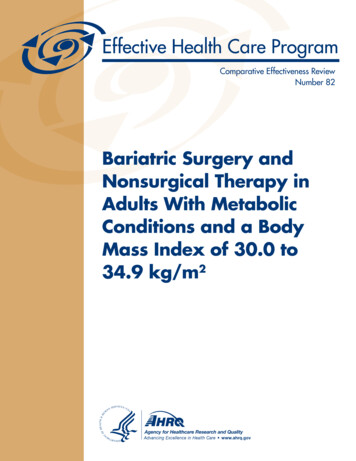
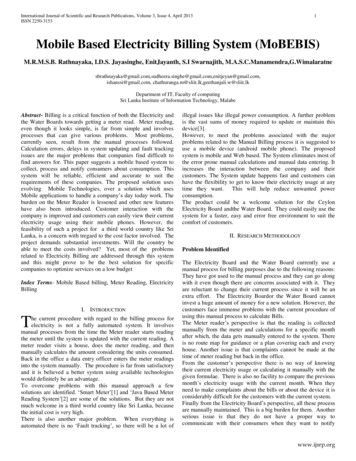
Respondent profile – age, social class, locationBase: All adults 16 - 1002Age profile of respondentsSocial grade of respondents50% 50%55%45% 45%39%22% 23%19%21%21% 23%18%18%20%16%15%15%7%7% 2014201520163%18-25 18%16%16%26-3536-4546-5556-646%4%65 ABC1C2DEType of HomeRespondents distribution is representative ofthe national population (of all utility decisionmakers).Surveys were completed across 120 pairedsampling FLocation of respondentsCounty2%4%20142015201698%House2016Other ** Other – all other countries* Social grade definition: AB-Upper/Middle category, C1C2-Lower Middle & Skilled Workers, DE-Unskilledworkers, F-Farmers.5
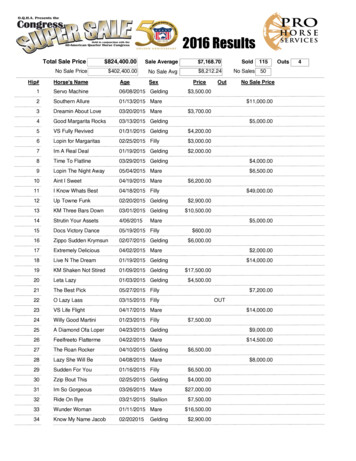
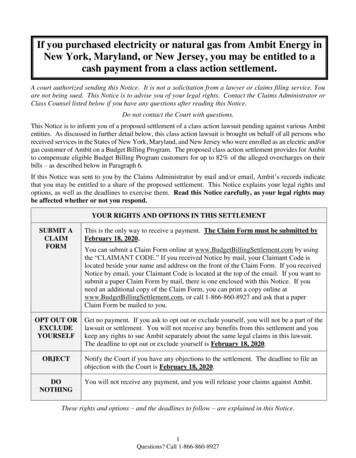
Incidence of having Natural Gas in home and gas provider(Base: All adults 16 - 1,002)Gas Provider(All who have natural gas – 316)Do you also use Natural Gas inyour home?Bord Gais32%(34%)EnergiaYes( ) 2015 Flogas5660%12SSE Airtricity(66%)2015%23Electric Ireland68%%62NoThe incidence of those who use natural gas in their home remains consistent with2015 levels at 1 in 3. Bord Gáis continues to be the main provider despiteexperiencing a decline of -4%pts. SSE Airtricity has also experienced a decline inmarket share vs 2015 levels, to the benefit of Energia ( 4% pts).620%16%2%2%
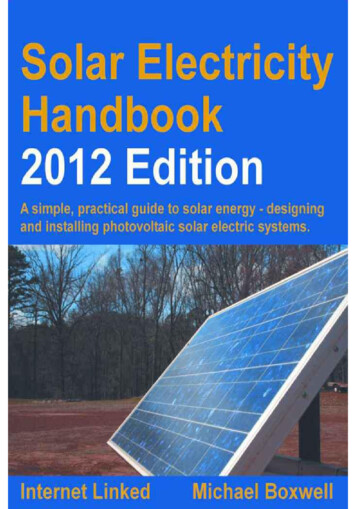
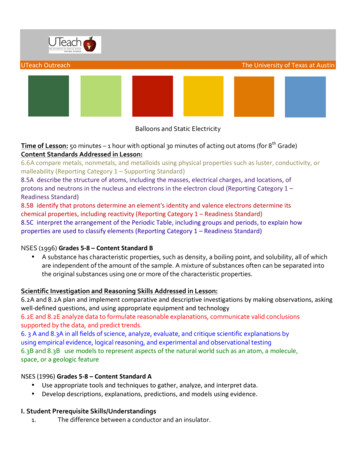
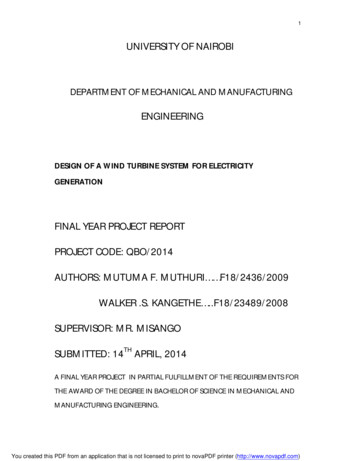
Market share: residential electricity suppliersBase: All adults 16 - 1,002Electricity Market shares trends60%58%63%61%62%60%Electricity market shares– consumers with both gas and electricity(Dual %3%20142%2013Electric 610%4%20122013(Proportion of respondents with each supplier) 37%28%35%25%19%34%41%17%29%15%15%SSE Airtricity43%4% 3%0%2014Electric IrelandBGEPrepaypowerEnergia20158%0%2016SSE Airtricity(Proportion of respondents with each supplier)Electric Ireland continues to hold the largest market share across the entire residentialelectricity market.Bord Gáis energy however has now replaced Electric Ireland as the main energy provider acrossdual fuel customers ( 6% pts vs 2015).The main changes in the market centre on: Electric Ireland’s share of the market has been in gradual decline, especially among thedual fuel sector, while BGE has increased its share. SSE Airtricity’s continues to gradually decline; among the total electricity market and alsothe dual fuel sector. Energia has been active in the market and now claims 8% of all dual fuel customers. PrePayPower’s market share of the electricity has remained stable, but declined amongdual fuel customers7
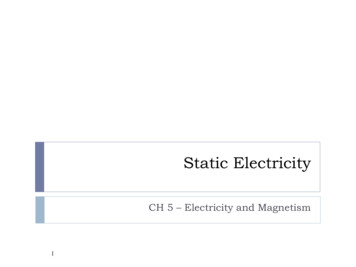
Satisfaction with current supplierBase: All adults 16 - 1,002Overall satisfaction with current supplierOverall satisfaction by current 5%60%20112011 2012201320142015201620122013Electric IrelandBGEPrePayPowerEnergia201420152016SSE AirtricityOverall satisfaction with current supplier has been gradually improving over the lastthree consecutive waves. BGE customers reported the highest level of satisfaction at 91%. All otherproviders recorded similar satisfaction levels at 85%-89%. Satisfaction has improved across the majority of providers, most noticeably BordGáis Energy and SSE Airtricity. The main reason for dissatisfaction with current supplier continues to berespondents experiencing a price increase/prices being too expensive.9
Billing & Payment11
Respondent profile – bill delivery and frequencyBase: All who receive any bill - 839Method of receiving a bill – by supplier*Method for receiving bill3%Website(2) 3%52%52%89%79%83%84%65%59%Post71% 320162014SSE() 2016BGE201320142015ElectricIreland20162016Electric EnergiaIreland Energia*: Selection of multiple methods possible The incidence of customers receiving their electricity bill via email has increased againthis wave after a period of stabilisation in 2015. Energia & SSE Airtricity customers show the highest tendency of receiving their bills viaemail.12
Respondent profile –payment modelsBase: All adults 16 - 1,00213Payment models – trends since 20116%4%5%1%1%3%1%3%2%9%9%2%5%5%9%Payment models – by ectdeductions16%Prepayment(keypad)1%1%5%5% 1%4%8%0%7%10%26%Prepayment(keypad)Prepayment(token meters)Prepayment qualiser66%Receive and paythe billsReceive and pay thebills2011 2013201420152016SSE AirtricityBGEElectric IrelandEnergiaThe majority of customers continue to receive and pay their bills, however the incidence ofcustomers on Equaliser prepayments has increased on 2015 levels and now stand at 1 in 10. 2012Householdbudget/directdeductionsBGE and SSE Airtricity customers continue to be more likely to be on an Equaliser paymentstructure.Additionally, some 16% of all customers are on a night saver tariff (identical to 2015 levels).13
Frequency of prepayment statements(Base: All on prepayment - 163)Current SupplierStatement at least threetimes per year detailingconsumption and anymoney owed47%One statement of yourusage per yearDon't 7%%%%56565826304442502814--*Caution small base Almost half of prepayment customers receive a statement three times per year. PrepayPower customers are most likely to receive an annual statement.Question added 201614* Caution small base
Respondent profile –payment methodsBase: All who receive any bill - 830Prevalence of direct debitProportion in receipt of FEABase:All receive any bill - 83016Base: All adults 16 - 1,00278%83%80%74%72%70%68%63%59%52%50% 51%46%47% 47%46%44%39%39%35%34%49%44%42%40%17% 5%n/a n/a n/a n/aOverallElectric Ireland2011 2013SSE Airtricity20142015n/a n/a n/aOverallEnergia2016ElectricIreland2012BGE2013SSE Airtricity2014n/a n/a n/a n/aPrePayPower2015Energia20163 in 5 of all those who receive a bill currently pay by direct debit – which brings the use ofdirect debit to its highest level yet. 2012BGE10%6%2%SSE Airtricity and Energia customers are the most likely customers to pay by direct debit.With regards to FEA, the proportion of all customers on FEA has experience a slight increase( 4% pts), after a period of decline and is highest amongst BGE and Electric Ireland.16
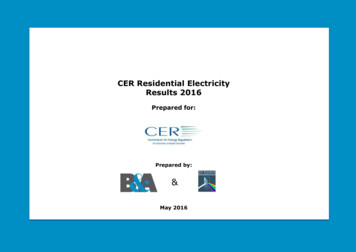
Awareness of costs: unit and standing chargeAbility to estimate unit cost and standingchargeAmong consumers able to provide anestimate Base: All adults 16 - 1002(Base: 118)Estimate of unit costAverage: 14.85cAble to provideestimate’12’13‘14’15’1650%41%Unit ding charge20%24%25%13%12%17%12%11%16%13%9%6%3%2% 10c201210c to 15c201315c to 20c2014 20c20152016 The incidence of customers who are able to provide an estimate of unit costs and standingcharge shows no improvement on the low levels reported in 2015. The unit cost and standing charge estimates provided were highly variable, with the averageestimated unit cost being 14.85c (12.75c in 2015) and the average standing charge being 32.12 ( 26.37 in 2015).17
Competition &Deregulation21
Awareness of electricity competitors(Base: All adults 16 - 1,002)Prompted awareness of Electricity SuppliersUnprompted awareness of Electricity Suppliers96%94%22 94%92%201288%2013201468%68%58%55% 54%52%96%96%93% 90%92% 248%64%63%54%29%25%12%5%2%BGESSE %4%Energia*201355%27%18%12%Electric ric IrelandBGESSE AirtricityPrepay powerEnergia*0%0%Pinergy*PandaPower******Added 2016 Unprompted awareness reflects top of mind presence in the consumer mind andprovides a good estimate of perception of competitive activity in a market. Spontaneous awareness (the true measure of awareness) has improved across thenewer entrants to the energy market; PrepayPower, Energia, Pinergy and PandaPower.BGE has also experienced an increase at spontaneous level, while awareness of ElectricIreland and SSE Airtricity has declined. At a total awareness level (prompted), awareness of the more established companies;Electric Ireland, BGE and Airtricity has been in steady decline across a number ofwaves.22
Awareness of electricity offers on the market(Base: All adults – 1,002)Current supplierElectricIrelandAll adultsOffers where the unit price of electricity is fixed for a certaintime, usually 12 or 24 months41%Offers based on receiving Cashback or credit to youraccount after you change supplier32%Offers based on a certain % reduction on the unit rate ofelectricity25%Offers based on a % reduction on your entire billOffers based on your membership of the suppliers rewardsor loyalty schemeOffers based on a % reduction on the standing charge17%15%9%None of these 35%Bord GáisSSEPrepayEnergiaEnergyAirtricity 52916151718121314201321871011114131203634Over one third of electricity customers are not aware of any electricity offers which are currently onthe market. Current customers of SSE Airtricity and Energia show the greatest awareness of offers, whilecurrent customers of Electric Ireland are less likely to be aware of what offers are currently onthe market.25
Ability to compare & understand offers from electricitysuppliers(Base: All aware of electricity offers – 672)Understanding of electricity suppliers’ offersSwitched last12 monthsNot switchedpast 12 months4%21%25%31%17%2%10%16%33%19%16%3%% ever used a pricecomparison website to checkenergy prices2016TotalSwitchersNonSwitchers11%23%9%(Base: all respondents 1002)Assessment of difficulty with comparing offers54% of those whoused a pricecomparison sitefound comparingoffers easy.32%17%9%21%16%26%5%29%16%14%9%6%Very difficultDifficultNeither easynor difficultEasyVery easyNotattemptedcomparison 26% of consumers who claim to be aware ofcurrent electricity offers stated that theyhave a small degree, or no understanding, ofthese offers (29% in 2015). 20% of customers who are aware ofelectricity offers which are currently on themarket find it difficult to compare offers(down from 1 in 5 in 2015). Those who switched within the past 12months claimed a higher understanding ofcurrent offers vs non switchers (48% vs35%) 1 in 6 however, stated that they had notattempted to compare offers (2015: 21%). 1 in 10 of all adults claimed to have used aprice comparison website to compare offers –rises to 23% among last 12 month switchers.26
Factors which would help to compare offers(Base: All adults – 1,002)All who findcomparingoffersdifficultAny helpClear indication / disclosure of all applicable charges47%Highlighting the duration of any discounts (e.g. 12, 18 months, etc.)43%Present an annual bill amount on in all advertising / marketingmaterial comparing suppliers 37%58%52%44%Clear indication/disclosure of all applicable charges was thought to be the most helpful aspectwhich would help customers when comparing offers.29
Customer understanding of the roles of electricity supplierand ESB NetworksBase: All adults 16 - 100230Responsibilities of ESB Networks and the electricity supplierEIESB NetworksSupplier 201320142015Generation of electricity30%32%31%Repairing power failures28%26%Maintenance of the electricitygrid27%Reading the meterBilling and paymentESB 78%67%68%2013201420152016Awareness of ESB Networks role in generating electricity, repairing power failures andmaintenance of electricity grid is gradually improving.30
Switching &Engagement32
Switching: Contact by Suppliers(Base: All adults 16 1,002)Contacted by other supplierwith a view to switching inthe past 12 monthsContact 420152016Electric Ireland48%47%50%Bord Gáis41%56%68%SSE Airtricity49%49%68%PrePayPower41%43%57%n/an/a64%In person –Home Visit44%(51%)201456%Contact by Supplier(49%)( ) 2015YesNoEnergia Suppliers appear to have been more active in trying to attract non customers vs 2015 levels( 7% pts). The most common method of contact continues to be home visits, however phone and contactvia mail has also increased. BGE, SSE Airtricity & Energia appear to be the most proactive overall during the past 12months.33
Switching – rates and supplier sharesBase: All adults 16 - 1,002Proportion switching by year(at least once in last 12 months)Proportion switched in last 12 months x supplier20% (22% in 2015) ofthose on dual fuelswitched at least oncein past 12 2015201622% (30%in 2015) ofswitchersswitchedback toprevioussupplier22%16%18%6%ElectricIrelandBGESSE Airtricity PrePayPower The overall rate of switching has remained steady with 2015 levels at 12%. Energia holds the largest share of switchers, within the last 12 months.Energia 22% of switchers switched back to their previous supplier (30% in 2015 & 27% in2014), while 20% of dual fuel customers switched supplier in past 12 months (22% in2015 & 26% in 2014).34
Profile of those who have never switched(Base: All adults 16 - 1,002)Total never switchedNon-Switchers x AreaNon switchers x social class79%65%58%47%TotalABC1C2Non-Switchers x AgeUrbanFRural72%56% DENon-Switchers x 6460%63%61%49%65 DublinLeinsterMunsterConn/UlsterYounger and older customers are the least likely to have ever switched electricity suppliers. Farmersare also less likely to have switched.36
Contact method used to switch suppliers(Base: All who switched in past 12 months – 143)Method used to switch – by supplier switched toMethod used to switch393%6%65%61%56%55%20%2013Home VisitPhone(contacted)Phone (initiated Supplier website Price Phone cted)Home visitWriting2014 2015 2016 2014 2015 2016 2014 2015 2016 2015 2016 2016EI*Urban57%7%20%9%6%-Rural54%13%17%-11%- 3%14%201522%22%18%19%5%9%201412%9% 9%6%4%7%BGE*SSEAirtricity*Prepay* Energia*power*Caution small base sizeSwitching continues to be mainly carried out during a visit to their home. However,switching via price comparison websites has been gradually increasing.39
Electricity - Switching Package/option with existingsupplier(Base: All non-switchers - 859)For Non switchers - Changed the package or offerwith existing supplier – e.g. for a better discount95%(98%)5%Yes(2%)No( ) 2015 5% of non-switchers changed their package with their supplier to avail of a betterdiscount (similar to 2015 levels).41
Switching intention(Base: All non-switchers – 859)Why did not complete the switch - 26Started / attempted to switch butdid not complete the switchANY ImportantReasonANY NotReason0When I tried to switch, my suppliercontacted me with a better offerThe switching process became toocomplicated3%(3%)97%YesNo194334The supplier informed me that they werecancelling the switch due to my arrearswith my current supplier4037I could not receive the necessary code formy PAYG device39I was informed by my old supplier that Iwould incur a fee for breaking my contractearlyThe supplier informed me that they wouldbe seeking a larger deposit due to myarrears with my current supplier(97%)4635353434The switch was taking too long30I changed my mind and no longer wantedto switch30( ) 2015I was informed that I would no longerreceive the FEA allowance on my bill1627322842 Similarly to 2015 findings, just 3% of non-switchers started to switch but didn’tcomplete the process. The main reasons given for not switching were due to suppliers giving a better offerwhen customers said they were switching and the switching process becomes toocomplicated.45
Experience of switchingRating the overall experience of switching(Base: All who switched last 12 months – 143)Likelihood of switching in next 12 months –among any switchers% likely to switch again within 12 months91%84%91%41%46%91%81%30%33%33%46%2012 38%201350%201430%30%20142015201623%Easy45%31%Very easy61%48%2015201620122013Ease of switching has fallen back on 2015 levels (-10% pts), while likelihood to switchagain in the next 12 months has remained steady since 2012.46
Experience of switching process(Base: All who switched last 12 months – 143)47Rating the overall experience of switching Trend - % agree with statement2016TrendKnew who to contact75%Understood what wasrequired79%Understood what wasoffered by the new supplier80%Actual changeover wentsmoothly81%Understood duration ofoffered prices79%Understood amount ofdeposit %2012201320142015201647Reflective of the decline in theoverall ease of switching. Ratingof the various aspects involved inthe switching process have alsofallen back on 2015 levels. Understanding of the depositamount has remained steadysince 2012 however.
Rating of outcome – switching supplier and packageRating the overall experience of the actual switchingpackage with current supplier(Base: All who switched package - 86)Rating the overall experience of switching supplier(Base: All who switched last 12 months – 143)Trend - % agree with statementFactor2016FactorTrendTrend - % agree with statement20122013 2014 2015 2016Bill reduced byexpected amount73%70%62%74%69%73%Bill reduced byexpected amount66%67%61%62%70%New supplierservice satisfactory85%85%78%86%85%85%Understood theterms83%88%75%81%83%Understood theterms81%86%84%89%85%81%Complied with theterms79%86%72%72%76%2012 2013 2014 2015 2016 The incidence of switchers who found their bill to have reduced by the amountthey expected has improved, while understanding of terms and conditions hasdeclined on 2015 levels. New supplier providing a satisfactory service hasremained steady however. Among those who have switched their package there has been an improvement inall aspects.48
Most frequently rated reasons for not switchingConsidered switchingamong non switchersReasons for not switching during last 12 months53Primary/importantReason16%Yes84%No Trust and current suppliersatisfaction continue to bethe main reasons for notswitching. Among those who havenever switched and did notconsider switching, trust is
BGE and SSE Airtricity customers continue to be more likely to be on an Equaliser payment structure. Additionally, some 16% of all customers are on a night saver tariff (identical to 2015 levels). Payment models – trends since 2011 Payment models –by supplier 86% 84% 78% 79% 74% 5%