Transcription
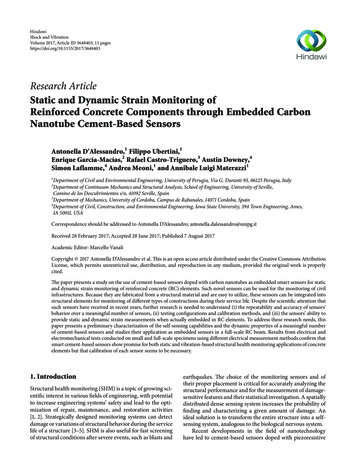
HindawiShock and VibrationVolume 2017, Article ID 3648403, 11 pageshttps://doi.org/10.1155/2017/3648403Research ArticleStatic and Dynamic Strain Monitoring ofReinforced Concrete Components through Embedded CarbonNanotube Cement-Based SensorsAntonella D’Alessandro,1 Filippo Ubertini,1Enrique García-Macías,2 Rafael Castro-Triguero,3 Austin Downey,4Simon Laflamme,4 Andrea Meoni,1 and Annibale Luigi Materazzi11Department of Civil and Environmental Engineering, University of Perugia, Via G. Duranti 93, 06125 Perugia, ItalyDepartment of Continuum Mechanics and Structural Analysis, School of Engineering, University of Seville,Camino de los Descubrimientos s/n, 41092 Seville, Spain3Department of Mechanics, University of Cordoba, Campus de Rabanales, 14071 Cordoba, Spain4Department of Civil, Construction, and Environmental Engineering, Iowa State University, 394 Town Engineering, Ames,IA 50011, USA2Correspondence should be addressed to Antonella D’Alessandro; antonella.dalessandro@unipg.itReceived 28 February 2017; Accepted 28 June 2017; Published 7 August 2017Academic Editor: Marcello VanaliCopyright 2017 Antonella D’Alessandro et al. This is an open access article distributed under the Creative Commons AttributionLicense, which permits unrestricted use, distribution, and reproduction in any medium, provided the original work is properlycited.The paper presents a study on the use of cement-based sensors doped with carbon nanotubes as embedded smart sensors for staticand dynamic strain monitoring of reinforced concrete (RC) elements. Such novel sensors can be used for the monitoring of civilinfrastructures. Because they are fabricated from a structural material and are easy to utilize, these sensors can be integrated intostructural elements for monitoring of different types of constructions during their service life. Despite the scientific attention thatsuch sensors have received in recent years, further research is needed to understand (i) the repeatability and accuracy of sensors’behavior over a meaningful number of sensors, (ii) testing configurations and calibration methods, and (iii) the sensors’ ability toprovide static and dynamic strain measurements when actually embedded in RC elements. To address these research needs, thispaper presents a preliminary characterization of the self-sensing capabilities and the dynamic properties of a meaningful numberof cement-based sensors and studies their application as embedded sensors in a full-scale RC beam. Results from electrical andelectromechanical tests conducted on small and full-scale specimens using different electrical measurement methods confirm thatsmart cement-based sensors show promise for both static and vibration-based structural health monitoring applications of concreteelements but that calibration of each sensor seems to be necessary.1. IntroductionStructural health monitoring (SHM) is a topic of growing scientific interest in various fields of engineering, with potentialto increase engineering systems’ safety and lead to the optimization of repair, maintenance, and restoration activities[1, 2]. Strategically designed monitoring systems can detectdamage or variations of structural behavior during the servicelife of a structure [3–5]. SHM is also useful for fast screeningof structural conditions after severe events, such as blasts andearthquakes. The choice of the monitoring sensors and oftheir proper placement is critical for accurately analyzing thestructural performance and for the measurement of damagesensitive features and their statistical investigation. A spatiallydistributed dense sensing system increases the probability offinding and characterizing a given amount of damage. Anideal solution is to transform the entire structure into a selfsensing system, analogous to the biological nervous system.Recent developments in the field of nanotechnologyhave led to cement-based sensors doped with piezoresistive
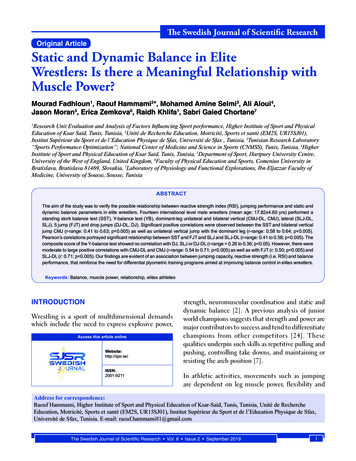
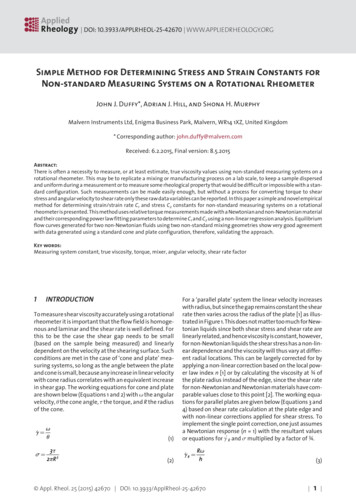
2nanofillers, which can be used as a potential solution fordistributed sensing in reinforced concrete (RC) structures[6–8]. Nanomodified cement-based sensors can be easilyfabricated and embedded in a structure at critical locations.In addition, they possess approximately the same durability asthe materials to be monitored and exhibit lower maintenancecosts with respect to traditional sensors. Promising conductive nanoinclusions for cement-based sensors are carbonbased particles [9–12]. Among them, carbon nanotubes areparticularly suitable owing to their particular aspect ratio.They consist of concentric cylindrical graphene sheets ofnanometric diameters and lengths up to some micrometers [13–15]. Their dispersion into a cementitious matrixenhances the electrical properties of the original materials,providing them with self-sensing capabilities [16–18]. Theself-monitoring ability is achieved through the correlationof strains or stresses of the material to electrical features,such as electrical resistance or impedance [19–22]. Differentelectrical effects contribute to the strain-sensing mechanism: the piezoresistivity of the conductive nanofillers, thecontact resistance of the electrodes, the intrinsic resistanceof the different materials, and the tunneling and the fieldemission effects due to the nanosize of the fillers [16, 23].Although several studies were recently devoted to investigating challenges related to the dispersion of the conductivenanoparticles in the cement matrix [24, 25], the fabricationof nanocomposites with different amounts of fillers [26, 27],and electromechanical testing [28–30], the repeatability andaccuracy of the electrical behavior upon dynamic sensing stillrequire in-depth investigations. The authors have researcheda new cement-based sensor doped with multiwalled carbonnanotubes, termed carbon nanotube cement-based sensor(CNTCS) [15, 24, 31, 32]. The CNTCSs were fabricated withdifferent types of cement matrices (pastes, mortars, andconcretes) and various amounts of carbon nanoinclusions.Building on previous work, the objective of this paperis to investigate the use of CNTCSs as smart embeddedsensors for dynamic strain monitoring of RC elements. Ameaningful number of samples are first characterized andthe application to a full-scale RC beam is studied. The restof the paper is organized as follows. Section 2 presentsmaterials and preparation procedures of the cementitioussensors with multiwalled carbon nanotubes (MWCNTs). Section 3 describes the experimental methodologies. Section 4discusses results of electromechanical tests under applicationof slowly varying cyclical loads and sinusoidal dynamic loadswith increasing frequencies. The sensitivity of the samplesand their frequency response functions are analyzed and theelectrical and electromechanical properties of the sensors areinvestigated through both two- and four-probe measurementmethods. This section also includes test results from theembedment of CNTCSs in a full-scale RC beam. Section 5concludes the paper.Shock and Vibrationof cement (Figure 1). Before solidification, four stainless steelmeshes were embedded symmetrically through the sample.The inner meshes were placed at a mutual distance of 2 cm,while the outer ones were at a distance of 4 cm. Figure 1 showsthe geometry of the samples and of the electrodes.The carbon nanotubes were type Arkema GraphistrengthC100. Their dispersion in the cementitious matrix wasachieved using a physical dispersant, preliminary mechanicalmixing, and sonication (Figures 2(i)–2(iii)). A stable watersuspension was obtained and then mixed with cement and0.5% of a plasticizer with respect to the weight of cement(Figure 2(iv)). The cement was type 42.5, pozzolanic. Thewater/cement ratio was 0.45. The smooth mixture was pouredinto oiled molds and the steel nets were embedded (Figure 2(v)). After solidification, the samples were unmoldedfor curing in laboratory conditions for the next 28 days (Figure 2(vi)). Each sample was then instrumented with two 2 cmlong electrical strain gauges, with a gauge factor of 2.1, placedonto the center of opposite lateral sides, as shown in Figure 1.3. Methodology3.1. Electrical Tests. Electrical tests were performed on the tensensors using a data acquisition system consisting of an NIPXIe-1073 chassis with dedicated modules. Both two-probeand four-probe measurement configurations in DC currentwere adopted. The chassis was equipped with two modules:the electric power was supplied through an NI PXI-4130,capable of providing a four-quadrant 20 V and 2 A outputin a single isolated channel, while electrical measurementswere conducted through a high speed digital multimeter,model NI PXI-4071. This last module acquired voltage inthe two-probe measurement setup and current in the fourprobe measurement setup. The temperature of the sensorswas controlled before and during the tests using a climaticchamber to avoid temperature-induced drifts.The electrical resistance of each sensor was evaluatedafter 6000 s of polarization in order to mitigate the signaldrift due to the dielectric nature of the cementitious matrix.In the two-probe method, the sensors were subjected to anelectrical voltage of 5 V with a current measurement rangeof 1.0 mA. The inner electrodes with a mutual distance of20 mm were used as the active electrodes. In the four-probeconfiguration, the sensors were subjected to a current levelequal to 15 mA with a voltage measurement range of 10 V. Inthis case, the current was applied to the external electrodesplaced at a mutual distance of 40 mm, while the voltage dropwas measured across the internal electrodes, as in the twoprobe method. The electrical resistance was calculated, inboth cases, based on the first Ohm’s law. Equations (1) and (2)refer to the computation of the electrical resistance for twoand four-probe configurations, respectively:2. Materials and Preparation of Samples 𝑅2𝑃 (𝑡) 𝑡 𝑡𝑝 𝑉,𝐼 (𝑡) 𝑡 𝑡𝑝Ten cube samples of 5 cm side were fabricated for the experimental campaign. The cementitious matrix was a cementpaste doped with 1% of MWCNTs with respect to the weight 𝑅4𝑃 (𝑡) 𝑡 𝑡𝑝 𝑉 (𝑡) 𝑡 𝑡𝑝𝐼(1),(2)
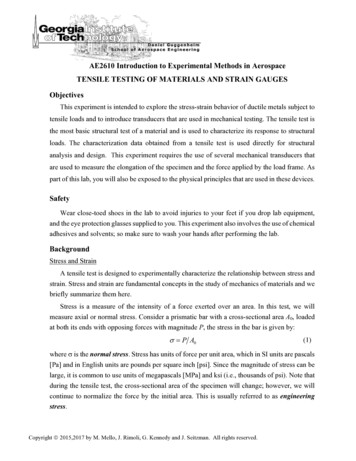
Shock and Vibration3121Electrodes1 215555Side view53D viewStrain gauges0.655ElectrodesFront view(a)(b)Figure 1: Geometry of the samples and electrodes (dimension in cm) (a); picture of the fabricated samples with strain gauges installed ontolateral surfaces (b).MWCNTsDispersantCementPlasticizerWater(i) Preparation ofnanosuspension(ii) Preliminarymixing(iii) Sonication(iv) Mixing of paste(v) Forming of sampleswith electrodes(vi) Curing ofthe samplesFigure 2: Preparation process of the cement paste samples with 1% of MWCNTs.where 𝑉 and 𝐼 are the applied constant voltage and current,𝑉(𝑡) and 𝐼(𝑡) are the measured variations of voltage andcurrent intensity over time, and 𝑡𝑝 is the polarization time.3.2. Electromechanical Tests. Axial compression tests wereconducted to assess the strain-sensing capability and repeatability of the measurements taken from the cement pastesamples. Cyclical and dynamic axial compression tests wereperformed on the ten sensors using the chassis NI PXIe1073 for data acquisition. The chassis was equipped withthree modules: the electric power generator, the multimeterused for the electrical tests, and the data acquisition systemfor the strain gauges, model PXIe-4330, 8 channels, 24bit resolution, 25 kHz maximum sampling rate, antialiasingfilters. The compression loads were applied using a servocontrolled pneumatic universal dynamic testing machine,model IPC Global UTM14P, with a controlled temperaturechamber. For the electrical tests, both two-probe and fourprobe measurement configurations were conducted at acontrolled temperature of 20 C.The cyclical loads varied from 0.5 to 2.0 kN with a 1 kN/sconstant speed, while the dynamic loads varied from 0.5 to1.5 kN with sinusoidal waveforms of increasing frequenciesfrom 0.25 to 8.0 Hz. Each sensor was subjected to polarizationfor 10 minutes, applying a voltage of 5 V, before both types ofelectromechanical tests.As for the electrical tests, in the two-probe configuration,the sensors were subjected to an electrical voltage equalto 5 V with a current measurement range equal to 1.0 mA,using internal electrodes for current measurement, whilein the four-probe configuration a current of 15 mA with avoltage measurement range of 10 V was applied to the externalelectrodes and voltage drop was measured across the internalones. The electrical measurements were carried out with asample rate of 1000 Hz. In both cases, the resistance timeseries were derived using the first Ohm’s law.Figure 3 shows the setup of the electromechanicaldynamic tests for the two-probe configuration: the powersource and the data acquisition system for the electrical measurements and the strain gauges (Figure 3(a)), an
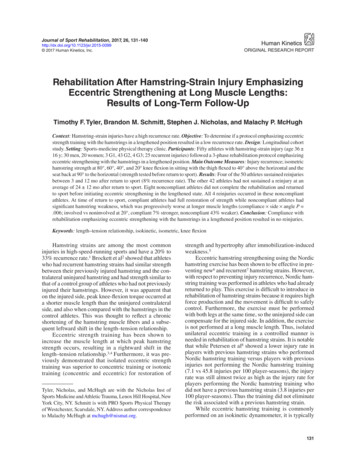
4Shock and VibrationCurrentStrain StrainsPower sourceLoadsDisplacementsStrain gauge(a)(b)Load(c)Figure 3: Sketch and pictures of the setup for the electromechanical tests on the cement-based samples with carbon nanotubes: power sourceand device for acquisition of strain gauges and electrical measurements (a); a sample during test (b); data acquisition system of the hydraulicactuator (c).instrumented sample placed in the chamber with controlledtemperature (Figure 3(b)), and the data acquisition system ofthe pneumatic testing machine, for loads and displacements(Figure 3(c)).The gauge factor 𝜆 of the cement-based sensors with carbon nanotubes was calculated using the following equation:Δ𝑅 𝜆𝜀,𝑅0(3)where Δ𝑅 is the incremental variation in electrical resistance,𝑅0 is the unstrained electrical resistance, and 𝜀 is the axialstrain (positive in compression).3.3. Full-Scale Tests. The CNTCSs used for the full-scale testswere the same as the ones used for the electromechanicaltests. The electrical outputs of the sensors and of the straingauges were acquired using the 2-probe configuration withcoaxial cables to highly reduce measurement noise [31].Sensors previously tested were embedded in a full-scalereinforced beam during its molding. The midspan samplewas instrumented for the measurements. The beam had asquare cross section of 25 25 cm2 and a length of 220 cm.It was simply supported by two steel supports installed ata distance of 200 cm. The beam was reinforced with 8 mmdiameter longitudinal steel bars and stirrups as shown inFigure 4(a). Figure 4(b) shows the reinforced beam with theembedded sensors after 28 days of curing. A detailed view ofa single cementitious sensor with carbon nanotubes is shownin Figure 4(c). Tests involving static loads and vibrations wereperformed after polarization of thirty minutes, applying adistributed static load of approximately 1 kN/m and randomhits in time and space using an instrumented hammer,respectively. During the tests, a voltage of 2.5 V was providedto the sensor, with a current measurement range equal to1.0 mA. The sampling rate was 1000 Hz.4. Results and Discussion4.1. Electrical Tests. Figure 5 reports the electrical outputof the ten cement-based sensors with carbon nanotubesobtained through the two-probe (Figure 5(a)) and the fourprobe (Figure 5(b)) methods. The resistances obtained using2-probe and 4-probe configurations had an average valueof 609 Ω and 215 Ω, respectively, with corresponding coefficients of variation of 0.16 and 0.24. The lower values ofresistance obtained through the 4-probe method are dueto the particular electrical configuration that removes theelectrical contact resistance [33]. Results demonstrate satisfactory repeatability of the electrical resistance of the sensors,particularly for the 2-probe method, whereby the obtainedcoefficient of variation is very similar to the coefficient ofvariation of other properties of concrete-like materials, suchas its compressive strength [34]. The scatter of resistance values within the considered set of nominally identical sensorsis conceivably due to the heterogeneous nature of the composites and to different degrees of uniformity of nanofillersdispersion, which cannot guarantee a perfect homogeneity.4.2. Electromechanical Tests. Electromechanical tests wereconducted applying both cyclical and dynamic compressiveloads (Figure 6) adopting both the 2-probe and the 4-probeconfigurations. Figures 7 and 8 report the time histories of theaverage strain, 𝜀(𝑡), measured by the strain gauges and of thenormalized resistance, Δ𝑅(𝑡)/𝑅0 , as obtained under cyclicaland dynamic tests, respectively, for one specific sample inthe 4-probe configuration. As shown in these figures, the
Shock and Vibration5Strain gaugesDAQMultimeterPower sourceStrains252 Φ8Sample25Current4 Φ8100100200St. 8/160St. 8/100St. 8/100(a)(b)(c)Figure 4: Sketch of the full-scale beam test setup (a); picture of the beam with the embedded sensors (b); detailed view of the sensors at themidspan (c).Two-probe configuration600Four-probe configuration300Rm 609 ΩResistance (Ω)Resistance (Ω)800400200200Rm 215 Ω100#/6 0.16#/6 0.24001234567Sensors89101112ResistanceAverage resistanceStandard deviation123456Sensors78910ResistanceAverage resistanceStandard deviation(a)(b)Figure 5: Results of the electrical measurements conducted on all of the CNCTSs (COV denotes the coefficient of variation) using two-probe(a) and four-probe (b) methods.application of compression loads induced negative changes inelectrical resistance, Δ𝑅(𝑡), in the sensors, due to an averagereduction in the distance between nanotubes. This changein resistance was fully reversible, whereby a reduction incompressive load resulted in an increase of resistance thatrecovered from the previous decrease. All the graphs showa clear strain sensitivity of the sensors and a very low valueof noise. The gauge factors of the sensors were calculatedconsidering the average resistance variation of each samplefor all the different load frequencies. Figures 9 and 10 showthe variation of GF and of the normalized change in resistancewith increasing load frequencies (0.25, 0.5, and 1 Hz and from2 to 8 Hz with steps of 2 Hz) using the 2-probe and the 4probe methods, respectively. These curves can be considered
Shock and Vibration2,02,01,51,5Load (kN)Load (kN)61,01,00,50,50,00,0051015Time (s)202530020406080100Time (s)Cyclical loadDynamic load(a)(b)0.00 100 5.00 10 5 1.00 10 4 1.50 10 4 2.00 10 4 2.50 10 4Cyclical loads3.00 10 22.00 10 21.00 10 20.00 100 1.00 10 2 2.00 10 2ΔR/R0 (—) (—)Figure 6: Applied cyclical (a) and dynamic (b) uniaxial loads for electromechanical tests.150155160165170175180Cyclical loads150155160Time (s)(a)165170Time (s)175180(b)Dynamic loads0.00 100 4.00 10 5 8.00 10 5 1.20 10 4 1.60 10 4150 160 170 180 190 200 210 220 230 240ΔR/R0 (—) (—)Figure 7: Results of electromechanical tests: measured average strain (a) and normalized variation of electrical resistance (b) on samplenumber 6 (typical) using the four-probe method under cyclical loads.Dynamic loads1.50 10 210 25.00 10 30.00 100 5.00 10 310 2150 160 170 180 190 200 210 220 230 240Time (s)Time (s)(a)(b)200160120804002-probe configurationP7P10P1P2P9P3P4P6P5P80 0.5 1 1.5 2 2.5 3 3.5 4 4.5 5 5.5 6 6.5 7 7.5 8Frequency (Hz)(a)7 7.5 8Cycle amplitudeΔR/R0 (—)Gauge factor (—)Figure 8: Results of electromechanical tests: measured average strain (a) and normalized variation of electrical resistance (b) on samplenumber 6 (typical) using the four-probe method under dynamic loads.21.61.20.80.402-probe configurationP1P7P6P5P3P4P80 0.5 1 1.5 2 2.5 3 3.5 4 4.5 5 5.5 6 6.5 7 7.5 8Frequency (Hz)P10P2 P97 7.5 8(b)Figure 9: Plots of GFs (a) and of normalized resistance variation (b) with increasing frequency of applied load using the two-probe method.
Shock and Vibration7600P8P4P1P5400200P9P2P10P3P7P600 0.5 1 1.5 2 2.5 3 3.5 4 4.5 5 5.5 6 6.5 7 7.5 8Frequency (Hz)Cycle amplitudeΔR/R0 (—)Gauge factor (—)4-probe configuration8004-probe configuration1.6P4P7P8P9P1P6P5P3P2P101.20.80.407 7.5 80 0
performed on the ten sensors using the chassis NI PXIe-1073 for data acquisition. The chassis was equipped with er tem for the strain gauges, model PXIe-4330, 8 channels, 24-bit