Transcription
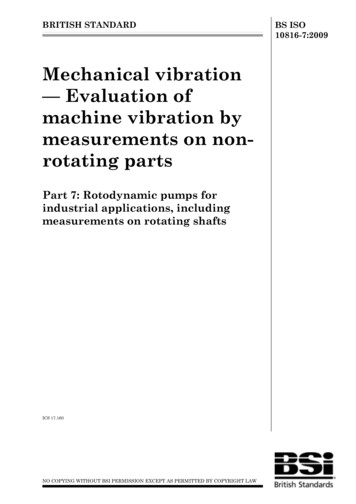
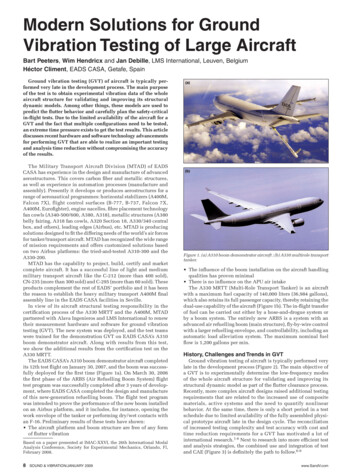
Modern Solutions for GroundVibration Testing of Large AircraftBart Peeters, Wim Hendricx and Jan Debille, LMS International, Leuven, BelgiumHéctor Climent, EADS CASA, Getafe, SpainGround vibration testing (GVT) of aircraft is typically performed very late in the development process. The main purposeof the test is to obtain experimental vibration data of the wholeaircraft structure for validating and improving its structuraldynamic models. Among other things, these models are used topredict the flutter behavior and carefully plan the safety-criticalin-flight tests. Due to the limited availability of the aircraft for aGVT and the fact that multiple configurations need to be tested,an extreme time pressure exists to get the test results. This articlediscusses recent hardware and software technology advancementsfor performing GVT that are able to realize an important testingand analysis time reduction without compromising the accuracyof the results.The Military Transport Aircraft Division (MTAD) of EADSCASA has experience in the design and manufacture of advancedaerostructures. This covers carbon fiber and metallic structures,as well as experience in automation processes (manufacture andassembly). Presently it develops or produces aerostructures for arange of aeronautical programmes: horizontal stabilizers (A400M,Falcon 7X), flight control surfaces (B-777, B-737, Falcon 7X,A400M, Eurofighter), engine nacelles, fibre placement technologyfan cowls (A340-500/600, A380, A318), metallic structures (A380belly fairing, A318 fan cowls, A320 Section 18, A330/340 centralbox, and others), leading edges (Airbus), etc. MTAD is producingsolutions designed to fit the differing needs of the world’s air forcesfor tanker/transport aircraft. MTAD has recognized the wide rangeof mission requirements and offers customized solutions basedon two Airbus platforms: the tried-and-tested A310-300 and theA330-200.MTAD has the capability to project, build, certify and marketcomplete aircraft. It has a successful line of light and mediummilitary transport aircraft like the C-212 (more than 400 sold),CN-235 (more than 300 sold) and C-295 (more than 60 sold). Theseproducts complement the rest of EADS’ portfolio and it has beenthe reason to establish the heavy military transport A400M finalassembly line in the EADS CASA facilities in Seville.In view of its aircraft structural testing responsibility in thecertification process of the A330 MRTT and the A400M, MTADpartnered with Alava Ingenieros and LMS International to renewtheir measurement hardware and software for ground vibrationtesting (GVT). The new system was deployed, and the test teamswere trained for the demonstration GVT on EADS CASA’s A310boom demonstrator aircraft. Along with results from this test,we show the additional results from the certification test on theA330 MRTT.The EADS CASA’s A310 boom demonstrator aircraft completedits 12th test flight on January 30, 2007, and the boom was successfully deployed for the first time (Figure 1a). On March 30, 2006the first phase of the ARBS (Air Refuelling Boom System) flighttest program was successfully completed after 3 years of development, where EADS CASA completed the design and manufactureof this new-generation refuelling boom. The flight test programwas intended to prove the performance of the new boom installedon an Airbus platform, and it includes, for instance, opening thework envelope of the tanker or performing dry/wet contacts withan F-16. Preliminary results of these tests have shown: The aircraft platform and boom structure are free of any formof flutter vibrationBased on a paper presented at IMAC-XXVI, the 26th International ModalAnalysis Conference, Society for Experimental Mechanics, Orlando, Fl,February 2008.8SOUND & VIBRATION/JANUARY 2009Figure 1. (a) A310 boom demonstrator aircraft ; (b) A330 multirole transporttanker. The influence of the boom installation on the aircraft handlingqualities has proven minimal There is no influence on the APU air intakeThe A330 MRTT (Multi-Role Transport Tanker) is an aircraftwith a maximum fuel capacity of 140,000 liters (36,984 gallons),which also retains its full passenger capacity, thereby retaining thedual-use capability of the aircraft (Figure 1b). The in-flight transferof fuel can be carried out either by a hose-and-drogue system orby a boom system. The entirely new ARBS is a system with anadvanced air refuelling boom (main structure), fly-by-wire controlwith a larger refuelling envelope, and controllability, including anautomatic load alleviation system. The maximum nominal fuelflow is 1,200 gallons per min.History, Challenges and Trends in GVTGround vibration testing of aircraft is typically performed verylate in the development process (Figure 2). The main objective ofa GVT is to experimentally determine the low-frequency modesof the whole aircraft structure for validating and improving itsstructural dynamic model as part of the flutter clearance process.Recently, more complex aircraft designs raised additional testingrequirements that are related to the increased use of compositematerials, active systems and the need to quantify nonlinearbehavior. At the same time, there is only a short period in a testschedule due to limited availability of the fully assembled physical prototype aircraft late in the design cycle. The reconciliationof increased testing complexity and test accuracy with cost andtime reduction requirements for a GVT has motivated a lot ofinternational research.1-6 Next to research into more efficient testand analysis strategies, the combined use and integration of testand CAE (Figure 3) is definitely the path to follow.6-9www.SandV.com
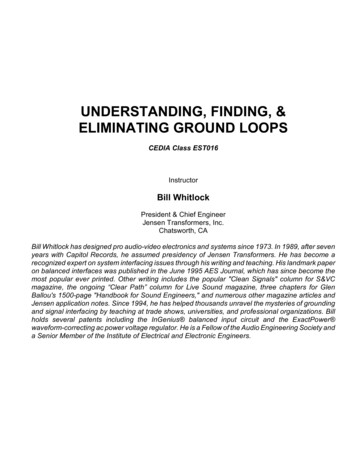
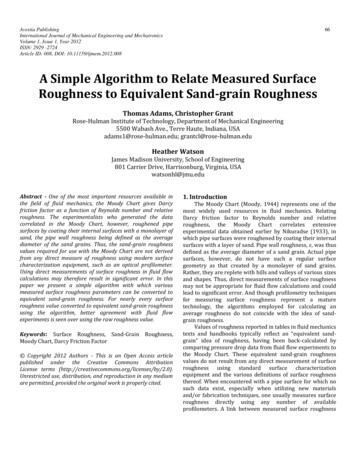
Figure 2. Aircraft development process; GVT takes place shortly before the first PhysicalPrototypeModel TestExperimentalModal ModelPre-TestPrototypeVirtualPrototypeFE ModelAnalyticalModal ModelGVT at EADS CASACorrelationModelUpdatingCalibrated VirtualPrototypeResponse AnalysisDesign ModificationsFigure 3. Integrated structural dynamics process; combination of test andCAE leads to an increased testing efficiency.For more than three decades, the use of the phase-resonancemethod, or so-called normal mode testing10-13 has been almost exclusively required for GVT on large aircraft, because this method isgenerally well suited for the separation of closely spaced modes. Innormal mode testing, essentially single sine excitation at the naturalfrequencies of the modes is used. By carefully selecting the shakerlocations and the phase relation between the sine excitation signals,the aircraft is forced to act as a single-degree-of-freedom system,and the vibration response only contains a contribution from themode of interest. Advantages of normal mode testing are: The real (normal) modes of the corresponding undamped structure are directly measured. All eigenvectors are excited at a high energy level. Linearity tests can be easily performed.The main disadvantage is that it is a very time-consuming procedure. Therefore, the phase resonance method is complemented andpartially substituted by so-called phase separation techniques thatfind the aircraft modes by evaluating frequency response functions(FRFs). The idea is that most modes are extracted from a fast-phaseseparation technique (applying modal parameter estimation methods to broadband FRFs,14 but that “critical” modes are identifiedbased on normal mode testing. According to Gloth et al.,3 modesare considered to be critical in the following cases: They significantly differ from the predictions. They show nonlinear behavior They are important for flutter calculations.While phase separation techniques have been applied onlyrecently to large aircraft, EADS CASA has been promoting thealternative approach of “random excitation” since the mid ’80s forsmall and medium-size aircraft. At that time, this new approachwas successfully applied to the CASA trainer aircraft C-101 GVT.The same approach has been applied to the Eurofighter aircraftDA6 prototype GVT in the ’90s.4A large variety of shaker excitation signals can be used to exwww.SandV.comperimentally determine the aircraft broadband FRFs, which arerequired in phase-separation testing. These excitation signalsinclude harmonic signals like discrete stepped sines, periodic signals like multi-sines or a periodic chirp (very fast swept-sine), andtransient signals like an impulse, a (burst) random, or a swept-sinesignal. They differ largely in their spectral energy content and testduration. Recently swept-sine excitation received a lot of attention, since it represents a good compromise between magnitudeof excitation level needed for large aircraft and testing time.15 Anoverview of shaker excitation techniques typically used in GVTcontext is given in Figure 4.Test Equipment. A GVT campaign typically requires the involvement of different teams from different divisions or companies. Inthis case, teams from EADS CASA, Álava Ingenieros and the engineering services division of LMS International cooperated. Herewe will review the recently installed GVT solution at EADS CASAthat avoids making compromises on the level of data managementand engineering collaboration.The excitation was provided by LDS permanent magnet shakers(Model V450), having a sine force peak using forced-air cooling of311 N and a peak-to-peak stroke of 19 mm (Figure 5a). LabworksModel PA-138 shaker amplifiers provided the power. The forcesinjected into the aircraft are measured by PCB 208C03 force gages,and the aircraft vibration response is measured by PCB 333B32 andPCB 393B04 accelerometers.The shakers were controlled and the transducer signals recordedby a 700-channel LMS data acquisition system consisting of fourSCADAS III front-end frames16 connected in master/slave modewith eight sources and 700 measurement channels (V12 modules).The LMS Scadas III is a completely digital front end, with onesigma-delta ADC per channel, 24-bit data transfer and ultra-lownoise floor. The V12 modules provide voltage, ICP and TEDSsignal conditioning. The sensor connectivity was facilitated byembedding the front ends in two racks with patch panels (Figure5b). Besides a data acquisition PC that processes and stores thedata, two analysis stations are available that perform an on-sitemodal analysis, ensuring optimal use of testing time and engineering resources.The PCs are equipped with LMS Test.Lab data acquisition andanalysis software.17 Test.Lab covers all GVT test modes in oneuser environment; MIMO random, swept sine, stepped sine andnormal modes (phase resonance) are all available. Working withthe exact setup database allows a very fast transition from one testmode to another. Furthermore, a seamless integration between testand analysis is realized by offering the analysis capabilities asadd-on functions in the acquisition workbooks, allowing almostreal-time modal parameter estimation that can be considered as anadvanced check of measurement quality and data validity duringthe measurement process.Test Conditions. The new GVT system was deployed, and the testteams were trained for the demonstration GVT on EADS CASA’sA310 boom demonstrator aircraft. During the test, the aircraft mustbe in a condition “ready for flight,” and in a configuration as closeas possible to the configuration of a test flight. The flight controlsystems (control surfaces, spoilers and air brakes) are serviceableand kept in the 0 position. The flap and slat systems are serviceable retracted and locked. The control systems of the trimmablehorizontal tail are serviceable, and the horizontal tail is kept inthe 0 position. The hydraulic systems were switched on (elevaSOUND & VIBRATION/JANUARY 20099
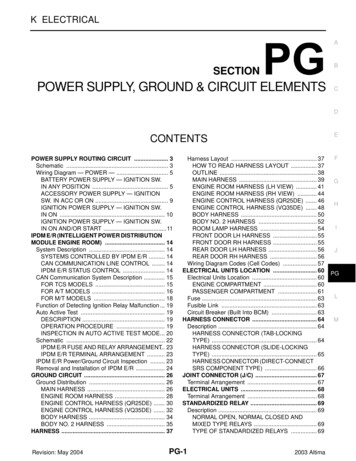
RandomSwept SineStepped SineNormal Modesfω [Hz]AP(F) [N2]AP(F) [N2]AP(F) [N2]AP(F) [N2]tω [Hz]ω [Hz]Phase Separation ofFrequency Response Funciton (FRF) Based MethodsMeasure FRFModal ParameterEstimatorExperimental ModalModel [ω, ξ, ψ]ωresonance ω [Hz]Phase Resonance /Mode AppropriationMeasure / IdentifyMode [ω, ξ, ψ]Figure 4. Dynamic excitation signals and modal parameter estimation strategies in GVT.Figure 5. (a) Engine shaker excitation; (b) 700-channel LMS data acquisition system.tor hydraulics, ailerons, rudder). The refuelling boom system wasempty and stowed, and finally, the landing gear was extended, andthe tires were flattened in an attempt to reproduce ideal free-freeboundary conditions.Phase Separation Testing with Random Excitation. The first testcarried out was a random excitation test involving six shakers atthe wings and the horizontal tail plane (Figure 6a). The test dura10SOUND & VIBRATION/JANUARY 2009tion was around 410 sec, representing 40 averages of data blocksof 10.24 sec for computing the power and cross spectra, coherences and FRFs. The random test gives a good first indication ofthe presence of the resonances. Unfortunately, this test sufferedfrom low energy input at low frequencies. This is observed in thelow force levels at the lowest frequencies (Figure 6b), and as aresult, an incorrect driving point behavior (Figure 7) and a poorreciprocity (Figure 8a) at these frequencies. A possible solution tothis problem is to add mass to the shakers so that the force levelbecomes the limiting factor of excitation rather than the stroke.The PolyMAX modal parameter estimation method18 was appliedto the random excitation FRFs. The related stabilization diagramis shown in Figure 8b. The PolyMAX method allows analyzinga large frequency band containing a high number of modes in asingle analysis run.A quality indicator for the measurements is the (multiple) coherence function that combines the effects of leakage, noise andnonlinearity on the FRFs measured at a certain degree of freedom(DOF). Due to the high channel counts typical for GVTs, browsingthrough all coherence functions is rather cumbersome. One way isto average the coherences over certain frequency ranges and plotthe average values at each sensor location in a geometry display.For instance, the coherences of close and structurally relatedlocations should not differ too much. In Figure 9a, the averagedcoherences in a very low frequency band are plotted. It is obviousthat the FRF quality at the wings is relatively good, while the fuselage and horizontal tail plane locations have lower coherences.Figure 9b shows a high-frequency band. It appears that the leftwing and especially the left engine suffer from low coherences inthis frequency band. A likely reason for this is that the left winghas only one shaker attached, while the right wing is excited bytwo (Figure 6a).Phase Separation Testing with Swept-Sine Excitation. After therandom test, MIMO swept-sine excitation19 was applied using apair of shakers attached at different locations (Figure 10). Sweptsine excitation is attractive, because it is a good compromisebetween the excitation level needed for large aircraft (possiblynonlinear and broadband excitation levels may be too far away fromoperational vibration levels) and testing time (testing is faster thanusing stepped sine).15 The FRFs obtained by sine sweep testing(Figure 11) are of higher quality than when exciting by randomnoise. Again, the PolyMAX method was used to estimate the modalparameters from the FRFs (Figure 12).It is interesting to note the so-called “system FRFs.”17 These arethe transfer functions N/V between the voltages V of the sourcesignals and the actual forces N measured by force gages betweenthe shaker stingers and the aircraft. As shown in Figure 13, thesesystem FRFs are not flat in the lower frequencies. It is also clear thata voltage sent to a certain shaker has a significant influence on thewww.SandV.com
(a)FRF WngL:135: Z / WngR:114: Z((m/s2)/N)dBFRF WngR:114: Z / WngL:135: Z Phase180–180Frequency, :114:-X–40Frequency, HzFigure 6. (a) Shaker locations during random tests; (b) power spectra ofsome input forces.Figure 8. (a) Reciprocal FRF: left wing vertical, right wing vertical; (b) PolyMAX stabilization diagram.((m/s2)/N)dB(a)FRF WngL:135: Z / WngL:135: Z Phase180-180Frequency, Hz((m/s2)/N)dB(b)FRF HTPL:211: Z / HTPL:211: Z Phase180-180Frequency, HzFigure 7. Driving point FRFs.force measured at the other shaker due to the large shaker-structureinteraction that exists in the lower frequency bands.Phase Resonance Testing. With a selection of two-shaker excitawww.SandV.comFigure 9. Averaged coherences in a geometry display: (a) very-low-frequencyband; (b) high-frequency band. Color scale corresponds to averaged coherences between 0.75 and 1.tion combinations that were used for MIMO swept-sine testing, thephase resonance (normal modes) testing capabilities of the newGVT solution were verified. The following modes were subjectedto phase resonance testing: all engine modes, horizontal tail plane(HTP) roll mode, HTP yaw mode, as well as elevator rotation andSOUND & VIBRATION/JANUARY 200911
Figure 12. PolyMAX stabilization diagram: lowest frequency band from wingvertical sine sweep tests.(b)System FRF WngL:115:-Z/Output1System FRF WngR:114:-Z/Output1System FRF WngL:115:-Z/Output5System FRF WngR:114:-Z/Output5N/V, dB(a) 180–180Frequency, HzFigure 13. System FRFs [N/V]: (a) Low-frequency band with large shakerstructure interaction; (b) High-frequency, flat “system” FRFs/low shakerstructure interaction.Figure 10. Shaker locations during vertical wing testing and longitudinalhorizontal tail plane testing.((m/s2)/N)dB(a)FRF WngL:115: Z/WngL:115: ZFRF WngR:114: Z/WngR:114: Z Phase180–180Frequency, Hz((m/s2)/N)dB(b)FRF WngL:115: Z/WngR:114: ZFRF WngR:114: Z/WngL:115: Z Phase180–180Frequency, HzFigure 11. Vertical wing swept-sine tests: (a) driving point FRFs; (b) reciprocal FRFs.twist modes. In general, the automatic tuning algorithm17 immediately detects the modes under investigation. In cases where theautomatic tuning does not converge, a manual tuning is required.12SOUND & VIBRATION/JANUARY 2009Figure 14. Mode shape visualization typically used in normal mode testing;coincident and quadrature part.17Figure 14 shows a mode shape visualization that is typically usedin normal-mode testing. The real part (or “coincident,” i.e. acceleration response in-phase with force) and the imaginary part(or “quadrature,” or phase difference of 90 between accelerationresponse and force) of the mode shape are shown respectively.When the mode is perfectly tuned, the real part should be zero.Also a nonlinearity check was performed at the mode representedin Figure 14, or the HTP first bending and wings second bending (S)mode. The tuning procedure was repeated at five different shakerforce levels. Figure 15 shows the relation between eigen frequenciesof the normal mode and force level. In case of a perfectly linearsystem, this curve should be a horizontal flat line.Mode Shapes. In this section, some mode shapes are shownand were estimated using the three described excitation methods(random, swept sine or phase resonance). Mode shapes fromboth the A310 (Figure 16-18) and the A330 MRTT (Figure 19) arerepresented. For practical reasons, the vertical tail plane was notmeasured during the demonstration GVT on the A310.Integrated Use of Finite-Element ModelsThis section discusses the integrated-use, finite-element (FE)www.SandV.com
Figure 15. Linearity check for HTP first bending, wings second bending (S)mode excited using the phase resonance method at five different force levelswith 2 vertical HTP shakers.Figure 17. A310 mode shapes: (a) HTP first bending (A), wings second bending (A - in counter phase with HTP), wings fore-aft (A), boom first lateralbending; (b) Wings third bending, HTP first vertical bending (in counterphase with wings), wings fore-aft, ruddervator bending.Figure 16. A310 mode shapes: (a) Wings first bending, engine lateral inphase with wings (S); (b) Wings first bending, engine lateral in counterphase with wings (S).models during the GVT
5b). Besides a data acquisition PC that processes and stores the data, two analysis stations are available that perform an on-site modal analysis, ensuring optimal use of testing time and engineer-ing resources. The PCs are equipped with LMS Test.Lab data acquisition and analy