Transcription
NPSANNUAL REPORT2020 Calendar YearNSHE Payroll ServicesIntroductionIn March of 2019, the Board of Regents (BOR) approved the formulation of NSHE Payroll Services (NPS) and thepolicies and procedures that govern the operation of NPS. The policies and procedures are memorialized in the BOR’sProcedures and Guidelines Manual, Chapter 5, Section 17 (Manual). This annual report is intended to provide themetrics and reporting required in the Manual for the purpose of evaluating efficiency and effectiveness.NSHE-Wide SupportCommitted to TransparencyNPS is committed to transparency, stakeholder accountabilityand data-driven decision making. During Calendar Year 2020,NPS implemented the following measures to improve efficiencyand achieve cost savings:NSHE Payroll Services is charged with provision of thefollowing services for all Nevada System of HigherEducation employees: paycheck distribution; customer service (employees and institutions); communication of all payroll and tax-relatedevents; management of individual withholding,deductions, and contributions; maintenance of all pay-related records; production of tax-related documents such asw-2s; implementation of changes to employeenames; withholding selections; direct deposit statuses; filing and depositing of institutions’ taxes; response to employment verification requests;& adherence to all state, federal, and NSHEpayroll laws and regulations A system-wide helpdesk was established to betterresolve and track issues affecting our employees;W-2 processing formerly processed by a third partyvendor was brought in-house, resulting in cost savings of 75k each biennium with 28,935 W-2s processed inCY2020;Furlough configuration was implemented with supportfrom many system-wide stakeholders as a result ofbudget reduction due to COVID-19;Payroll processing continued without disruption duringshut downs and “work from home” orders;Payroll operations is now processing integrationspreviously performed by System Computing Services(SCS) without additional cost, allowing for better errorhandling and responsiveness during integration failures;Staffing changes, reorganization, and the savings notedabove, offset by additional duties, netted total savings inof 182k or 11.3% from the previous year, with the perpayment cost being reduced from 3.05 to 2.87.NSHE PAYROLL SERVICESThe following pages in this report will highlight metrics thatdemonstrate and report to our stakeholders the activitiesundertaken during the year for the purpose of evaluatingefficiency and effectiveness. We hope you find this informationuseful in accomplishing that goal.NSHE Payroll ServicesCY2020 Year-End ReportNevada System of Higher Education104 Ross Hall Mail Stop 0122Reno, Nevada, 89557-01221 (833) 656-7882 payroll@nshe.nevada.edu
Table of Contents and FiguresIntroduction .11.Total Payments and Voided Payments .1Figure 1.1: Total Payments by Institution for 2019 and 2020 .1Figure 1.2: Voided (stopped) Payment by Institution for 2019 and 2020 .12.On-Cycle and Off-Cycle Payments . 2Figure 2.1: On Cycle Payments by Institution for 2019 and 2020 . 2Figure 2.2: Off-Cycle Payments by Institution for 2019 and 2020 .3Figure 2.3: 2020 Percent of On-Cycle to Off-Cycle Payments . 4Figure 2.4: 2019 Percent of On-Cycle to Off-Cycle Payments . 43.Retroactive Adjustments .5Figure 3.1: Retroactive Payroll Adjustments for 2019 and 2020 .5Figure 3.2: 2020 Percent of All Payments to Retroactive Payroll Adjustments . 6Figure 3.3: 2019 Percent of All Payments to Retroactive Payroll Adjustments . 6Figure 3.4: Number of Retroactive Adjustments by Type for 2019 and 2020 . 7Figure 3.5: 2019 and 2020 Breakdown of Retroactive Payments by Reason and Institution . 84.Payroll Time Submissions . 9Figure 4.1: Standard Time Submissions by Institution for 2019 and 2020 . 9Figure 4.2: En Masse Time Submissions by Institution for 2019 and 2020 . 9Figure 4.3: 2020 Percent of standard to en masse time submission. . 10Figure 4.4: 2019 Percent of standard to en masse time submission. . 105.NSHE Payroll Help Desk Data . 11Figure 5.1: Breakdown of NSHE Payroll Tickets . 11Figure 5.2: Total Tickets by Institution in 2020 . 11Figure 5.3: Total Monthly Tickets by Institution in 2020. 11Figure 5.4: Total Monthly Tickets in 2020 . 12Figure 5.5: Total Tickets by Employee Type in 2020 . 126.Cost of Payroll . 13Figure 6.1: Breakdown of Payroll expenses, including number of payments and average payroll cost per payment . 13Figure 6.2: Breakdown of NSHE Payroll Budget Fiscal Year 2021 . 13NSHE Payroll ServicesCY2020 Year-End Report
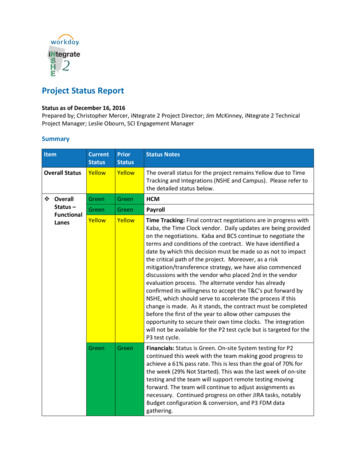
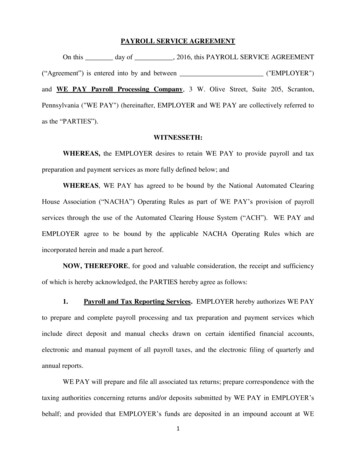
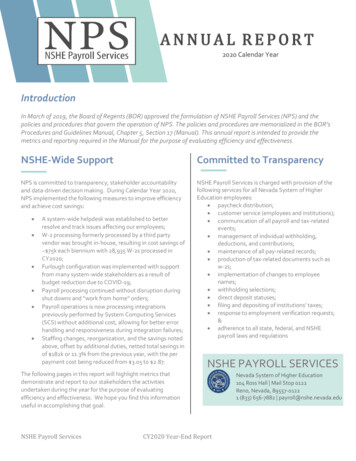
1. Total Payments and Voided PaymentsFigure 1.1: Total Payments by Institution for 2019 and 2020in 1,000s25021620420017015915010059 58500-IICSN--- -- -9 911 1014 15DRIGBC 201931 263 3I NSCNSHETMCCTotal Payments -14 13UNLVUNRWNC2020 Total PaymentsFigure 1.1: Total Payments by Institution for 2019 and 2020Figure 1.2: Voided (Stopped) Payments by Institution20018017215093100755040I.160CSN-6 2DRI246 5123-GBC-- NSC- 2019Stopped Payments173 0I NSHETMCC 12 9UNLVUNR WNC2020 Stopped PaymentsFigure 1.2: Voided (stopped) Payment by Institution for 2019 and 2020NSHE Payroll ServicesCY2020 Year-End Report1
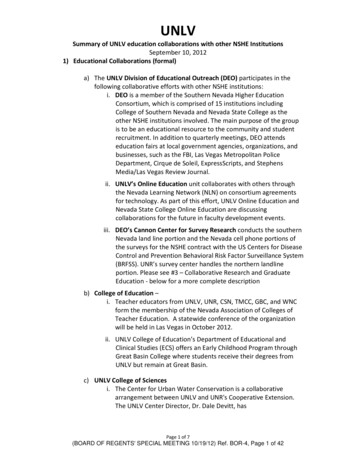
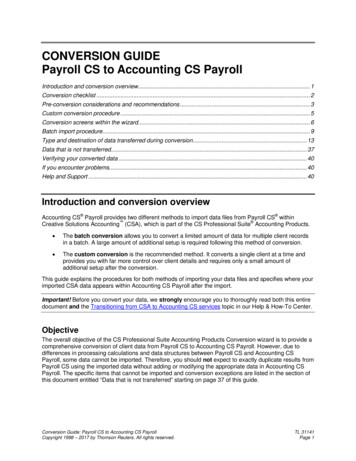
2. On-Cycle and Off-Cycle PaymentsOn-cycle is defined as payments that were completed as part of a scheduled payroll cycle. In all, 497,680payments were completed in 2020, 527,170 were completed in 2019. In 2020 and 2019, off-cycle paymentswere 2,474 and 4,126, respectively. Off-cycle payments to total payments declined from .8% to .5% from 2019to 2020.Figure 2.1: On Cycle Payments by Institution for 2019 and 2020in 1,000s25021420320016915915010059 58500IICSN--- --- -9 911 1014 15DRIGBCNSC 2019On-Cycle31 263 3I NSHETMCC -14 13UNLVUNRWNC2020 On-CycleFigure 2.1: On Cycle Payments by Institution for 2019 and 2020NSHE Payroll ServicesCY2020 Year-End Report2
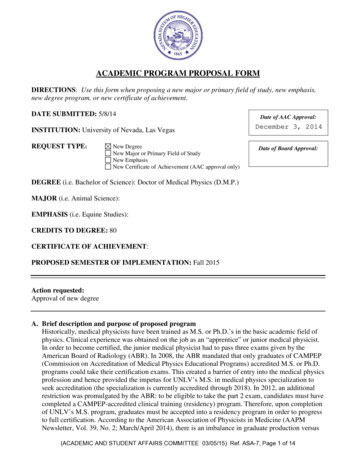
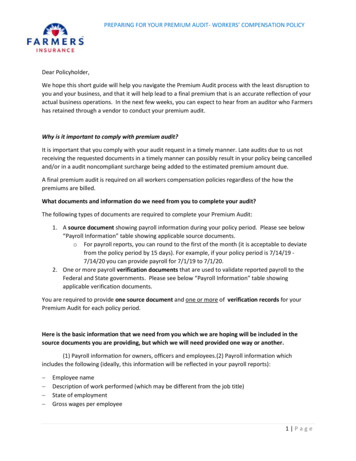
Off-cycle payments were made between pay periods, typically due to work time not being entered beforepayroll or other retroactive but critical adjustments.Figure 2.2: Off-Cycle Payments by Institution for 2019 and20202,5002,1002,0001,5001,236 1,2031,000500-703350242I --- -- --CSN59 4180 2194 4828 17DRIGBCNSCNSHE 2019 Off-Cycle 2020148 117 -TMCCI -64 49UNLVUNRWNCOff-CycleFigure 2.2: Off-Cycle Payments by Institution for 2019 and 2020NSHE Payroll ServicesCY2020 Year-End Report3
Percent of On-Cycle to Off-Cycle Payments shows what percentage of each institution’s respective paymentswere on and off-cycle. Off-cycle payments are a result of changes to earnings or deductions that completeoutside of regular payroll payment process. Reasons for these adjustments to net pay are defined after Figure3.4. Off-cycle payments for all campuses declined when compared to on-cycle between 2019 and 2020.Figure 2.3: 2020 Percent of On-Cycle to Off-Cycle Payments100.0%99.5%- -- --- ---. - . - 8.5%98.0%GBCNSC On-CycleNSHETMCCUNLV Off-CycleFigure 2.3: 2020 Percent of On-Cycle to Off-Cycle PaymentsFigure 2.4: 2019 Percent of On-Cycle to 5%99.5%99.0%99.0%99.3% 0.5%99.5%98.0%CSN 2019 On-CycleNSHE 2019TMCCUNLVUNRWNCOff-CycleFigure 2.4: 2019 Percent of On-Cycle to Off-Cycle PaymentsNSHE Payroll ServicesCY2020 Year-End Report4
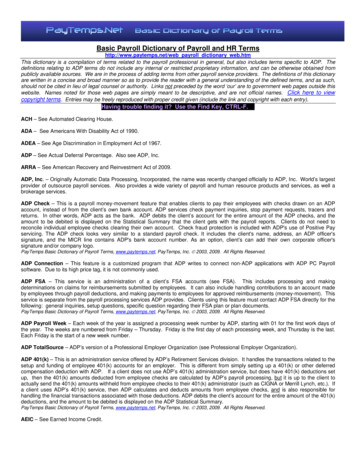
3. Retroactive AdjustmentsRetroactive payroll adjustments are defined as adjustments made relating to prior payroll periods that requiredadjustments to current payments, additional payments to be processed, payments voided; and/or repaymentof funds from employees.Figure 3.1: Retroactive Payroll Adjustments by Institution for2019 and ,0002,0001,000-1,4831,30811 -·560275CSNDRI150118.LGBC309307.J.NSC 2019142121.J.NSHE ·*630449TMCC---279247UNLVUNRWNC2020Figure 3.1: Retroactive Payroll Adjustments for 2019 and 2020NSHE Payroll ServicesCY2020 Year-End Report5
Retroactive payroll adjustments when compared to all payments increased as a percentage between 2019 and2020 for all campuses from 2.4% to 3.2%.Figure 3.2: 2020 Percent of All Payments to RetroactivePayroll Adjustments100.00%99.00%98.00%- %96.82%95.93%94.00%94.07%93.00%CSNDRI GBCNSC2020 Total PaymentsNSHE 2020TMCCUNLVUNRWNCRetroactive AdjustmentsFigure 3.2: 2020 Percent of All Payments to Retroactive Payroll AdjustmentsFigure 3.2: 2019 Percent of All Payments to Retroactive .10%95.37%94.00%93.00%CSNDRI GBCNSC2019 Total PaymentsNSHE TMCCUNLV2019 Retroactive AdjustmentsFigure 3.3: 2019 Percent of All Payments to Retroactive Payroll AdjustmentsNSHE Payroll ServicesCY2020 Year-End Report6
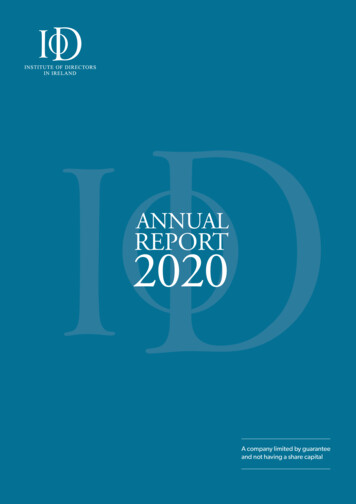
Figure 3.4: Number of Retroactive Adjustments by Type for2019 and 20204,585Time Off5,7112,6492,483Time Block192Retro Termination610Retro Hire179195Rescind Event160171-Payroll InputLeave of AbsenceCompensation ChangeBenefit Change--8441,078292314202134Add Additional Job-2,2922,183t 1,0281,0001,7592,000 20193,000 4,0005,0006,0002020Figure 3.4: Number of Retroactive Adjustments by Type for 2019 and 2020Add Additional Job: HR business process for additional job changes in Workday that are notcompleted timely for payroll completion.Benefit Change: HR business process for benefit changes in Workday that are not completed timely for payrollcompletion.Compensation Change: HR business process for compensation changes in Workday that are notcompleted timely for payroll completion.Leave of Absence: Leave corrections such as FMLA or Sabbatical.Payroll Input: A variety of corrections handled directly by the Payroll office, not initiated by a businessprocess. These entries correct earnings and deductions, primarily related to benefit changes.Rescind Event: Events that have been recalled in Workday that are not completed timely for payroll completion.Retro Hire: Hire events that are entered into Workday after a period for which the worker is to have been paid.Retro Termination: Termination events that are entered into Workday after a period for which the worker is tohave been paid.Time Block: Hourly time entry corrections.Time Off: Annual and sick time corrections.NSHE Payroll ServicesCY2020 Year-End Report7
2019 and 2020 Breakdown of Retroactive Payments by Reason angeCompChangeLeave mTimeBlockTime OffCSN 2020201334363165172355148555CSN 2019212062613774152023195456DRI 202013580141513060351DRI 201923968382005697GBC 20200128270003257GBC 201912915160005246NSC 20202315651440552138NSC 20196685271480039115NSHE 2020051359100979NSHE 201902015511000487TMCC 2020133841927111544405TMCC 2019539642831301280185UNLV 202064540888986679014235113492503UNLV 201911888010931024801071329913032131UNR 20204122658813425754261747151534UNR 201939454669991872024588661381WNC 20205133061730107489WNC 20198245510335305487Figure 3.5: 2019 and 2020 Breakdown of Retroactive Payments by Reason and InstitutionNSHE Payroll ServicesCY2020 Year-End Report8
4. Payroll Time SubmissionsStandard time submissions are time entered by the employee and submitted to payroll by the employee’ssupervisor. Standard time submission decreased from 126,793 in 2019 to 105,415 in 2020 or 16.9% decrease.Figure 4.1: Standard Time Submissions by Institution for2019 and 11 - - 1CSNDRIGBC431376 -NSC 2019NSHE 8,2536,493I TMCC4,7393,650UNLVUNRWNC2020Figure 4.1: Standard Time Submissions by Institution for 2019 and 2020En Masse time submissions are time entered by the employee and submitted to payroll by NSHE PayrollServices because supervisors did not approve or deny time prior to the payroll deadline. En masse timesubmissions in 2019 and 2020 were 16,928 and 9,906, respectively, a decrease of 41.5%.Figure 4.2: En Masse Time Submissions by Institution for2019 and CSN12688177130419428- --- .LDRIGBCNSC.1. - 201974 54954294NSHETMCC -3,893I ·589248UNLVUNRWNC2020Figure 4.2: En Masse Time Submissions by Institution for 2019 and 2020NSHE Payroll ServicesCY2020 Year-End Report9
En Masse time submissions as a percent of total decreased for most all campuses.Figure 4.3: 2020 Percent of Standard to En Masse TimeSubmissions by %95.7%92.2%93.6%87.4%80.0%CSNDRI GBCNSCStandard Time SubmissionsNSHETMCCWNC En Masse Time SubmissionsFigure 4.3: 2020 Percent of standard to en masse time submission.Figure 4.4: 2019 Percent of Standard to En Masse TimeSubmissions by .2%92.7%94.2%91.8%89.6%85.3%80.0%75.0%CSNDRIGBCNSC Standard Time SubmissionsNSHE TMCCEn Masse Time SubmissionsFigure 4.4: 2019 Percent of standard to en masse time submission.NSHE Payroll ServicesCY2020 Year-End Report10
5. NSHE Payroll Help Desk Data2020620Total Help Desk Tickets3 daysAverage Ticket ResolutionFigure 5.1: Breakdown of NSHE Payroll TicketsFigure 5.2: Total Tickets by Institution in 07NSHE101TMCCUNLVUNRWNCFigure 5.2: Total Tickets by Institution in 2020Figure 5.3: Total Monthly Tickets by Institution in 2020604950404031302010036353227353232261818124 21 1JanFeb. .I1312711.I-· .I --· .I124112March April CSN DRI GBC13AugSeptMayJuneJuly NSHE TMCC NSC.I1333I.1 UNLV23.1 UNR23L J113311242111Oct1Nov81Dec WNCFigure 5.3: Total Monthly Tickets by Institution in 2020NSHE Payroll ServicesCY2020 Year-End Report11
Figure 5.4: Total Monthly Tickets in eb35MarAprMayJunJulAugSepOct32IINovDecFigure 5.4: Total Monthly Tickets in 2020Figure 5.5: Total Tickets by Employee Type in 2020TechnologistResident PhysicianPostdoctoral ScholarLetter of AppointmentHourlyGraduate AssistantClassifiedAdministrative FacultyAcademic FacultyII2I 71109993100120140160180# of TicketsFigure 5.5: Total Tickets by Employee Type in 2020NSHE Payroll ServicesCY2020 Year-End Report12
6. Cost of PayrollTotal Payroll ExpenseTotal Payroll Budget 998,178,028.41 1,427,544.00 0.14% of Total Payroll ExpensesNumber of Payments 497,680Average Payroll CostPer Payment 2.87Figure 6.1: Breakdown of Payroll expenses, including number of payments and average payroll cost per paymentFTEAmountPayroll Processing10.00 860,454.00Payroll Customer Service5.40 352,084.00Payroll Banking.25 37,062.00Payroll Accounting1.35 177,944.00Total17.00 1,427,544,.00Figure 6.2: Breakdown of NSHE Payroll Budget Fiscal Year 2021NSHE Payroll ServicesCY2020 Year-End Report13
CSN DRI GBC NSC NSHE TMCC UNLV UNR WNC 2019 Total Payments 2020 Total Payments 59 9 11 14 3 31 170 14 58 9 10 15 3 26 204 159 13 0 50 100 150 200 1. Total Payments and Voided Payments . A variety of corrections handled directly by the Payroll office, not initiated by a business process. The