Transcription
Investor PresentationMarch 2021
DisclaimerThis presentation contains forward-looking statements about Palomar Holdings,Inc. (the “Company”). These statements involve known and unknown risks thatrelate to the Company’s future events or future financial performance and theactual results could differ materially from those discussed in this presentation.This presentation also includes financial measures which are not prepared inaccordance with generally accepted accounting principles (“GAAP”). For adescription of these non-GAAP financial measures and reconciliations of thesenon-GAAP financial measures to the most directly comparable financialmeasures prepared in accordance with GAAP, please see the appendix to thispresent.Forward-looking statements generally relate to future events or the Company’sfuture financial or operating performance. In some cases, you can identifyforward-looking statements because they contain words such as ‘‘may’’, ‘‘will’’,‘‘should’’, ‘‘expects’’, ‘‘plans’’, ‘‘anticipates’’, ‘‘could’’, ‘‘intends’’, ‘‘target’’,‘‘projects’’, ‘‘contemplates’’, ‘‘believes’’, ‘‘estimates’’, ‘‘predicts’’, ‘‘would’’,‘‘potential’’ or ‘‘continue’’ or the negative of these words or other similar terms orexpressions that concern the Company’s expectations, strategy, plans orintentions. These forward-looking statements include, among others, statementsrelating to our future financial performance, our business prospects and strategy,anticipated financial position, liquidity and capital needs and other similarmatters. These forward-looking statements are based on management’s current2expectations and assumptions about future events, which are inherently subjectto uncertainties, risks and changes in circumstances that are difficult to predict.Such risks and uncertainties include, among others, future results of operations;financial position; the impact of the ongoing and global COVID-19 pandemic;general economic, political and other risks, including currency and stock marketfluctuations and uncertain economic environment; the volatility of the tradingprice of our common stock; and our expectations about market trends.The Company may not actually achieve the plans, intentions or expectationsdisclosed in its forward-looking statements, and you should not place unduereliance on the Company’s forward-looking statements. Actual results or eventscould differ materially from the plans, intentions and expectations disclosed inthe forward-looking statements the Company makes. While the Company mayelect to update these forward-looking statements at some point in the future, theCompany has no current intention of doing so except to the extent required byapplicable law. You should, therefore, not rely on these forward-lookingstatements as representing the Company’s views as of any date subsequent tothe date of this presentation. Additional risks and uncertainties relating to theCompany and its business can be found in the "Risk Factors" section of PalomarHoldings, Inc.’s most recent Annual Report on Form 10-K, Quarterly Report onForm 10-Q, and other filings with the United States Securities and ExchangeCommission.
Company OverviewTRACK RECORD OF DELIVERING STRONG GROWTH AND CONTINUED PROFITABILITYSpecialty insurer focused onaddressing underserved, mispriced marketsNASDAQ: PLMR Q4/YE 2020 HIGHLIGHTS 2020 GWP of 354.4 million, up 41% versus 2019Products serving residential and commercial clients includeearthquake, wind and flood insuranceSophisticated risk transfer strategy limits exposure tomajor events and reduces earnings volatility Q4 GWP of 96.1 million, up 31% versus Q4 of 2019 2020 GWP of 29.5 million via PESIC 2020 adjusted net income(1) of 8.9 million 2020 adjusted combined ratio excluding catastrophe losses (1) of 67.5% 2020 adjusted ROE (1) of 3.0% (includes cat losses)Analytically driven underwriting and flexible products 2020 premium retention above 87% overall across all product lines Q4 average rate increase of 16% on commercial renewalsA.M. Best “A- (Excellent)” FSC group rating, nationwide scope throughPalomar Excess and Surplus Insurance Company (“PESIC”) andadmitted insurer in 32 states Published inaugural Sustainability & Citizenship Report(1)-This is a non-GAAP metric. See non-GAAP reconciliation on pages 22, 23, and 24Committed to environmental, social, governance, diversityand inclusion initiatives3
Recent ITIATIVESRISK TRANSFER4 Q4 GWP of 96.1 million, up 31% versus Q4 of 2019 Launched four new products via PESIC and an admitted Real Estate E&O offering Updated 2021 adjusted net income guidance: 62 to 67 million Exited admitted Commercial All Risk and Louisiana Specialty Homeowners Actions taken would have reduced 2020 wind season gross losses by 70% Transitioned focus to E&S in select markets with strengthened underwriting guidelines Off-coast, reduced limits Targeting layered and shared business Newly launched PESIC grew 128% sequentially during Q4 Entered several new partnerships via PSIC & PESIC: Residential Earthquake (Travelers), ResidentialFlood, Builder’s Risk, and Excess Liability Acquired the renewal rights to Geovera’s book of Hawaiian Residential Hurricane business Commercial and residential quota shares will protect against material losses from Winter Storm Uri Secured 25 million of aggregate XOL limit for all perils, effective 4/1 Torrey Pines Re Cat Bond currently in the market; seeking to place 300M of limit, earthquake only
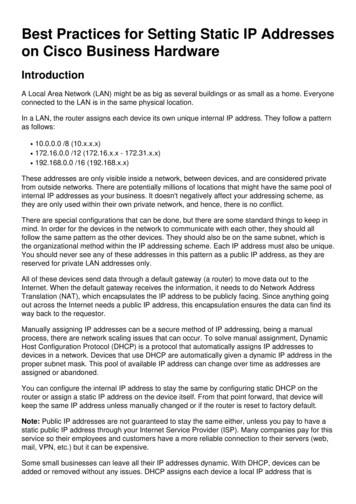
Palomar Excess and Surplus Insurance CompanyPalomar Geographic FootprintPESIC HIGHLIGHTSMEWA Launched in June 2020, began writing businessduring Q3MNOR Received A- (Excellent) FSC IX by A.M. Best inJuly 2020NHMAIDNYWISDMIIANENVILINCT RINJPAWY 2020 GWP of 29.5 million; 128% sequentialgrowth in Q4MDOHWVVAUTCACOKYMOKSNCTN Achievement of national recognition by surpluslines associations Primary lines of business: CommercialEarthquake, Commercial All Risk and InlandMarineVTNDMTAZOKNMSCARMSAKTXALGALAFLHI New lines of business announced in 2021:Builder’s Risk and Excess Liability Actively writing in-house business as well asthrough select program administrators Continued robust program pipeline5PESIC OnlyPSIC OnlyPESIC & PSICPending ApprovalDE
Investment Highlights6
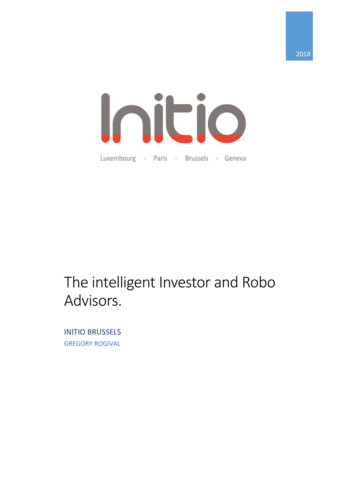
Analytically Driven UnderwritingUNDERWRITING STRATEGYCASE STUDY: WA PRICING MODEL PLMR vs LEADING COMPETITOR “Write what we know” Avoid exposures that are overly complexPalomar Broad appetite to underwrite specialty riskswithin both admitted and surplus linesmarkets Proprietary granular data modeling drivesanalytical pricingOver23,000PricingPointsLowerRate Adherence to strict underwriting guidelines Fee income generated by underwriting onthe behalf of other insurance companies7Leading Competitor Ability to adapt quickly to market conditionsOnly 3PricingZonesHigherRate
Scalable Proprietary Operating PlatformOPERATING WITHOUT THE BURDEN OF LEGACY IT SYSTEMSModern technology platform driving competitive advantage Integration between pricing models, policy administrationand analytics Technology systems built for automation and efficiency Better service to policyholders and producersScalable platform reduces operating costs & improves efficiency API development for partners with Palomar Automated Submission System (PASS) Real-time data & event reporting Enterprise-grade stability 8Seamless communication with partner carriers and reinsurersAbility to rapidly quote and bind policies
Adaptive Specialty ProductsResidential Earthquake40%Commercial EarthquakeHawaii HurricaneCommercial All RiskSpecialty HomeownersInland MarineResidential Flood2020GWP: 354M4%2%4%4%14%Other917%15%
Multiple Dimensions of GrowthEXPANSION SINCE INCEPTION (ANNUAL GWP IN M) 29.5MPSIC GWPPESIC GWP 354M 252M 155M 120M 17M2014 55M 82M201520162017201820192020DIVERSIFICATION OF BUSINESS MIX (QUARTERLY GWP IN M) 103 105 84 90 75 66 54 60 45 96 37 40 44 33Q1 18Q2 18Q3 18Q4 18 73 72Q4 19Q1 20 58 30 15 0Residential EarthquakeInland Marine10Q1 19Commercial EarthquakeHawaii HurricaneQ2 19Q3 19Commercial All RiskResidential FloodSpecialty HomeownersOtherQ2 20Q3 20Q4 20
Continued Opportunity within Commercial MarketsABILITY TO CAPITALIZE ON AN ATTRACTIVE COMMERCIAL RATE ENVIROMENT AND RETAIN POLICYHOLDERS(1)Commercial Product Rate Increase2020 Average Monthly Premium Retention by Product18%120%87% Retention Across All %87%12.1%60%12%10.8%40%10%20%8%0%6%Q4 2019Q1 2020Q2 2020Q3 2020Q4 rcial AllSpecialtyRisk t hard market has allowed Palomar to launch three new commercial products since Q4111.2.Includes Commercial Earthquake and Commercial All Risk product rate increasesExited admitted Commercial All Risk in during Q4 2020
Expanding Our Distribution NetworkMULTIPLE SOURCES OF GROWTH AND THE FLEXIBILITY TO RAPIDLY CAPITALIZE ON CHANGING MARKET ISTRATORSCARRIERPARTNERSHIPS Primarily distributepersonal lines products Primarily distributecommercial lines products Distribute admitted andsurplus lines offerings Over twenty insurancecompany partners High retention rates andrate stability Flexible products that areeasier for agents to sellHarness the efficiencyand scale of existingmarketing and distributioninfrastructures Control most of thepremium withincommercial propertyinsuranceCompanion offers forresidential or commercialinsurance products Much higher averagepremium than retailbusiness Direct appointments withcaptive agents Up to 100% reinsurancefor existing and new risks Strong cross-sellingopportunitiesGranted direct access toPASS, our agency portal Products ultimately solddirectly by retailers andwholesalersDistribution enhancedthrough scale and PESICUnique distribution model, which leverages scalability and access to different markets12
Leveraging Strategic PartnershipsBUILDING SCALE WITHIN NEW AND EXISTING MARKETS 20 strategic partnerships Existing relationships validate the qualityof our products, service offerings andsystems Highly scalable distribution model Ability to quickly grow within new andexisting markets Recent partnerships include residentialearthquake partnership with Travelers inQ1 ‘21 and flood partnership with Torrent(Marsh) in Q4 ‘2013
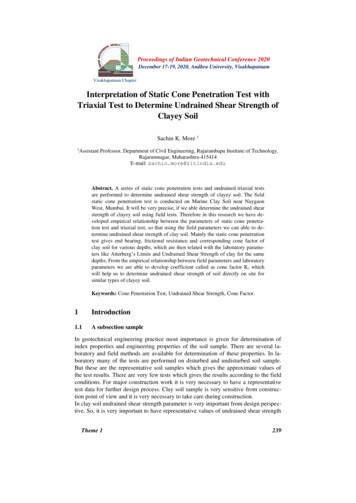
Enhanced Risk Transfer ProgramCURRENT REINSURANCE PROGRAM(1) 1.4B Total coverage up to 1.4 billion for earthquake events and 600 million for wind eventsEarthquake Only 10 million event retention in place through June 1, 2021;represents less than 3% of surplus1906 San Francisco EQ( 1.02B) 1 million vertical co-participation in selected layers of theprogram1994 Northridge EQ ( 852M) Reinstatement provisions facilitate cover for multiple events 600M 25 million of aggregate excess of loss reinsurance limitplaced effective 4/1/2021; covers all perilsEarthquake Wind Highly diversified and robust reinsurance panel with over 90highly rated reinsurers Utilize quota share reinsurance to further mitigate the impactof losses on underwriting results1992 Hurricane Iniki( 250M) 10MRetention141.2.Historical scenarios are modeled using the in-force portfolio as of December 31, 2020Cat XOL Tower as of 12/31/20
Entrepreneurial and Experienced Management TeamDECADES OF INSURANCE, REINSURANCE, AND CAPITAL MARKETS EXPERTISEMANAGEMENT OVERVIEWNAMEEXPERIENCE (YRS)PRIOR PROFESSIONAL EXPERIENCEMac Armstrong CEO & Founder20 Arrowhead General Insurance Agency Spectrum Equity Alex. Brown & SonsHeath Fisher President & Co-Founder20 Guy Carpenter John B. Collins Associates E.W. Blanch CompanyJon Christianson Chief Underwriting Officer15 Holborn Corporation John B. Collins Associates Guy CarpenterElizabeth Seitz Chief Accounting Officer25 Personable General Insurance Agency Arrowhead General Insurance Agency PwCChris Uchida Chief Financial Officer20 Arrowhead General Insurance Agency PwCBritt Morries Chief Operating Officer25 Wellbeats John B. Collins Associates AonJonathan Knutzen Chief Risk Officer20 TigerRisk Partners Holborn Corporation Guy CarpenterMichelle Johnson Chief Talent & Diversity Officer20 Option One Mortgage AMN Healthcare Panasonic Avionics CorporationBill Bold Chief Strategy Officer30 U.C. San Diego School of Global Policy & Strategy QualcommAngela Grant Chief Legal Officer30 CSE Insurance Group Hippo GEICO15
ESG StatementCLICK TO VIEWPALOMAR FORMALLY ANNOUNCED ITS COMMITMENT TO ESG MATTERS IN DECEMBER 2020ENVIRONMENTAL Employees encouraged to work fromhome, reducing carbon footprint Eliminated the use of disposable plasticwater bottles in favor of filtered waterdispensers in HQ 16Addition of dual computer monitors toeliminate the need for printingSOCIAL RESPONSIBILITY Inclusive workplace welcoming all people,regardless of race, ethnicity, sexualorientation, or gender identification40% of our team and 50% of our board ofdirectors are women or members ofunderrepresented communities Creation of DICE (Diversity, Inclusion,Community Engagement and Equality)Council Allocating assets to Minority DepositoryInstitutionGOVERNANCE Established ESG Committee of the boardof directors in October 2020 83% of our board members areindependent of management The board of directors has adoptedCorporate Governance guidelines that arefocused on good governance practicesand procedures
Financial Highlights17
Proven Business ModelGROWTHPROFITABILITYSHAREHOLDER RETURNSGross Written Premium ( M)Adjusted Combined Ratio (1)Adjusted Return on Equity (1)100% 35493%86%18%24%12%10% 25223%32%70%7%2%63%7%6% 155 12010%68%71%61% 8257%61%5%201620172018201920202016Expenses181.This is a non-GAAP metric. See GAAP reconciliation on pages 22, 23 and 24201720182019Attritional Losses2020Cat Losses201620173%201820192020
Full Year 2021 GuidanceFULL YEAR 2021 CURRENT OUTLOOKAdjusted net income(1) Updated 2021 Outlook on February 24, 2021 within fourth quarter 2020 earnings release Adjusted net income guidance considers the impact of Winter Storm Uri in Texas Aggregate cover will establish a floor of approximately: 10% for adjusted return on equity 80% for adjusted combined ratio 39 million for adjusted net income191.2. 62 to 67 millionThis is a non-GAAP metric. See GAAP reconciliation on pages 22, 23 and 24
Appendix20
Year Ended December 31,In Thousands2020Gross written premiums 354,360 251,961Ceded written 2073,2952,671Net written premiumsFinancial HighlightsQ4 2020 PERFORMANCENet earned premiumsCommission and other income(1)Total underwriting revenues158,363102,878Losses and loss adjustment expenses64,1155,593Acquisition expenses64,04137,259Other underwriting expenses34,07451,299(3,877)8,727Underwriting income (loss) (1) Top-line growth continues to be driven by new products,accelerating rate increases in commercial business,expansion of E&S footprint, and extension of distributionnetwork GWP of 96.1 million, up 31% versus 2019ion up 41%versus 20 Average monthly premium retention above 84% overallacross all product lines 382% growth in Inland Marine 46% growth in Specialty Homeowners 42% growth in Residential Flood 30% growth in Hawaii HurricaneInterest expense-(1,068)Net investment income8,6125,975Net realized and unrealized gains on investments1,4884,4436,22318,077Income before income taxesIncome tax expense(34)7,456Net income (loss) 6,257 10,6217083,0072,16724,103Expenses associated with retirement of debt-1,297Expenses associated with catastrophe bond399-Expenses associated with IPO, tax restructuring, secondary offerings, and onetime cash incentive bonusesStock-based compensation expenseTax ImpactAdjusted net income (1)2.1%6.7%Adjusted return on equity (1)3.0%24.1%Loss ratio41.3%5.6%Expense ratio61.2%85.7%Combined ratio102.5%91.3%Adjusted combined ratio(1)100.4%63.3% 0.24 0.49 0.35 1.7350,986-Diluted adjusted earnings perCatastrophe lossshare(1)ratio(1)Adjusted combined ratio excluding catastrophe losses(1)This is a non-GAAP metric. See GAAP reconciliation on pages 22, 23 and 24Catastrophe losses above are shown before their tax impact.(1,149) 37,879Return on equityCatastrophe losses(2)1.2.(664) 8,867Key Financial and Operating MetricsDiluted earnings per share21201932.9%-67.5%63.3%
Reconciliation Of Non-GAAP Metrics Used In ThisPresentationIn ThousandsThree Months Ended December 31,2020Year Ended December 31,201920202019Gross earned premiums 86,191 58,967 301,457 200,521Ceded earned premiums(47,269)(27,979)(146,389)(100,314)Net earned premiums38,92230,988155,068100,207Net earned premium ratio45.2%52.6%51.4%50.0% 42,295 34,623168,463 488)(4,443)Underwriting Revenue 39,725 31,642 158,363 102,878Income (loss) before income taxes( 2,406) 14,415 6,223 88)(4,443)Total revenueNet Investment incomeNet realized and unrealized gains on investmentsNet investment incomeNet realized and unrealized gains on investmentsInterest expense---1,068Underwriting Income( 4,976) 11,434( 3,877) 8,727Net income (loss)( 1,849) 10,880 6,257 10,621-3077083,007Adjustments:Expenses associated with IPO, tax restructuring, secondary offerings and one-time incentive cashbonusesStock-based compensation expense7104262,16724,103Expenses associated with retirement of debt---1,297Expenses associated with catastrophe bond--399-(130)(155)(664)(1,149)( 1,269) 11,458 8,867 37,879Less: Tax impactAdjusted net incomeAnnualized adjusted net income (loss)Average stockholders’ equityAnnualized adjusted return on equity22( 5,076) 45,832 8,867 37,879 362,804 213,509 291,135 157,424(1.4%)21.5%3.0%24.1%
Reconciliation Of Non-GAAP Metrics Used In ThisPresentationIn ThousandsThree Months Ended December 31,Year Ended December 31,2020201920202019Numerator: Sum of Losses & LAE, acquisition expenses, and other underwriting expenses,net of commission and other income 43,898 19,554 158,945 91,480Denominator: Net earned premiums 38,922 30,988 155,068 100,207Combined Ratio112.8%63.1%102.5%91.3%-( 307)( 708)( 3,007)(710)(426)(2,167)(24,103)---(897)Adjustments to numerator:Expenses associated with IPO, tax restructuring, secondary offerings, and one-timeincentive cash bonusesStock-based compensation expensePortion of expenses associated with retirement of debt classified as other underwritingexpensesExpenses associated with catastrophe bondAdjusted combined ratio-(399)-60.7%100.4%63.3%( 1,269) 11,458 8,867 37,87925,250,11124,092,32525,598,64721,834,934( 0.05) 0.48 0.35 1.73Numerator: Losses and Loss adjustment expenses 17,214 2,195 64,115 5,593Denominator: Net earned premiums 38,922 30,998 155,068 100,20744.2%7.1%41.3%5.6%Adjusted net income (loss)Weighted-average common shares outstanding, dilutedDiluted adjusted earnings per shareLoss ratioNumerator: Catastrophe losses 14,474- 50,986-Denominator: Net earned premiums 38,922 30,988 155,068 100,20737.2%0.0%32.9%0.0%Catastrophe loss ratio23110.0%
Reconciliation Of Non-GAAP Metrics Used In ThisPresentationIn ThousandsThree Months end December 31,Year Ended December 31,2020201920202019Numerator: Sum of losses and loss adjustment expenses, acquisition expenses, and otherunderwriting expenses, net of commission and other income 43,898 19,554 158,945 91,480Denominator: Net earned premiums 38,922 30,988 155,068 100,207Combined ratio112.8%63.1%102.5%91.3%-( 307)( 708)( s to numerator:Expenses associated with IPO, tax restructuring, secondary offerings, and one-timeincentive cash bonusesStock-based compensation expensePortion of expenses associated with retirement of debt classified as other underwritingexpensesExpenses associated with catastrophe bondCatastrophe lossesAdjusted combined ratio excludi
earthquake, wind and flood insurance. Analytically driven underwriting and flexible products. A.M. Best “A- (Excellent)” FSC group rating, nationwide scope through Palomar Excess and Surplus Insurance Company (“PESIC”