Transcription
Johnson Rice EnergyConferenceSeptember 24, 2019
Notices and DisclaimersForward-Looking StatementsThis investor presentation, and the related discussion, contain forward-looking statements within the meaning of Section 27A of the Securities Act of 1933, as amended, and Section 21Eof the Securities Exchange Act of 1934, as amended, that are based on the beliefs and assumptions of management of Apergy Corporation (“Apergy”) and on information currentlyavailable to Apergy’s management. Forward-looking statements include, but are not limited to, statements related to Apergy’s expectations regarding the performance of the business,financial results, liquidity and capital resources of Apergy, the effects of competition and the effects of future legislation or regulations and other non-historical statements. Forwardlooking statements include all statements that are not historical facts and can be identified by the use of forward-looking terminology such as the words “outlook,” “believes,” “expects,”“potential,” “continues,” “may,” “should,” “could,” “seeks,” “approximately,” “projects,” “predicts,” “intends,” “plans,” “estimates,” “anticipates” or the negative version of these words orother comparable words.Forward-looking statements involve risks, uncertainties and assumptions. Actual results may differ materially from those expressed in these forward-looking statements. You should not putundue reliance on any forward-looking statements in this presentation. Forward looking statements speak only as of the day they are made and Apergy does not have any intention orobligation to update forward-looking statements after Apergy distributes this presentation, except as required by law.Apergy’s outlook is provided for the purpose of providing information about our current expectations for 2019 and the general outlook for the business in the longer term. Thisinformation may not be appropriate for other purposes.Factors that could cause Apergy’s results to differ materially from those expressed in forward-looking statements are included in the section entitled “Risk Factors” in our Annual Report onForm 10-K for the year ended December 31, 2018 and filed with the Securities and Exchange Commission (“SEC”). There may be other risks and uncertainties that Apergy is unable topredict at this time or that Apergy currently does not expect to have a material adverse effect on Apergy’s business. Any such risks could cause Apergy’s results to differ materially fromthose expressed in forward-looking statements.Non-GAAP MeasuresThis investor presentation, and the related discussions, contains certain non-GAAP financial measures, which should be considered only as supplemental to, and not as superior to financialmeasures prepared in accordance with generally accepted accounting principles (“GAAP”). Please refer to the Appendix of this investor presentation for a reconciliation of these nonGAAP financial measures to the most directly comparable financial measures prepared in accordance with GAAP and definitions and calculation methodologies of defined terms used inthis investor presentation. For additional information about our non-GAAP financial measures, see our filings with the SEC.This investor presentation is not an offer to sell or the solicitation of an offer to buy any securities of Apergy, nor will there be any sales of securities of Apergy in any jurisdiction in whichthe offer, solicitation or sale would be unlawful prior to registration or qualification under the securities laws of such jurisdiction.1Copyright 2019 Apergy. All rights reserved.
Apergy Overview Leading onshore-focused equipment and digital technology provider to the upstreamoil and gas industry Most trusted brands recognized for quality, performance and customer service Highly engineered products, innovative technologies and digital solutions Focused strategy and operating philosophy leveraging a customer-centric business model Strong financial results – sustained profitability and free cash flow through business cycles Experienced and motivated team focused on collaborative approach to solvingcustomer problemsWE ARE APERGY Unlocking energy to drive value for our customers, employees and shareholders2Copyright 2019 Apergy. All rights reserved.
Recent Accomplishments Delivered adjusted EBITDA of 75 million in Q2-19, including 40 basis points ofsequential adjusted EBITDA margin improvement. Completed the qualification process and received our first order for ESPinstallations in the U.S. with one of the major International Oil Companies (IOCs).Expect to generate our first ESP revenue from this order in the second half of2019. Drove strong rod lift growth across the U.S. with revenue growth in the high singledigits for the twelve months ended June 30, 2019. Closed acquisition of digital technology which is strategic to our artificial liftportfolio. Recognized as a leader in total customer satisfaction in a survey of more than4,000 qualified customer respondents conducted by EnergyPoint Research. Highest Net Promoter Score among integrated artificial lift providers for thefourth consecutive year in an independent survey of over 300 qualified customerrespondents conducted by Kimberlite3Copyright 2019 Apergy. All rights reserved.
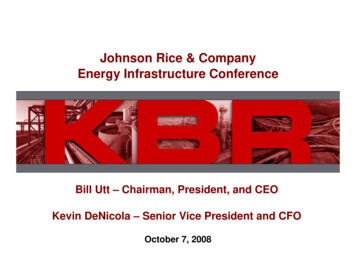
Apergy is Present Acrossthe WellsiteRevenue by Geography1International2 16%Canada 6%U.S. 78%Revenue by Product Line1DrillingTechnologies 24%Digital 10%Other ProductionEquipment 7%Artificial Lift 59%88151081234679ARTIFICIAL LIFT1. Progressive Cavity Pumps2. Rod Lift3. Plunger Lift44. ESP5. Gas LiftDRILLING TECHNOLOGIESDIGITAL6. Diamond Drill Bit Inserts7. Diamond Bearings8. IIoT Enabled Technologies9. Optimization Software10. Remote MonitoringCopyright 2019 Apergy. All rights reserved.12For the twelve months ended June 30, 2019.International defined as outside of North America.
Value Creation in Oilfield Services & Equipment“Top Box”2 Downturn Performance 41Stronger in DownturnStronger Across PeriodsStrategyLowest revenue decline from peak to trough which contributesto maintaining higher relative margins and ROICCompanies tend to be more diversified with lower net leverage More diversified business Highest EBITDAmixmargin % through the Limited exposure tocycleoffshore Strong equipment andtechnology exposure Weaker financial performers across metrics including salesgrowth, margins and ROICCompanies tend to be less diversified with more offshore anddrilling exposure and higher net leverageLimited technology offeringTend to be more services oriented Financial / CapitalAllocation Highest ROIC Lowest net leverage Most consistent &balanced capitalallocation policy Trade at highestvaluations Less capital intensiveHighest revenue growth from trough to peak but through-cyclemargins and ROIC hurt by weaker downturn performanceCompanies tend to be drilling and completions focused3Weaker Across PeriodsOperationsStronger in RecoveryRecovery Performance“Top Box” performers drive long-term shareholder value5Copyright 2019 Apergy. All rights reserved.Companies with the strongest through-cycle performance were placed in the green box – stronger across periods.
Apergy’s Value Creation AlgorithmConsistent with “Top Box” Characteristics12Revenue Growth Focus on stable revenuegrowth from a diversifiedand differentiated productportfolio Continue business mixtoward production; withselected exposure todrilling and completionswhere we can win Maintain onshore exposure6 3Margin Performance Maintain high marginsfrom productdifferentiation & valuedelivered to customers Leverage innovation todeliver products andservices that solvecustomers’ most criticalneeds Continue productivity rigorCopyright 2019 Apergy. All rights reserved. Capital Allocation After initial de-leveraging,adopt a consistent &balanced return-focusedcapital allocation policy,including return of cash toshareholders Disciplined organicinvestment plus M&Aapproach which maintains“top box” performance
Growth Priorities Aligned with Profitable,Through-Cycle Growth“Top Box” CharacteristicsDiversifyOfferingDrive ESP ShareExpansion inGrowing BasinsCapitalize on RodLift ConversionContinue DiamondSciences InnovationExpand DiamondBearing AdoptionSignificantly GrowDigital Offering7 Revenue Growth Copyright 2019 Apergy. All rights reserved.Technology/Margin Advantage Leverage strong mechanical and digitalproduct offering & service offering withestablished Apergy relationshipsPoised to capitalize on significant rod liftswitching demand from ESP and gas lift asproduction rates decline on existing wellsHigh velocity innovation driving share,performance leadership, and wideningtechnological moatPatented superior technology thatlowers cost of drillingEnhance customer safety andproductivity through “fit for purpose”digital solutions
Overview of Drilling TechnologiesLTM Q2-19 Revenue Industry leader in polycrystalline diamond cutters for oil & gas drilling and diamondbearings with industry reputation for innovation, quality and customer service Critical partner to customers in achieving drilling productivity 299mm 95% of Apergy drill bit inserts are designed to meet unique requirements and finished toexact customer specifications Well positioned to leverage industry trends – U.S. shale, horizontal drilling, increasinglaterals, more difficult drilling formations Leveraging diamond science for additional growth% Total Apergy1Product 2%24%Bearings15%83%PolycrystallineDiamondCutters (PDC)8Copyright 2019 Apergy. All rights reserved.Product m newproductsintroducedin last 3years2 RepresentsNote: May not foot due to rounding.1 Revenue for LTM Q2-19.geography by sales destination for LTM Q2-19.
Product Overview: Polycrystalline Diamond Drill BitInserts & BearingsPolycrystalline Diamond Drill Bit Inserts State of the art custom designed and manufactured drill bitinserts Proprietary technology driven by constant innovation Uncompromising commitment to outstanding quality andsuperior customer serviceDrill Bit InsertsDiamond Bearings Diamond bearings in downhole tools is a fast growingproduct line, which: Provides higher load capability Allows designs with seals, less prone to failure Longer life with lower repair cost Revenues up 68% year-over-year 2017 to 2018 millionDiamond Bearings Revenue TrendDrill Bit9Copyright 2019 Apergy. All rights reserved.5045403530252015105015161718LTM Q2-19
Overview of Production & Automation Technologies Leading provider of production and automation equipment and digital solutions forglobal E&P operatorsLTM Q2-19 936mm Proven brands known for performance reliability, technology, manufacturing qualityand pre and post sales support Broadest artificial lift portfolio that supports oil and gas operators over life of well Trusted partner to lower production costs for operators and optimize well efficiency Investment in New Product Development within ESP and our Digital platforms willcontinue to deliver share of wallet gains in the cycle and further diversify ourrevenue mix Global sales & service locations: 117 (North America) & 22 (Rest of World)% Total Apergy1Product Mix1OtherProductionEquipment 9%14%76%Production & Rockies 7%78%Copyright 2019 Apergy. All rights reserved.PermianOther1%77%Artificial LiftRecurring Revenue3Non - RecurringAPAC ROWEMEA 6% 5%Rest ofAmericasU.S. Basin2U.S.Mid-Con8%16%Bakken51%RecurringNote: May not foot due to rounding.1 Revenue for LTM Q2-192 Revenue for Q2-193 Revenue for Full Year 2018
Artificial Lift Product OfferingManaging the Life Cycle of the WellXSPOC Production Optimization Software ToolsSmarten Hardware (RTU/Controllers)LTM Q2-19Artificial LiftRevenue 724mm’18 Global Mkt Size;Growth RateElectrical SubmersiblePump (ESP)Rod LiftGas Lift &Hydraulic LiftOther 235% of Sales139% of Sales19% of Sales117% of Sales1 3.7bnStrong 3.4bnDriven by Conversions 0.5bnStrong 0.5bnMediumFlow Rate (bbls/d)Illustrative Well Production and Optimal Form of Artificial Lift ProgressionTimePrimary ESPSecondary ESPGas Lift1 Represents% of LTM Q2-19 worldwide artificial lift product revenue.2 Other includes PCP and plunger lift.11Rod LiftPlunger LiftCopyright 2019 Apergy. All rights reserved.Source: Kimberlite, Spears, PWC Artificial Lift Study, & management estimates.
Apergy’s Artificial Lift Products are Highly Valued inthe Marketplace For the fourth consecutive year, Apergy scored the highest Net Promoter Score (“NPS”) in Kimberlite’sArtificial Lift Supplier Performance Report among integrated artificial lift providers NPS is a measure of customer loyalty In 2019, Apergy’s NPS was 43% versus an industry average score of 24%High Apergy’s artificial lift product lines are rated value advantaged compared to competitors, providingcustomers outstanding value for their money2019 Net Promoter ScoreIntegrated Artificial Lift Provider Value Map85%Value DisadvantagePremium verage 24%20%30%40%50%Source: Kimberlite International Oilfield ResearchCopyright 2019 Apergy. All rights reserved.Low10%Baker ved PricingSchlumbergerSchlumberger95%Discount OfferingValue Advantage115%85%Worse90%95%100%105%Supplier Performance110%115%Better
Broad Portfolio of Digital ProductsSolutions that enhance customer safety & productivityProduction Optimization Smart edge devices for remote well sitemonitoring & controlPredictive and prescriptive failure analysisDigital Revenue Growth 119Downhole Monitoring 82Extremely accurate high resolution dataApplications in drilling, logging, and permanentmonitoring 652016Asset Integrity Management Continuous equipment health monitoring throughartificial intelligence modelsEarly detection, diagnosis, and interventionRemote monitoring capability2017201826%45%Apergy’s digital offerings drive above-market revenue growth13 129Copyright 2019 Apergy. All rights reserved.LTM Q2-19
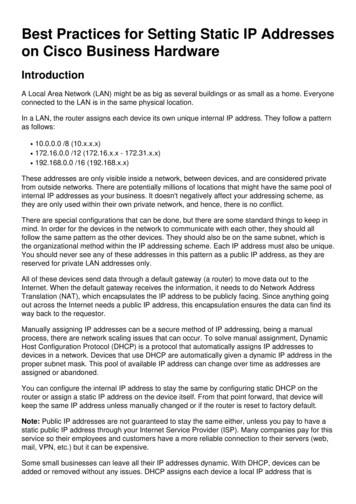
Strong Performance Through The Cycle( in millions) 1,531 1,077Revenue &Growth RateAdjustedEBITDA& AdjustedEBITDAMargin 1 751 1,010 1,217 1,235 2018 revenue growth of 20% vs.14% peer median2014201520162017201813%(30)%(30%)34%20%LTM Q2-19 444 229 116 221 296 303 2018 margin of 24% vs. 10% peermedian20142015201620172018LTM Q2-1929%21%15%22%24%25%Note: Peers include C&J Energy Services, Core Laboratories, Dril-Quip, Exterran Corporation, Forum Energy Technologies, Frank’s International, MRC Global, NOW, Oceaneering International, Oil States International, RPC, andSuperior Energy Services.1 Adjusted EBITDA and adjusted EBITDA margin are non-GAAP measures. Please see the appendix for reconciliations to the most directly comparable GAAP measure.14Copyright 2019 Apergy. All rights reserved.
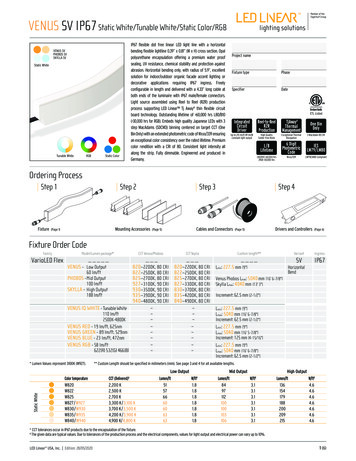
Summary Segment Financial Metrics( in millions)Production & Automation Technologies 912 638 783 932 936Revenue2015AdjustedSegmentEBITDA2016 191 982017 144Drilling Technologies2018LTM Q2-19 195 200 164 11320152016 46 228 286 29920172018LTM Q2-19 110 114 86 232015201620172018LTM Q2-192015201620172018LTM Q2-1921%15%18%21%21%28%21%38%38%38%Note: Adjusted Segment EBITDA is a non-GAAP measure calculated by adding back depreciation and amortization expense and restructuring charges to segment earnings. Please see appendix for reconciliation to the most directlycomparable GAAP measure.15Copyright 2019 Apergy. All rights reserved.
Non-GAAP MeasuresCopyright 2019 Apergy. All rights reserved.Confidential Apergy Information – May not be copied or distributedoutside of Apergy. Copyright 2019 Apergy. All rights reserved.
Reconciliation from Net Income to Adjusted EBITDA andAdjusted EBITDA Margin( in millions)2014Net income (loss) attributable to Apergy Net income attributable to noncontrolling interest Interest expense, net Provision for (benefit from) income taxes Depreciation and amortization Separation and supplemental benefit costs Restructuring and other related charges Royalty expenseAdjusted EBITDA 1Adjusted EBITDA Margin 2 2015223 1011089318444 29%201652 11241202110229 21%2017(13) 20(8)112157116 15%2018112 11(22)113710221 22%9402729124154229624%Note: Totals may not foot due to rounding.1. Adjusted EBITDA, a non-GAAP measure, is defined as net earnings (loss) excluding income taxes, depreciation and amortization, interest expense, separation and supplemental benefit costs, restructuring and other charges, androyalty expense.2. Adjusted EBITDA Margin, a non-GAAP measure, is defined as Adjusted EBITDA divided by revenue.17Copyright 2019 Apergy. All rights reserved.
Reconciliation from Net Income to Adjusted EBITDA andAdjusted EBITDA Margin( in millions)Q1-17Net income attributable to Apergy Net income (loss) attributable to noncontrolling interest Interest expense, net Provision for (benefit from) income taxes Depreciation and amortization Separation and supplemental benefit costs Restructuring and other related charges Royalty expenseAdjusted EBITDA 1Adjusted EBITDA Margin 2 13006270024921%Q2-171900927003 5722% Q3-171900829002 5822% Q4-176101(45)30072 5721% Q1-182400730002 6423% Q2-1822(0)6932520 7725% Q3-18250118304(0)0 7825% Q4-1823011533520 7825% Q1-19Q2-1922 24001010673030113300 72 7524%24% Note: Totals may not foot due to rounding.1. Adjusted EBITDA, a non-GAAP measure, is defined as net earnings (loss) excluding income taxes, depreciation and amortization, interest expense, separation and supplemental benefit costs, restructuring and other charges, androyalty expense.2. Adjusted EBITDA Margin, a non-GAAP measure, is defined as Adjusted EBITDA divided by revenue.18Copyright 2019 Apergy. All rights reserved.
Reconciliation from Segment Operating Profit to AdjustedSegment EBITDA( in millions)Production & Automation TechnologiesOperating profit (loss) Depreciation and amortization Restructuring and other related charges Royalty expenseAdjusted segment EBITDA 1201527 1017107611342 191 98 144 195 Depreciation and amortization Restructuring and other related charges12018(22) 1001372015Operating profit201758 1041910Drilling TechnologiesAdjusted segment EBITDA2016 201627 20178 201874 9916121211220046 23 86 110Note: Totals may not foot due to rounding.1. Adjusted segment EBITDA, a non-GAAP measure, is calculated by adding back deprecation and amortization expense, restructuring and other charges, and royalty expense to segment operating profit (loss).19Copyright 2019 Apergy. All rights reserved.
Reconciliation from Segment Operating Profit to AdjustedSegment EBITDA( in millions)Production & Automation TechnologiesOperating profit Depreciation and amortization Restructuring and other related charges Royalty expenseAdjusted Segment EBITDA 1Q1-17 82402 34 Drilling TechnologiesOperating profitQ1-17 Depreciation and amortization 18 02772 37 37 Q3-1720 23Q4-1720 30 Q4-179260230 37Q3-17 Q2-17153 Restructuring and other related chargesAdjusted Segment EBITDA 1Q2-1710240323 22 54 27 52 24 50 29Q1-19Q2-1916 2127283300 46 Q1-1927 30 Q4-18193020Q4-182630 Q3-182427(0)0Q3-182130 Q2-18232920Q2-182430 39 Q1-181930 Q1-18102702300 Note: Totals may not foot due to rounding.1. Adjusted segment EBITDA, a non-GAAP measure, is calculated by adding back deprecation and amortization expense, restructuring and other charges, and royalty expense to segment operating profit (loss).20Copyright 2019 Apergy. All rights reserved.Q2-1927 30 5229 242027
Copyright 2019 Apergy. All rights reserved. Notices and Disclaimers 1 Forward-Looking Statements This investor presentation, and the related discussion, contain .