Transcription
Models of the Actuarial Balance of the Pay-As-You-GoPension System. A Review and some PolicyRecommendations*María del Carmen Boado-Penas †, Carlos Vidal-Meliá and Junichi Sakamoto‡.P24 May 2010ABSTRACTThis paper reviews the two main methods used by government Social Security departmentsto draw up the so-called actuarial balance of the pay-as-you-go pension system, focusingespecially on results, methodology and actuarial issues. The specific models studied arethose in the United States, Japan and Sweden, and their main differences and similaritiesare highlighted. The authors make some specific policy recommendations that would be ofinterest to public finance economists, social security actuaries and policy makers, and theysuggest that international organizations (ISSA, the World Bank, the OECD and othersinterested in public pension reform) could be supportive in developing and enforcinginternational accounting and actuarial valuation standards for pay-as-you-go pensionsystems(JEL: H55, H83, J26, M49).Key words: Japan, Notional Accounts, Projections, Public Pensions, Retirement,Sustainability, Sweden, USA.*Carlos Vidal-Meliá and María del Carmen Boado-Penas are grateful for the financial assistance receivedfrom the Spanish Ministry of Science and Innovation (Ministerio de Ciencia e Innovación) project ECO200913616. We would also like to thank Ole Settergren for his invaluable help and comments, Richard Jackson forhis information and explanations about the US model, Gauthier Lanot for his comments and Peter Hall forhis English support. Preliminary versions of this paper were presented at the XI Spanish-Italian Congress ofFinancial and Actuarial Mathematics in Badajoz (Spain), the 4th International Colloquium of the IAAPensions, Benefits and Social Security Section (PBSS) in Tokyo (Japan), at two internal seminars organized byKeele University and the Basque Country University respectively and as a table document at the Nonfinancial Defined Contribution (NDC) Pension Conference in Stockholm (Sweden). The opinions expressedin this paper are the authors' and do not necessarily represent the views of the University of Valencia, KeeleUniversity or the Nomura Research Institute. Any errors are entirely due to the authors.† (Corresponding author) Institute for Public Policy and Management, Keele University, Keele, StaffordshireST5 5GB, UK. (e-mail: m.d.boado-penas@econ.keele.ac.uk ). Department of Financial Economics and Actuarial Science, University of Valencia, Avenida de losNaranjos, s.n. 46022 Valencia. (Spain). (e-mail: carlos.vidal@uv.es ).‡ Nomura Research Institute, 1-6-5 Marunouchi, Chiyoda-ku, Tokyo 100-0005 (Japan) (e-mail: jsakamoto@nri.co.jp ).P1
1. Introduction.According to Settergren (2008), one useful way of reaching the objective of betterdesigned and managed public pension systems is to provide better information on thefinancial development and status of those systems. In many countries, reporting on theseaspects in public pay-as-you-go (PAYG) pension systems is not fully established. Thisreduces the accumulation of knowledge as to how the pension system interacts with thedemography and the economy of these countries, reduces informed public debate onpublic pensions, increases the longevity of old misunderstandings and is fertile ground fornew ones. For Bovenberg (2003), transparency about objectives and agreement on risksharing is a key requirement for all pension systems. Explicit agreements as to how to sharerisks become even more important as ageing makes systems more vulnerable to shockssuch as unexpected longer longevity or inflation. Being explicit about risk-sharing bysetting clear rules and having more transparent accounting increases the costs associatedwith breaking the intergenerational contract and thereby reduces the political riskssurrounding public PAYG pension systems.The so-called actuarial balance of PAYG pension systems, Boado-Penas (2008), provides asuitable answer to these issues. It also supplies a positive incentive to improve financialmanagement by eliminating or at least minimizing the traditional mismatch between theplanning horizons of electors and politicians, often only four years, and the system itself.The minimum time horizon should be the system's turnover duration, the normal value ofwhich varies between 30 and 35 years, although actuarial reports often contemplate aminimum horizon of 75 years.This paper looks mainly at what will be described as the actuarial balance of the PAYGsystem. The specific models studied are those in the United States, Japan and Sweden.According to the BOT (2009), a very detailed annual actuarial balance - an actuarial report,in fact - has been compiled in the United States since 1941. From 2002 it has includedstochastic methodology. The so-called “US” actuarial balance drawn up by US SocialSecurity - similar to that published by the authorities in Japan (Sakamoto (2005)) and UK(GAD (2010)) every five years, in Canada every three years since 1966 ((OSFIC) (2007 and2008)) - is not a balance sheet in the traditional accounting sense of the term, with a list ofassets and liabilities.Compiling an official actuarial balance sheet has been normal practice in Sweden since2001. This actuarial balance sheet - in the form it takes in Sweden - has until now attractedlittle attention from academics. This is surprising given that the literature suggests manymethodologies to analyze the viability or sustainability of pension systems or to forecastaggregate spending, and this field is of special interest to a number of researchers1. As faras we are aware, only in the cases of Japan and Spain has the actuarial balance sheet with itstypical structure of assets and liabilities been used by researchers. For the case of Japan,Takayama (2005) uses the actuarial balance sheet as an element to analyze proposals forreforming the pension system, although the list he presents of the items it comprises is notvery developed, whereas Boado et al. (2008) compile an actuarial balance sheet to assess thesolvency of the Spanish system and compare it to the Swedish system. They also develop1The most commonly used methodologies for making projections of spending on pensions or analysing thesustainability of pension systems are: aggregate or growth accounting models, micro-simulation models,general equilibrium models and indirect models. On this aspect see the papers by Lefebvre (2007) and TEPC(2007).2
the concepts of the contribution asset and the average turnover duration for definedbenefit PAYG systems. Vidal-Meliá et al (2009) apply the balance sheet of the Spanishsystem to support the introduction of an automatic balance mechanism (ABM). On anofficial level, the actuarial balance sheet has not been used outside Sweden . At themoment, no other country uses the actuarial balance sheet in the form it takes in Sweden,but some countries do make financial or actuarial projections, and the analysis is verysimilar to that done in the USA, Canada, the UK and Japan .PFPThe aim of this paper is to show the advisability of drawing up an actuarial balance inPAYG pension systems so as to improve their transparency, credibility and solvency. Thisis in line with the trend seen in some developed countries which are trying to introduceactuarial analysis methodology into the field of public PAYG pension system management.The paper also aims to shed some light on the two main methods used by governmentSocial Security departments to draw up the actuarial balance, focusing especially on theirresults, methodology and actuarial issues, and makes some specific policyrecommendations that would be of interest to public finance economists, social securityactuaries and policy makers. As far as we are aware, there is a large gap in the literaturewhich we are attempting fill with this paper because, until now, this area of study has notbeen looked at from the perspective of the models used by public S.S. administrations.2Following this brief introduction, Section 2 describes, defines and presents the basicaspects of the US actuarial balance and the Japanese model. In Section 3 we define andexplain the Swedish model, especially the balance sheet and the actuarial income statement,basic assumptions, actuarial aspects and the most recent results. The paper ends with themain conclusions, focusing on the basic differences and similarities between the Swedish,US and Japanese models and specific policy recommendations.2. The Actuarial Balance: the US and Japanese Models.The methodology used to compile the actuarial balance would best be described as aprojection model of aggregate accounting spending on pensions. Basically it involves usingthe forecast demographic scenario to determine the future evolution of the number ofcontributors and pensioners according to the rules of the pension system. Themacroeconomic scenario that determines the amounts of future contributions and pensionsis exogenous.The US ModelThe Old-Age, Survivors, and Disability Insurance (OASDI) program in the United Statesmakes available a basic level of monthly income when insured workers become eligible forretirement and in cases of death or disability. The OASDI program consists of twoseparate parts that pay benefits to workers and their families - Old-Age and SurvivorsInsurance (OASI) and Disability Insurance (DI). Under OASI, monthly benefits are paid toretired workers and their families and to survivors of deceased workers. Under DI,monthly benefits are paid to disabled workers and their families.The actuarial balance of the OASDI program is aimed at measuring the system's financial2The paper by Plamondon et al. (2002) is a first attempt to conceptualize the actuarial balance of the PAYGsystem, though it obviously does not include the “Swedish” model. The paper by Boado-Penas et al (2010)does include a conceptualization of this model, and highlights the advantages that both models (Swedish andUS) could have for the case of Spain.3
sustainability with a 75-year time horizon. It measures the difference in present value discounted by the projected yield on trust fund assets - between spending on pensions andincome from contributions, expressed as a percentage of the present value of thecontribution bases for that time horizon, taking into account that the level of financialreserves (trust fund) at the end of the time horizon reaches a magnitude of one-year'sexpenditure.In simplified form, the actuarial balance (AB) can be expressed as:lue of contributionsPresent value of benefitsTrust fund 6Present44va474448 644474448 64748 Trustfund747474tt } () (1 g h )(1 λ h ) TF74 TF0 y 0 θt Nt B0 R t t 0h 1 (1 r h ) t 0 h 1 (1 r h )h 1 (1 r h ) AB 0 [1.]]7474tt(1 g)(1 g)hh y 0 Nt y 0 Nt t 0t 0h 1 (1 r h )h 1 (1 r h )144424443144424443 value of payrollsPresent value of payrolls 1444Present 44424444443 144444424444443 Summarized income rateSummarized cost ratewhich in a situation of financial equilibrium for the valuation period should give a zerovalue, where:TF0 : Value of assets at the beginning of the valuation period; θt : Payroll tax (contribution)rate in year t; y 0 : Average contribution base in year 0; Nt : Number of contributors in yeart; g: Annual real wage growth rate; r: Projected yield on trust fund assets; B0 : Averagepension (benefit) in year 0; R t : Number of pensioners in year t; λ : Annual real benefitgrowth rate; and TF74 : Value of assets at the end of the valuation period.With the data from the numerator in Formula [1], a solvency indicator similar to theSwedish one can be constructed immediately, which in a situation of solvency should give aunitary value.AB lue of incomes Assets for the valuation period Present6va444447444448 74 t(1 g h ) TF0 y 0 θt Nt t 0h 1 (1 r h ) 7474t B0 R t (1 λ h ) ( TF74 ) (1 )(1 )rt 0hh 1rhh 1424444443 144444 Present value of expenses Financial liabilities for the valuation period 1[2.]]The value of Formula [1] summarizes the system's financial deficit or surplus for the 75year horizon and only for that horizon, and it therefore allows for a sharp jump in thecontribution rate or in the benefit level at the end of the 75-year period, and for thewinding-up of the trust fund on that date. In fact the 75-year time horizon moves aheadevery year and the deficit will be noticed well before the end of the time horizon or thesharp jump materializes. If nothing is done with the program despite recognizing the deficit,the trust fund will be depleted well before the end of the 75-year time horizon, and a sharprise in the contribution rate or a steep decline in benefit levels will take place on the fund4
depletion date.If the balance is negative, the figure can be interpreted as the increase which would need tobe applied to the contribution rate - immediately from that moment - in order to financepredicted benefits until the end of the 75-year period. The balance can also be expressed asthe decrease in pensions, to be applied immediately, that would be needed for thecontribution rate not to change within the next 75 years.The report from which this actuarial balance is compiled is actually much more detailed. Itcontains a complete analysis of the assumptions used, the underlying methods and thelong-term sensitivity of the main assumptions. A stochastic actuarial balance is drawn uptoo.According to the US actuarial balance at 31-12-2008 under intermediate assumptions (socalled “best-estimate” assumption, see Table 1), the system could regain financial solvencyin 75 years if a 2.00-point increase in the contribution rate were to be implementedimmediately, applied to taxable earnings. The actuarial balance is the difference betweenthe summarized income rate and the summarized cost rate over a given valuation period.The adjusted summarized income rate (14.02%) equals the ratio of (a) the sum of the trustfund balance at the beginning of the period plus the present value of the total income fromtaxes during the period, to (b) the present value of the taxable payroll for the years in theperiod. The adjusted summarized cost rate (16.02%) is equal to the ratio of (a) the sum ofthe present value of the cost during the period plus the present value of the targeted endingtrust fund level, to (b) the present value of the taxable payroll during the projection period.5
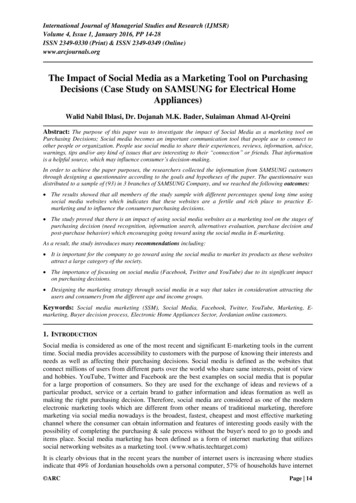
Table 1: Elements of the 75-Year Actuarial Balance under Intermediate Assumptions (2009-2083) (a).Present value as of January 1 2009, in billions of .16%123 1 245 -4 367 5 689 7-81011 (3 6)/(10)%12 (4 8)/(10)%13 (9/10)%(a)(b)(c)(d)(e)(f)Payroll tax revenueTaxation of benefits revenueTax incomeCostInitial deficitTrust fund assets at start of period (b)Open group unfunded obligation (c)Ending target trust fund (d)Results for the period (e)Taxable payrollsSummarized income rateSummarized cost rateDeterministic actuarial balanceDeterministic actuarial balance (TH )Details inStochastic actuarial balance, 50th percentile (TH 75 years)BOT (2009)(f)Source: BOT (2009) and own.According to standard actuarial terminology, the “best-estimate” scenario is that obtained under “bestestimate assumptions”. These assumptions reflect the best judgement of the experts as to futuredemographic and economic conditions that will probably affect the long-term financial viability of thesystem.This represents 17.17 % of the projected GDP in 2009.Present value of the debt that would have to be incurred to fund the payments that have been promised,wiping out all the financial assets. This should not be confused with the implicit debt of the system at aparticular date.The calculation of the actuarial balance includes the cost of accumulating a target trust fund balanceequal to 100 percent of annual cost by the end of the period.This represents 40.18% of GDP in 2009 (14,088 billion dollars), or 0.72% of the present value of theGDPs for the period 2009-2083 (788.4 trillion dollars).The outcomes from stochastic methodology should be interpreted with prudence and with a fullunderstanding of the inherent limitations. Results are very sensitive to equation specifications, degrees ofinterdependence among variables, and the historical periods used for the estimates.Similarly, all expected payments could be made up to 2083 if an across-the-board cut of13.3% were imposed on benefits4 or an allocation of 5.3 trillion US were made to the“trust fund”. Naturally a combination of both these measures could be made instead. Interms of annual deficit or surplus, a cash deficit is forecast to appear in 2016 and thereserve fund is expected to be exhausted in 2037.The result of the actuarial balance for a perpetual time horizon is -3.41%, and the unbackedliabilities are estimated at 15.1 trillion dollars. Significant uncertainty surrounds theprojections under “best-estimate” assumptions, particularly for a period as long as 75 years.Stochastic methodology estimates a probability distribution of future results of the actuarialbalance. The actuarial balance estimated using stochastic methodology for a 75-year timehorizon gives a result of -2.16% for the 50th percentile, unbacked liabilities total 5.7 trilliondollars, and the reserve fund is forecast to be exhausted in 2037, i.e. everything is similar to3A billion dollars is equal to 1 * 109 , and a billion euros would be 1 * 1012 . A trillion dollars is equal to 1 *1012 , and a trillion euros would be the much greater figure of 1 * 1018 .4 This cannot be directly obtained from Table 1. See details of calculation in BOT (2009).6
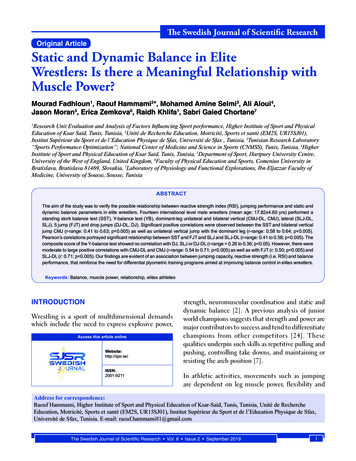
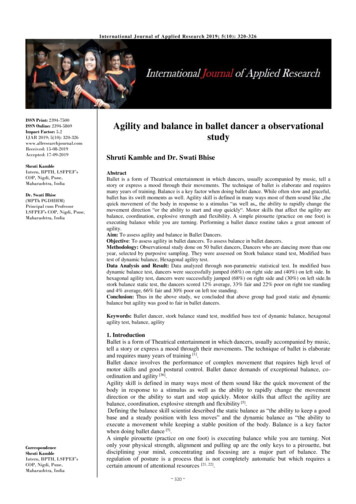
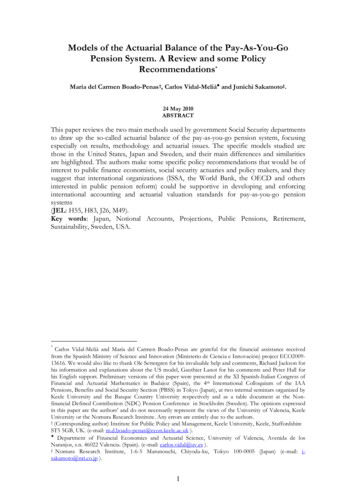
the result of the deterministic actuarial balance in the case of intermediate assumptions.The confidence interval of 95% indicates that the value of the actuarial balance swingsbetween (-3.98% and -0.56%), and this range is smaller than would be the case for the bestand worst assumptions for the system (-5,32% and 1,18%).The second vertical axis of Figure 1 shows the evolution of the actuarial balance over thelast 28 years. Although the value of the balance for 2008 (which corresponds to 31-122007) was the best for the last 15 years, comparisons between values are not fullyhomogeneous due to the fact that practically every year methodological improvements areincorporated which prevent direct comparison, although details of the changes and theiryear-on-year effects are supplied in the report on which the actuarial balance is based. Evenso, the chart gives an effective summary of each year's expectations as to the evolution ofthe system's financial health over the following 75 years. It can be seen that only thebalance for 1983 supplies a value greater than zero.16.50.0Taxable payroll %15.5-0.515.014.5-1.014.0-1.513.5Actuarial Balance %16.00.51983, AB 013.0-2.012.512.01982 1984 1986 1988 1990 1992 1994 1996 1998 2000 2002 2004 2006 2008-2.5YearIncomeCostActuarial balanceFigure 1: Historical evolution of OASDI actuarial balance estimates (1982-2009).Intermediate Assumption.Table 2 shows the past and forecast evolution for the intermediate assumption of some ofthe key elements that have an effect on determining the actuarial balance.As can be seen in the table, the annual balance worsens considerably insofar as the ratio ofcontributors to beneficiaries decreases due to the retirement of the large baby-boomgeneration between about 2011 and 2030. After 2030, increases in life expectancy and therelatively low fertility rates since the baby boom cause the level of the accumulated financialreserves to fall noticeably until they become exhausted, as shown in the value of the “trustfund ratio”, defined as the assets at the beginning of a year (including advance tax transfersif any) expressed as a percentage of the cost during the year.7
Table 2: Past figures and forecast evolution (int
May 24, 2010 · actuaries and policy makers. As far as we are aware, there is a large gap in the literature which we are attempting fill with this paper because, until now, this area of study has not been looked at from the perspec