Transcription
Understanding anActuarial Valuation ReportAugust 2008Commonwealth of MassachusettsPublic Employee Retirement Administration CommissionJames R. Lamenzo, PERAC Actuary
Commonwealth of MassachusettsPublic Employee Retirement Administration CommissionThe Honorable Domenic J. F. Russo, Chairman The Honorable A. Joseph DeNucci, Vice ChairmanThe Honorable Deval Patrick The Honorable Paul V. Doane Kenneth J. DonnellyJames M. Machado Donald R. MarquisJoseph E. Connarton, Executive Director5 Middlesex Avenue, Suite 304Somerville, MA 02145ph 617 666 4446 fax 617 628 4002 tty 617 591 8917 web www.mass.gov/peracPublished by PERAC, 2008. Printed on recycled paper.
Understanding an Actuarial Valuation ReportJames R. Lamenzo, PERAC Actuary
Actuary’s LetterIt is essential that Retirement Board Members understand valuation reports inorder to effectively complete their fiduciary duties.The purpose of this publication is to provide an advanced perspective onvaluation reports and their complexities.If you are unfamiliar with actuarial valuations, more fundamental information isavailable in the PERAC publication Actuarial Valuation Basics, available online atwww.mass.gov/perac or in print form by request.Contained in this booklet is a complete valuation of the fictional QuabbinRetirement Board. Key points about the valuation are discussed on theshaded pages.If you have any questions regarding a PERAC valuation of your retirement systemor of a more general nature, please do not hesitate to contact me.James R. LamenzoPERAC Actuaryii PUBLIC EMPLOYEE RETIREMENT ADMINISTRATION COMMISSION
Table of ContentsSectionPageIntroduction to Present Value of Future Benefits .2Quabbin Actuarial Valuation Report1. Introduction and Certification .52. Executive SummaryA. Costs under Current Valuation.7B. Comparison with Prior Valuation .9C. Gain/Loss Analysis and Plan Funding Schedule .133. Summary of Valuation Results.154. Appropriation Development for Fiscal Year 2003A. Derivation of Appropriation.17B. Current Funding Schedule.195. GASB Statement No. 25: Actuarial Information .216. Plan AssetsA. Breakdown of Assets by Investment Type.23B. Breakdown of Assets by Fund .23C. Market Value of Assets.23D. Actuarial Value of Assets.237. Information on System MembershipA. Active Members.27B. Retirees and Survivors .318.Valuation Cost MethodsA. Actuarial Cost Method .35B. Asset Valuation Method.359. Actuarial Assumptions.3710. Summary of Plan Provisions.4111. Glossary of Terms.48UNDERSTANDING AN ACTUARIAL VALUATION REPORT 1
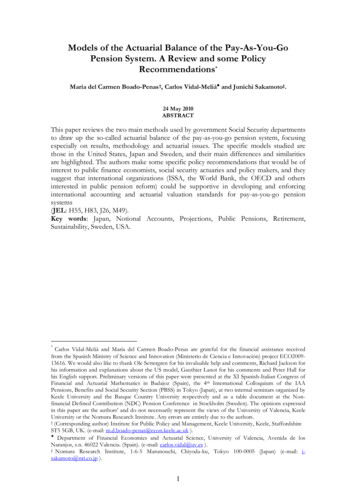
Introduction to Present Value of Future BenefitsThe Present Value of Future Benefits, represented by the three diagrams that follow, is the basis fordetermining plan costs and liabilities.Present Value of Future BenefitsFigure 1The PresentValue of FutureBenefits is equalto the PresentValue of FutureNormal Costplus theActuarialAccruedLiability (basedon members’past service).2 PUBLIC EMPLOYEE RETIREMENT ADMINISTRATION COMMISSIONFuture Normal CostActuarial Accrued Liability
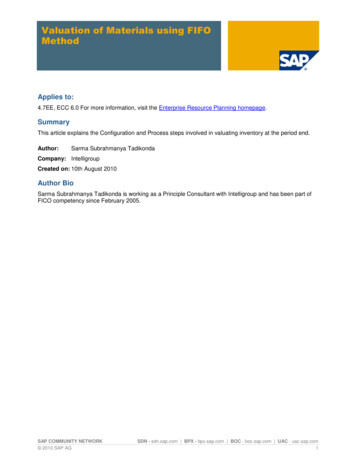
Introduction to Present Value of Future Benefits (cont.)Present Value of Future BenefitsFigure 2The UnfundedActuarialAccruedLiability (UAL)is equal to theActuarialAccruedLiability lessPlan Assets.Future Normal CostUnfunded Actuarial Accrued Liability(UAL)Actuarial Accrued LiabilityPlan AssetsPresent Value of Future BenefitsFigure 3The AnnualActuarialFundingRequirement isequal to theNormal Costplus theAmortization ofUnfundedActuarialAccruedLiability (UAL)Payment.Future Normal CostNormal Cost (Current Cost)Amortization of UAL Payment}Annual ActuarialFunding RequirementUnfunded Actuarial Accrued Liability(UAL)Actuarial Accrued LiabilityPlan AssetsUNDERSTANDING AN ACTUARIAL VALUATION REPORT 3
Key Points & ConceptsThe opening Introduction and Certification section of the valuation provides the reader with anoverview of the data used to prepare the report and the actuary’s certification that the valuationwas performed in a professional manner.123An actuarial valuation of a retirement plan is an estimate of a plan’s financial position ata specific point in time. During a valuation, an actuary takes a “snapshot” of the membershipas of a given date to determine the plan’s liabilities and funded status. A valuation estimatesthe present value of expected future cash flows.The two components that determine the valuation results are member census dataand financial data. Although PERAC reviews member and financial data for reasonableness,PERAC does not audit the information as part of the valuation.Each actuarial assumption should be reasonable.How good are the assumptions? Gains and losses are determined at each valuation based on actual vs. expectedexperience.Scheduling Valuations: Adherence to a schedule of regular valuations is likely to result inthe early identification of trends and appropriate adjustments being made on a timely basis.Periodic valuations enable a retirement board to guard against an unexpected and sizableincrease in a system’s funding schedule and appropriation amount.Although Chapter 32 requires triennial valuations, PERAC recommends performing valuationsat least every two years. In addition, we recommend interim estimated valuations be performed in off years. In the private sector annual valuations are required. PERAC’s goal, withthe help of private actuaries, is to conduct a valuation of each retirement system at leastevery two years.4 PUBLIC EMPLOYEE RETIREMENT ADMINISTRATION COMMISSION
1. INTRODUCTION & CERTIFICATION1This report presents the results of the actuarial valuation of the Quabbin ContributoryRetirement System. The valuation was performed as of January 1, 2008 pursuant toChapter 32 of the General Laws of the Commonwealth of Massachusetts.2This valuation was based on member data as of December 31, 2007, which was supplied bythe Retirement Board. Such tests as we deemed necessary were performed on the data toensure accuracy. Asset information as of December 31, 2007 was provided in the AnnualStatement for the Financial Condition as submitted to this office in accordance with G.L. c.32, ss. 20(5)(h), 23(1) and 23(2)(e). Both the membership data and financial informationwere reviewed for reasonableness, but were not audited by us.3In our opinion, the actuarial assumptions used in this report are reasonable, are relatedto plan experience and expectations, and represent our best estimate of anticipatedexperience under the system. We believe this report represents an accurate appraisal ofthe actuarial status of the system performed in accordance with generally acceptedactuarial principles and practices relating to pension plans.Respectfully submitted,Public Employee Retirement Administration CommissionJames R. LamenzoMember of the American Academy of ActuariesAssociate of the Society of ActuariesEnrolled Actuary Number 08-4709Joseph E. ConnartonExecutive DirectorJohn F. BoorackActuarial AssociateJune 30, 2008UNDERSTANDING AN ACTUARIAL VALUATION REPORT 5
Key Points & ConceptsThe Executive Summary of the PERAC Valuation is made up of three sections highlighting the mostimportant aspects of the report.The summary presents the system’s costs and liabilities, and the costin the next fiscal year under the plan’s current funding schedule. It also provides a comparison withthe results of the previous actuarial valuation, and a brief analysis of actuarial gains or losses for thesystem.12Total Normal Cost is that portion of the Actuarial Present Value of pension plan benefitswhich is accrued in the current year.The Employee Normal Cost is the amount of the expected employee contributions for the year.The Employer Normal Cost is the difference betweenthe Total Normal Cost and the Employee Normal Cost.Actuarial Accrued Liability can be described in the following ways: The present value of future benefits based on a member’s service to date The accumulation of past normal costs Present value of Future Benefits less Present Value of Future Normal Cost Past service liability (but with projected assumptions)Determining System Liabilities: For the purposes of an actuarial valuation, liabilitiesinclude Total Normal Cost and Total Actuarial Accrued Liability for the system. Total Normal Cost for the System is the sum of Normal Cost for each individualmember. Total Actuarial Accrued Liability for the System is the sum of the Actuarial Liabilityfor each individual member.6 PUBLIC EMPLOYEE RETIREMENT ADMINISTRATION COMMISSION
2. EXECUTIVE SUMMARYPART A COSTS UNDER CURRENT VALUATIONThe principal results of the January 1, 2008 actuarial valuation are shown below.Present Value of Future BenefitsActivesRetirees, Survivors, and InactivesTotal 46,679,50033,374,300 80,053,800Normal Cost1Total Normal Cost 1,680,000Expected Employee Contributions980,800Net Normal Cost 699,200Actuarial Liability and Development of Unfunded Actuarial Liability2ActivesRetirees, Survivors, and Inactives 30,625,70033,374,300Total 64,000,000Assets43,046,500Unfunded Actuarial Liability 20,953,500The Board recently adopted a funding schedule effective in FY09.UNDERSTANDING AN ACTUARIAL VALUATION REPORT 7
Key Points & Concepts1Note that the Unfunded Liability increased and the Funded Ratio decreased primarily dueto the actual investment return.8 PUBLIC EMPLOYEE RETIREMENT ADMINISTRATION COMMISSION
2. EXECUTIVE SUMMARY(continued)PART B COMPARISON WITH PRIOR VALUATIONThe last full valuation was performed by PERAC as of January 1, 2006. Our LocalExperience Study Analysis (issued in March, 2002) forms the basis for the actuarialassumptions (other than the investment return assumption) used in this valuation. Belowwe have shown the comparison between the two )% Increase(Decrease)Total Normal Cost 1,680,000 1,580,000 100,0006.3%Expected EmployeeContributions980,800924,90055,9006.0% 699,200 655,100 44,1006.7% 30,625,700 28,490,800 al 64,000,000 57,160,600 0.1% 20,953,500 18,070,600 2,882,90016.0%67.3%68.4%(1.1%)Net Normal CostActuarial LiabilityActivesRetirees and InactivesUnfunded Actuarial LiabilityFunded Ratio1UNDERSTANDING AN ACTUARIAL VALUATION REPORT 9
Key Points & ConceptsIllustration of Salary Gain or Loss(Not based on the Quabbin Valuation)1/071/08200 6,000,000240 7,320,00022.0% 30,5001.7%VALUATION DATEALL MEMBERSActive MembersTotal Pay% IncreaseAverage Pay% Increase 30,000CONTINUING MEMBERSActive MembersTotal Pay% IncreaseAverage Pay% Increase200 6,000,000 30,000Salaries increase 8.7% for continuing members during 2007.10 PUBLIC EMPLOYEE RETIREMENT ADMINISTRATION COMMISSION200 6,520,0008.7% 32,6008.7%
2. EXECUTIVE SUMMARY(continued)PART B COMPARISON WITH PRIOR VALUATION e4003776.1% 12,158,000 11,673,5824.1% 30,395 30,964(1.8%)Average Age46.746.40.6%Average ce2202123.8% 3,345,299 2,892,38215.7% 15,206 13,64311.5%70.971.1(0.3%)NumberTotal PayrollAverage SalaryRetirees and SurvivorsNumberTotal Benefits*Average Benefits*Average Age*excluding State reimbursed COLAUNDERSTANDING AN ACTUARIAL VALUATION REPORT 11
Key Points & Concepts1Retirements under Accidental Disability result in higher liabilities than expected (actuarial loss)because the benefit received under disability is generally higher than the benefit that would bereceived under Superannuation at the same age. Increases in pay that are less than assumedresult in actuarial gains.2Returns on an actuarial basis (or maket value basis if the system uses MVA) less than assumedproduce losses.3Standard investment return assumption used by PERAC is 8%.12 PUBLIC EMPLOYEE RETIREMENT ADMINISTRATION COMMISSION
2. EXECUTIVE SUMMARY(continued)PART C GAIN/LOSS ANALYSIS AND PLAN FUNDING SCHEDULE123Since the last valuation, there was a loss on plan liabilities of approximately 200,000.There were several new retirees over the past two years with annual benefits muchgreater than average, including one with a benefit greater than 85,000, and there weresignificantly more disability retirements than expected. This was partially offset by salaryincreases for continuing actives being less than expected (average pay increased 2.5% peryear for continuing actives).The rates of return on a market value basis for 2006 and 2007 were 10.0% and 14.0%respectively. There was an asset gain on a market value basis of approximately 3.0 millionover the 2-year period. The rates of return on an actuarial value basis for 2006 and 2007were 4.4% and 8.3% respectively. The lower returns on an actuarial basis reflect deferredgains as of January 1, 2008 that will be recognized in the next few years. There was anasset loss on an actuarial basis of approximately 1.5 million over the 2-year period.This valuation uses an investment return assumption of 8.25%, which was also used for theJanuary 1, 2006 valuation. The standard PERAC assumption is 8.0%. Although decreasingthis rate was discussed, we are maintaining the current assumption and will revisit thisissue as part of the next valuation.The funding schedule presented in this report was recently adopted by the board. TheFY09 payment is maintained from the current schedule. The schedule amortizes theremaining unfunded actuarial liability through 2028 with payments increasing 4.5% eachyear.UNDERSTANDING AN ACTUARIAL VALUATION REPORT 13
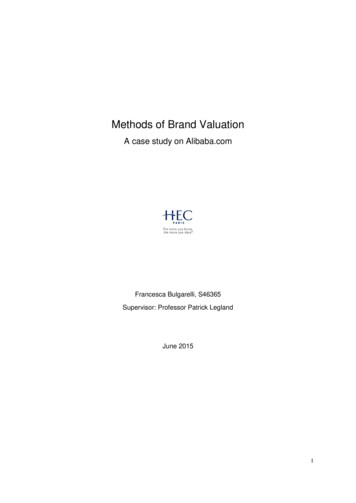
Key Points & Concepts12In the chart at right, Normal Cost and Accrued Liabilities are delineated for retirement(superannuation), death, disability, and withdrawal (termination).Found here are different views of funding using the same components: The Actuarial Accrued Liability ( 64,000,000) less plan Assets ( 43,046,500) is equal to theUnfunded Accrued Liability ( 20,953,500). The plan Assets ( 43,046,500) divided by the Actuarial Accrued Liability ( 64,000,000) isequal to the Funded Ratio (67.3%).100% fundingIf a retirement system is 100% funded, Normal Cost still applies because member benefitsaccrue during the current year. Also, 100% funding is a moving target because different valuation systems produce different results.Various percentages can be used as a the benchmark(95%, 105%).Funding status can (and does) change due to law changes and benefit enhancements.14 PUBLIC EMPLOYEE RETIREMENT ADMINISTRATION COMMISSION
3. SUMMARY OF VALUATION RESULTSA. Number of Members on Current Valuation DateActive Members400Vested Terminated Members10Retired Members and Survivors220Total630B. Total Regular Compensation of Active Members 12,158,000C. Normal CostSuperannuation1 66,100Total Normal CostExpected Employee ContributionsNet Employer Normal Cost 1,680,000980,800 699,200D. Actuarial nationTotal ActiveVested Terminated MembersNon-Vested Terminated Members2 27,485,500817,1001,610,800712,300 30,625,7001,000,000400,000Retirees and Survivors31,974,300Total Actuarial Liability 64,000,000E. Actuarial Value of Assets43,046,500F. Unfunded Actuarial Liability: D – EG. Funded Ratio: E/D 20,953,50067.3%UNDERSTANDING AN ACTUARIAL VALUATION REPORT 151
Key Points & ConceptsFor further clarification, please see pages 2 and 3.Present Value of Future BenefitsFigure 3The AnnualActuarialFundingRequirement isequal to theNormal Costplus theAmortization ofUnfundedActuarialAccruedLiability (UAL)Payment.Future Normal CostNormal Cost (Current Cost)1Amortization of UAL Payment4}Annual ActuarialFunding RequirementUnfunded Actuarial Accrued Liability(UAL)Actuarial Accrued LiabilityPlan Assets2Credited with interest to the assumed payment date (in this case 1/1/08 to 1/1/09 at 8.25%)3Reflects estimated administrative expenses not including investment related expenses.16 PUBLIC EMPLOYEE RETIREMENT ADMINISTRATION COMMISSION
4. APPROPRIATION DEVELOPMENT FOR FISCAL YEAR 2009PART A DERIVATION OF APPROPRIATIONCost Under Current Funding Schedule1. a. Normal Cost as of January 1, 20081 699,200b. For FY09 (adjusted for timing)2 756,900c. Estimated Administrative Expenses3 125,000d. Total Employer Normal Cost (b c) 881,9002. a. Unfunded Actuarial Liability as of January 1, 20084b. FY09 amortization payment (20-year, 4.5% increasing)*3. Total FY09 Payment [Sum of 1(d) and 2(b)] 20,953,500 1,518,100 2,400,000* FY09 appropriation was maintained at the same level as the prior schedule.UNDERSTANDING AN ACTUARIAL VALUATION REPORT 17
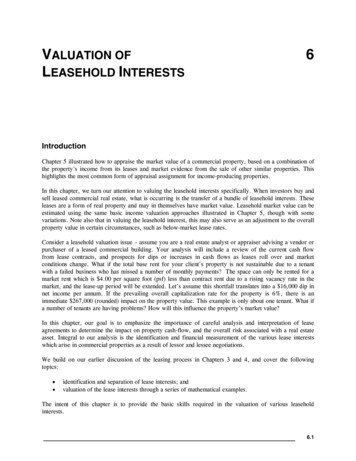
Key Points & Concepts12Normal cost is assumed to increase by 5.5% per year in this exhibit.Actuarial Unfunded Liability:Under an increasing schedule, the outstanding balance increases for a period of time. Inthe early years of the schedule, the payments are not large enough to pay the interest onthe outstanding balance.PERAC Approval of Funding SchedulesFor comparison, we have shown different schedules for various years below. Note these are forillustration only, as a new schedule would be adopted at least every three years.(DOLLARS IN THOUSANDS)Ç 2.5%LEVELÇ 4.5%Ç 2.5%Ç 4.5%AMORTIZATION COMPLETE 2,4392,439AMORTIZATION OF UALÇ 4.5%Conservative Actuarial Approaches1. Adopt more conservative assumptions for investment return, salary scale, and longevity.2. Actuarial value of assets Adopted by Commonwealth Reduces volatility3. Adopt a more aggressive funding schedule.18 PUBLIC EMPLOYEE RETIREMENT ADMINISTRATION COMMISSION
4. APPROPRIATION DEVELOPMENT FOR FISCAL YEAR
An actuarial valuation of a retirement plan is an estimate of a plan’s financial position at a specific point in time. During a valuation, an actuary takes a “snapshot” of the membership as of a given date to determine the plan