Transcription
WHITE PAPERAssessing the Business andFinancial Impact of IP UnifiedCommunications SystemsThe ShoreTel TCO Tool as a comprehensive analyticalguide to the decision-making process
Table of Contents1.Introduction . . . . . . . . . . . . . . . . . . . . . . . . . . . . . . . . . . . . . . . . . . . . . . . . . . . . . . . . 32.Industry Focus on Total Cost of Ownership . . . . . . . . . . . . . . . . . . . . . . . . . . . . . . . 43.Design Principles for an Effective TCO Tool . . . . . . . . . . . . . . . . . . . . . . . . . . . . . . . 54.ShoreTel TCO Tool Components . . . . . . . . . . . . . . . . . . . . . . . . . . . . . . . . . . . . . . . . 75.TCO Tool Results . . . . . . . . . . . . . . . . . . . . . . . . . . . . . . . . . . . . . . . . . . . . . . . . . . . . 86.Green Performance . . . . . . . . . . . . . . . . . . . . . . . . . . . . . . . . . . . . . . . . . . . . . . . . . 117.Financial Ratio Analysis . . . . . . . . . . . . . . . . . . . . . . . . . . . . . . . . . . . . . . . . . . . . . . 128.ShoreTel Financial Solutions . . . . . . . . . . . . . . . . . . . . . . . . . . . . . . . . . . . . . . . . . . . 139.ShoreTel Switch Configurator . . . . . . . . . . . . . . . . . . . . . . . . . . . . . . . . . . . . . . . . . 1410. General Benefits of TCO . . . . . . . . . . . . . . . . . . . . . . . . . . . . . . . . . . . . . . . . . . . . . 1411. The ShoreTel TCO Advantage . . . . . . . . . . . . . . . . . . . . . . . . . . . . . . . . . . . . . . . . . 1512. Conclusion . . . . . . . . . . . . . . . . . . . . . . . . . . . . . . . . . . . . . . . . . . . . . . . . . . . . . . . . 16Table 1:TCO Cost Components . . . . . . . . . . . . . . . . . . . . . . . . . . . . . . . . . . . . . . . . . . 6Table 2:Financial Ratio Comparison by Vendor . . . . . . . . . . . . . . . . . . . . . . . . . . . . 12Graph 1:TCO Comparison of Major UC System Vendors (Pre-Tax) . . . . . . . . . . . . . . . 8Graph 2:ShoreTel Cost Reduction Advantage . . . . . . . . . . . . . . . . . . . . . . . . . . . . . . . 9Graph 3:Post-Tax Cash Flow by UC Vendor . . . . . . . . . . . . . . . . . . . . . . . . . . . . . . . . 10Graph 4:TCO Comparison and Cost-Saving Advantage of ShoreTel (Post-Tax) . . . . 10Graph 5:Energy Cost Comparison of Major Vendors . . . . . . . . . . . . . . . . . . . . . . . . 11Assessing the Business and Financial Impact of IP Unified Communications SystemsPAGE 2
1. IntroductionToday’s business environment is characterized by pervasive global competition, moreintense business cycles, faster flow of information and communication, and increasedbusiness complexity. The business communications challenges that arise in this newenvironment invariably impact business flexibility, responsiveness, customer service,supplier relations, and the overall ability of each business to compete and succeed.Organizations are rapidly adopting and expanding unified communications (UC) as astrategic response to the need to productively manage communications in a multidevice, mobile and distributed environment; extend the workspace beyond thetraditional desktop; speed information access; and dramatically improve collaborationand decision making processes.As market shifts drive continued changes in business requirements, and as technologicalcapabilities evolve even more rapidly, companies are turning to more robust businessand financial analysis methods to validate the investment in these new communicationscapabilities. Total Cost of Ownership (TCO) has become an important metric forassessing and tracking the risks, costs and benefits of UC solutions under evaluation.TCO enables organizations to compare competing solutions on an equal footing—likefor like—and align those solutions with business needs, while understanding the effectsof future requirements and functionalities.The focus of the ShoreTel TCO Tool is to capture and assess all of the costs incurred andsavings delivered by a state-of-the-art UC solution, for organizations of all sizes. Thisinformation can be used: As an important technological and financial guide to the decision-making process To provide sound empirical evidence to support the best UC technology choice,including product functionality and future services needs To help organizations determine future costs and plan for increased efficiencies To capture the organizational impact of product and system management complexity,as it varies across UC vendors To provide an objective measure of the total business impact of the UC purchasedecision As a way to effectively compare the advantages between leasing and purchasing a UCsystem To build faster and more robust organizational consensus around the UC purchasedecisionThe purpose of this white paper is to present and discuss the ShoreTel TCO Tool—ananalytical method that informs and accelerates the technology evaluation process bycalculating and comparing the TCO of available IP-based UC systems.Assessing the Business and Financial Impact of IP Unified Communications SystemsPAGE 3
2. Industry Focus on Total Cost of OwnershipAs organizations grow in both complexity and global reach, attaining consensus ontechnology purchasing decisions from key stakeholders has become increasinglytime consuming and difficult. Yet organizations that can respond quickly to changingmarketplaces and rapidly adopt technologies that improve business operations andprocesses have a distinct competitive advantage.While it is virtually impossible to predict the exact results of a business decision, effectiveTCO analysis can help organizations choose and deploy UC solutions effectively,increasing shareholder value and rapidly improving business agility.In today’s economic environment, three industry factors are driving the adoption of TCOas a key criteria for enterprises considering a UC system purchase:i. Shift from “technology” to “economic” buyers with voice over IP (VoIP) marketmaturity. The UC industry has seen a recent shift from early-adopter and technologyinnovator decision makers, to organizations that are much more concerned with thedirect financial impact of their infrastructure purchase decision. This latter group oforganizations make their purchasing decisions based on the impact to their businessand operational economics (process efficiencies, staff efficiencies, profit contributionetc.), rather than the elegance or power of the underlying architecture and technology.This shift is consistent with the general mainstream adoption and recent maturing ofthe UC industry.ii. Larger enterprises are beginning to adopt UC. ShoreTel has seen rapid recent growthin the number of large enterprises ( 500 phones) adopting UC for the first time. Suchbuyers generally employ dedicated IP telephony professionals who are more likely topurchase a UC system based on its broader financial impact on their business.iii. Macro-economic uncertainty. Existing legacy time-division multiplexing (TDM)solutions have come under increased scrutiny in recent years as their maintenancecosts increase, and as they increasingly fail to deliver the productivity benefits that arenow offered by modern IP-based UC solutions. Periods of economic uncertainty oftenforce a greater level of focus on these existing costs, and lead to a renewed urgencyand attention on technology to drive out these inefficiencies. These same factors areforcing organizations and vendors to develop a robust, credible, complete, multiyearcost analysis to justify these investments, and choose the platform that will deliver onsuch cost-reduction promises.Assessing the Business and Financial Impact of IP Unified Communications SystemsPAGE 4
3. Design Principles for an Effective TCO ToolShoreTel has developed the TCO tool as a proprietary analytical assessment, designed tohelp business partners and organizations calculate and compare the TCO of alternativeUC systems over multiple years. This information is key to understanding the costs, risksand benefits associated with a UC system purchase, and serves as a valuable guide to thebuyer’s decision-making process.The TCO Tool was designed to be powerful, flexible and extremely easy to use, and wasimplemented with the following key design principles: Third Party Data. The tool makes exclusive use of independent, third-party data fordriving each of the TCO cost computations. This approach maximizes the credibilityand audit-ability of the underlying cost data, and increases the likelihood thatorganizations will take ownership of the TCO computations and results, and theinvestment decisions that flow from such analysis. Configurable. The tool can be rapidly configured for any organization’s exactcircumstance, including industry vertical, number of phones and sites, analog mix, mixof North American and international sites, trunk density, etc. This ensures that TCOcomputations, while based on industry data, are adapted and configured for eachorganization’s specific telephony requirements and circumstances. Customizable. Organizations are able to update or override cost assumptions or resultsat each calculation step. They also have the ability to define the measurement period.This ensures each organization’s experience and/or actual cost data is incorporated intothe final TCO result. Accuracy. ShoreTel continues to work with industry analysts to increase surveycoverage, improve survey methodology, and increase the granularity of the underlyingcost data. Full Competitor Coverage. The ShoreTel TCO Tool is able to provide simultaneous andparallel cost calculations for TDM and a number of UC solution alternatives, includingthose from Cisco, Nortel, Avaya and Mitel. Designed for both IT and Finance Users. In addition to providing valuable IT insight,the ShoreTel TCO Tool provides automatic calculation of key financial ratios that enablefinancial decision makers to rapidly assess the financial viability and attractiveness ofeach UC alternative. Easy to Use. The tool provides easily understood and compelling graphical output,linked automatically to the TCO cost results.Assessing the Business and Financial Impact of IP Unified Communications SystemsPAGE 5
At the early evaluation stage of a UC project, an in-depth TCO analysis provides valuableinsight into the human factors around technology adoption, as well as longer-termtechnology implications. With a full TCO analysis, executives and other staff members aremore likely to buy into the project, further ensuring their participation and commitmentto the project’s success.Table 1:TCO Cost ComponentsSource DataMethodologySwitches, phones, softwareCisco, Avaya, Nortel, Mitel List price estimates calculated via explicit andcomparative system configurations calculations for Ciscoand ShoreTel, and by price-per-endpoint regressionanalysis (for each site) for Avaya, Nortel and Mitel Tool accommodates discount-to-list estimates, or actualvendor product quotes (if available)Network upgradeNemertes (network upgrade cost perendpoint, by competitor) Network upgrade capital cost computed from cost-perendpoint survey data multiplied by number of endpoints Results can be modified based on existing networkstatus and/or actual vendor network upgrade quotes (ifavailable)System management toolsNemertes (cost per user for networkmanagement tools for all UC vendors) Cost per endpoint survey data applied to number ofendpoints Results can be modified, overridden, or zeroed outImplementation (planning, installation,system stabilization)Nemertes (planning, installation andtrouble-shooting hours per end-pointdata, by UC vendor)TrainingNemertes (training requirements andcost per student data, all UC vendors) Total implementation cost computed from hours-perendpoint survey data for planning, installation andtroubleshooting; labor rate assumptions and number ofendpoints can be entered Results can be modified, overridden, or zeroed outCost ComponentCapital costsOperational startup costs Staff training cost computed from student trainingrequirements (number) and training cost per student forVoIP Vendor-specific training quotes can be entered (ifavailable)Ongoing telephony system costsSupport (support, software upgrades)ShoreTel Partner Survey (UC vendormaintenance policies) Maintenance cost estimated from product list pricecalculation and vendor-specific maintenance costpolicies Software upgrade and maintenance costs can beoverridden with vendor quotes (if available)Moves, adds and changesNemertes (MACs per employee surveydata, by vertical industry) MAC cost computed from number of employees, MACsper employee and organization-input labor cost MAC cost may be modified/overridden with actualoutsourced or internal headcount cost (if known)Telephony system managementAlinean Research (system managementheadcount and salary cost, VoIP versusTDM) System management costs for all UC vendors computedfrom UC headcount savings (moving from TDM to VoIP) System management cost for each UC vendor can becomputed by inputting specific salary and headcountassumptionsT1, analog and tie line circuit costsShoreTel Partner Survey T1 and analog trunk costs computed from systemconfiguration requirements Results can be modified, overridden, or zeroed outIP WAN bandwidthAlinean Research (WAN cost, TDMversus VoIP) Standard WAN cost uplift assumed for VoIP comparedwith TDM (based on Alinean Research survey data) Results can be modified, overridden, or zeroed outLong distance charges (impact of OfficeAnywhere*)Alinean Research (domestic andinternational long distance charges, %inter-office call minutes) Domestic and international long distance savingscomputed from inter-office call minutes, and averagelong distance charges Impact of ShoreTel Office Anywhere is based on theorganization’s assumptions regarding use, and averagetoll reduction achieved using Office AnywhereElectricity/energy costsEnvironmental Protection Agency (EPA) Power and cooling costs are based on organization-inputconfiguration requirements calculated for each UCvendor based on specific phone, server and switchrequirements EPA electricity costs may be modifiedOngoing network costs* ShoreTel Office Anywhere enables users to assign their extension to any other telephone or mobile device.Assessing the Business and Financial Impact of IP Unified Communications SystemsPAGE 6
4. ShoreTel TCO Tool ComponentsBased on these principles and each organization’s specific configuration data, theShoreTel TCO tool computes and compiles the following system costs for each UCsolution: .UC system capital and replacement costs .Network upgrade Operational start-up (including planning, installation, system stabilization and stafftraining) .Ongoing support (including software upgrades) .Moves, adds and changes (MAC) .Telephony system management .Costs associated with any system downtime .Ongoing network costs .Long distance charges .Energy consumption and carbon footprint for UC solutionsAssessing the Business and Financial Impact of IP Unified Communications SystemsPAGE 7
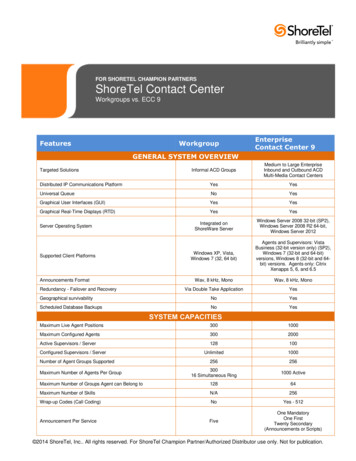
5. TCO Tool ResultsTo illustrate the value of the ShoreTel TCO Tool as an important guide in the purchasingdecision-making process, the result of a 10-year TCO analysis for a large enterpriseconfiguration (1,500 users across three sites) is detailed below. This is the VoiceConstandard “Large Enterprise” configuration, and assumes 1,250 users at a headquarterssite, 200 users at a remote office, and 50 users at a satellite office. Site survivability wasalso an important requirement for all sites.30Graph 1:TCO Comparison ofMajor UC SystemVendors (Pre-Tax)Long distance chargesNetwork costsElectricity consumptionSystem management, MACs, downtimeSupport servicesImplementation and trainingCapital cost for network upgradeCapital cost for telephony system25 M2015 14.19 26.37 19.17 19.59 15.0110 6.7250.0ShoreTelMitelAvayaMicrosoftCiscoTDMVendor / TechnologyThe TCO analysis combines all tangible up-front capital costs (including UC system,network upgrade, management tools and capitalized implementation charges);with annual recurring operating expenses (training and support; MAC and systemmanagement; system downtime; T1, analog, tie line circuit, IP WAN and long distancecharges; and electricity costs).The ShoreTel TCO Tool also enables direct cost comparisons between ShoreTel andselected UC alternatives. In the example noted, ShoreTel delivers a TCO equal to 8.67million pre-tax/ 5.64 million post-tax over 10 years, while the TCO for Cisco over thesame period is 13.89 million pre-tax/ 9.03 million post-tax—in other words, 60.2 percentgreater than ShoreTel.Assessing the Business and Financial Impact of IP Unified Communications SystemsPAGE 8
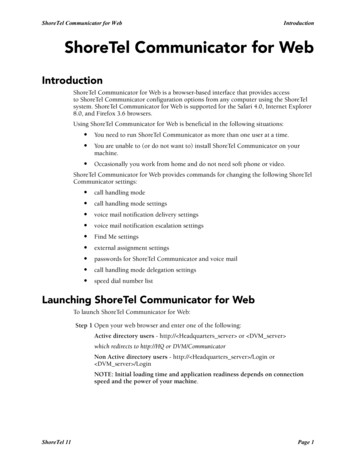
M15 14.76 14.0210 6.8650.0ShoreTelMitelAvayaMicrosoftCiscoTDMVendor/ Technologythatinitialsystem capitalThis analysis also demonstratescost is only a minor componentof the total cost impact that a UC platform can have on a business, and should thereforebe of less importance in driving the final UC platform decision.Total Cost of Ownership (TCO) Comparison(Pre-Tax CashOutlay)After accounting for all TCO components,ShoreTeldelivers a TCO which is 12 percentGraph1: TCOComparisonof majorlessUC systemlessthanMitel,20 percentthanvendorsAvaya, 24 percent less than Nortel, almost 35 percentless than Cisco and nearly 44 percent less than an existing TDM system. In other words,the calculated TCO for an existing TDM system over the same period is 87.4 percentmore, and the TCO for Cisco over the same period is 60.2 percent more than the TCO ofa ShoreTel UC system.Graph 2:ShoreTel CostReduction .09%15%12.25%10%5%0%TDMCiscoNortelAvayaMitelVendor / TechnologyIn Graph 3, explicit year-over-year incremental cash flows (incremental to existing TDMTCOsystem operating costs) are ShoreTelpresented foreachAdvantageUC vendor over a 10-year period. This(ShoreTelCostReductionvs.TDMandup-frontIPT Alternativesillustrates how ShoreTel consistently requires thelowestinvestment and drivesthe highest ongoing after-tax cost savings.This analysis demonstrates ShoreTel has a TCO that is significantly less than the TCOdeliveredby existingTDMAdvantageor competing UC solutions.Graph 2: ShoreTelCost ReductionAssessing the Business and Financial Impact of IP Unified Communications SystemsPAGE 9
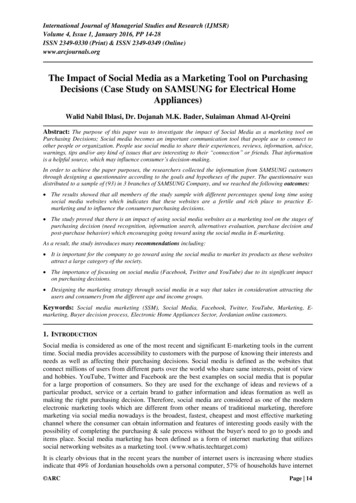
M1.00.50.0(0.5)(1.0) MGraph 3:Post-Tax Cash Flowby UC apital/Year 1UpfrontInvestmentYear 2Year 4Year 5Year 6PeriodCiscoYear 7NortelYear 8Year 9Year 10AvayaMitelShoreTelPost-Tax Cash Flow by IPT Vendor(3.0)(Incremental to Existing / TDM System Costs)(3.5)(4.0)Year 3Graph 3: Post-Tax Cash Flow by IPT VendorCapital/Year 1Year 2Year 3Year 4UpfrontInvestmentYear 5Year 6Year 7Year 8Year 9Year 10PeriodIn Graph 4, ShoreTel’s direct TCO advantage over Cisco is disaggregated into its variousPost-Tax Cash Flow by IPT Vendorsource components: UC system capital cost, network upgrade, implementation, training,(Incremental to Existing / TDM System Costs)support, MAC, telephony system management, network cost, electricity charges andtax savings,providing important visibility into ShoreTel’s advantage in individual costGraph 3: Post-Tax Cash Flow by IPT 61.83105MillionsGraph 4:TCO Comparison andCost Saving Advantageof ShoreTel lementationTraining& ty0.160.25TaxSavings5.64ShoreTelTCOCost Component3TCO Comparison2(ShoreTel Post-Tax TCO Reduction Components)1Assessing the Business and Financial Impact of IP Unified Communications Systems0-1Graph 4: TCO Comparison by Cost ionTraining& SupportMACSystemManagementCost ComponentNetworkElectricityPAGE 10TaxSavingsShoreTelTCO
6. Green PerformanceE
List price estimates calculated via explicit and comparative system configurations calculations for Cisco and ShoreTel, and by price-per-endpoint regression analysis (for each site) for Avaya, Nortel and Mitel Tool accommodates discount-to-list