Transcription
Vanguard U.S. Stock ETFsProspectusApril 27, 2016Exchange-traded fund shares that are not individually redeemable and are listedon NYSE ArcaVanguard Total Stock Market Index Fund ETF Shares (VTI)Vanguard Extended Market Index Fund ETF Shares (VXF)Vanguard Large-Cap Index Fund ETF Shares (VV)Vanguard Mid-Cap Index Fund ETF Shares (VO)Vanguard Small-Cap Index Fund ETF Shares (VB)Vanguard Value Index Fund ETF Shares (VTV)Vanguard Mid-Cap Value Index Fund ETF Shares (VOE)Vanguard Small-Cap Value Index Fund ETF Shares (VBR)Vanguard Growth Index Fund ETF Shares (VUG)Vanguard Mid-Cap Growth Index Fund ETF Shares (VOT)Vanguard Small-Cap Growth Index Fund ETF Shares (VBK)This prospectus contains financial data for the Funds through the fiscal year ended December 31, 2015.The Securities and Exchange Commission (SEC) has not approved or disapproved these securities orpassed upon the adequacy of this prospectus. Any representation to the contrary is a criminal offense.
ContentsVanguard ETF SummariesInvesting in Vanguard ETF Shares67Total Stock Market ETF1Investing in Index Funds69Extended Market ETF7More on the Funds and ETF Shares70Large-Cap ETF13The Funds and Vanguard79Mid-Cap ETF19Investment Advisor80Small-Cap ETF25Dividends, Capital Gains, and Taxes81Value ETF31Share Price and Market Price83Mid-Cap Value ETF37Additional Information85Small-Cap Value ETF43Financial Highlights86Growth ETF49Glossary of Investment Terms99Mid-Cap Growth ETF55Small-Cap Growth ETF61
Vanguard Total Stock Market ETFInvestment ObjectiveThe Fund seeks to track the performance of a benchmark index that measures theinvestment return of the overall stock market.Fees and ExpensesThe following table describes the fees and expenses you may pay if you buy and holdETF Shares of the Fund.Shareholder Fees(Fees paid directly from your investment)Transaction Fee on Purchases and SalesNone through Vanguard(Broker fees vary)Transaction Fee on Reinvested DividendsNone through Vanguard(Broker fees vary)Transaction Fee on Conversion to ETF SharesNone through Vanguard(Broker fees vary)Annual Fund Operating Expenses(Expenses that you pay each year as a percentage of the value of your investment)Management Fees0.04%12b-1 Distribution FeeNoneOther Expenses0.01%Total Annual Fund Operating Expenses0.05%1
ExampleThe following example is intended to help you compare the cost of investing in theFund’s ETF Shares with the cost of investing in other funds. It illustrates thehypothetical expenses that you would incur over various periods if you invested 10,000 in the Fund’s shares. This example assumes that the Shares provide a returnof 5% each year and that total annual fund operating expenses remain as stated in thepreceding table. You would incur these hypothetical expenses whether or not youredeem your investment at the end of the given period. Although your actual costsmay be higher or lower, based on these assumptions your costs would be:1 Year3 Years5 Years10 Years 5 16 28 64This example does not include the brokerage commissions that you may pay to buyand sell ETF Shares of the Fund.Portfolio TurnoverThe Fund pays transaction costs, such as commissions, when it buys and sellssecurities (or “turns over” its portfolio). A higher portfolio turnover rate may indicatehigher transaction costs and may result in more taxes when Fund shares are held in ataxable account. These costs, which are not reflected in annual fund operatingexpenses or in the previous expense example, reduce the Fund’s performance. Duringthe most recent fiscal year, the Fund’s portfolio turnover rate was 3% of the averagevalue of its portfolio.Principal Investment StrategiesThe Fund employs an indexing investment approach designed to track theperformance of the CRSP US Total Market Index, which represents approximately100% of the investable U.S. stock market and includes large-, mid-, small-, andmicro-cap stocks regularly traded on the New York Stock Exchange and Nasdaq. TheFund invests by sampling the Index, meaning that it holds a broadly diversifiedcollection of securities that, in the aggregate, approximates the full Index in terms ofkey characteristics. These key characteristics include industry weightings andmarket capitalization, as well as certain financial measures, such as price/earningsratio and dividend yield.2
Principal RisksAn investment in the Fund could lose money over short or even long periods. Youshould expect the Fund’s share price and total return to fluctuate within a wide range.The Fund is subject to the following risks, which could affect the Fund’s performance: Stock market risk, which is the chance that stock prices overall will decline. Stockmarkets tend to move in cycles, with periods of rising prices and periods of falling prices.In addition, the Fund’s target index may, at times, become focused in stocks of aparticular market sector, which would subject the Fund to proportionately higherexposure to the risks of that sector. Index sampling risk, which is the chance that the securities selected for the Fund, inthe aggregate, will not provide investment performance matching that of the Fund’starget index. Index sampling risk for the Fund should be low.Because ETF Shares are traded on an exchange, they are subject to additional risks: The Fund’s ETF Shares are listed for trading on NYSE Arca and are bought and soldon the secondary market at market prices. Although it is expected that the marketprice of an ETF Share typically will approximate its net asset value (NAV), there maybe times when the market price and the NAV differ significantly. Thus, you may paymore or less than NAV when you buy ETF Shares on the secondary market, and youmay receive more or less than NAV when you sell those shares. Although the Fund’s ETF Shares are listed for trading on NYSE Arca, it is possiblethat an active trading market may not be maintained. Trading of the Fund’s ETF Shares may be halted by the activation of individual ormarketwide trading halts (which halt trading for a specific period of time when theprice of a particular security or overall market prices decline by a specifiedpercentage). Trading of the Fund’s ETF Shares may also be halted if (1) the shares aredelisted from NYSE Arca without first being listed on another exchange or (2) NYSEArca officials determine that such action is appropriate in the interest of a fair andorderly market or for the protection of investors.An investment in the Fund is not a deposit of a bank and is not insured or guaranteedby the Federal Deposit Insurance Corporation or any other government agency.3
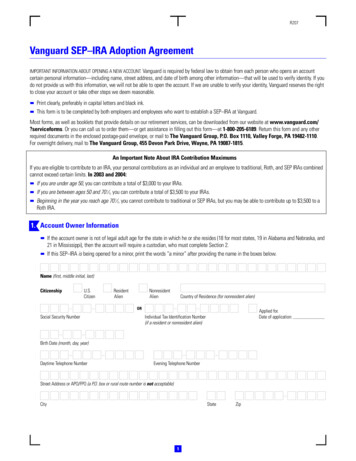
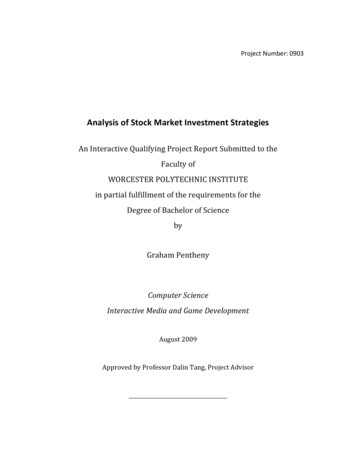
Annual Total ReturnsThe following bar chart and table are intended to help you understand the risks ofinvesting in the Fund. The bar chart shows how the performance of the Fund‘s ETFShares (based on NAV) has varied from one calendar year to another over the periodsshown. The table shows how the average annual total returns of the ETF Sharescompare with those of the Fund‘s target index and other comparative indexes, whichhave investment characteristics similar to those of the Fund. Keep in mind that theFund’s past performance (before and after taxes) does not indicate how the Fund willperform in the future. Updated performance information is available on our website atvanguard.com/performance or by calling Vanguard toll-free at 800-662-7447.Annual Total Returns — Vanguard Total Stock Market Index Fund ETF 20%-40%-60%-36.97During the periods shown in the bar chart, the highest return for a calendar quarterwas 16.96% (quarter ended June 30, 2009), and the lowest return for a quarter was–22.71% (quarter ended December 31, 2008).4
Average Annual Total Returns for Periods Ended December 31, 20151 Year5 Years10 YearsVanguard Total Stock Market Index Fund ETF SharesBased on NAVReturn Before .157.51MSCI US Broad Market Index0.57%12.25%7.55%Spliced Total Stock Market Index0.4012.187.51CRSP US Total Market Index0.40——Return After Taxes on DistributionsReturn After Taxes on Distributions and Sale of Fund Shares0.40%Based on Market PriceReturn Before TaxesComparative Indexes(reflect no deduction for fees, expenses, or taxes)Actual after-tax returns depend on your tax situation and may differ from those shown inthe preceding table. When after-tax returns are calculated, it is assumed that theshareholder was in the highest individual federal marginal income tax bracket at the timeof each distribution of income or capital gains or upon redemption. State and localincome taxes are not reflected in the calculations. Please note that after-tax returns arenot relevant for a shareholder who holds fund shares in a tax-deferred account, such asan individual retirement account or a 401(k) plan. Also, figures captioned Return AfterTaxes on Distributions and Sale of Fund Shares may be higher than other figures for thesame period if a capital loss occurs upon redemption and results in an assumed taxdeduction for the shareholder.Investment AdvisorThe Vanguard Group, Inc. (Vanguard)Portfolio ManagersWalter Nejman, Portfolio Manager at Vanguard. He has co-managed the Fund since 2016.Gerard C. O’Reilly, Principal of Vanguard. He has managed the Fund since 1994(co-managed since 2016).5
Purchase and Sale of Fund SharesYou can buy and sell ETF Shares of the Fund through a brokerage firm. The price youpay or receive for ETF Shares will be the prevailing market price, which may be moreor less than the NAV of the shares. The brokerage firm may charge you a commissionto execute the transaction. Unless imposed by your brokerage firm, there is nominimum dollar amount you must invest and no minimum number of shares you mustbuy. ETF Shares of the Fund cannot be directly purchased from or redeemed with theFund, except by certain authorized broker-dealers. These broker-dealers may purchaseand redeem ETF Shares only in large blocks (Creation Units) worth several milliondollars, typically in exchange for baskets of securities. For this Fund, the number ofETF Shares in a Creation Unit is 100,000.Tax InformationThe Fund’s distributions may be taxable as ordinary income or capital gain. If youare investing through a tax-deferred retirement account, such as an IRA, special taxrules apply.Payments to Financial IntermediariesThe Fund and its investment advisor do not pay financial intermediaries for sales ofFund shares.6
Vanguard Extended Market ETFInvestment ObjectiveThe Fund seeks to track the performance of a benchmark index that measures theinvestment return of small- and mid-capitalization stocks.Fees and ExpensesThe following table describes the fees and expenses you may pay if you buy and holdETF Shares of the Fund.Shareholder Fees(Fees paid directly from your investment)Transaction Fee on Purchases and SalesNone through Vanguard(Broker fees vary)Transaction Fee on Reinvested DividendsNone through Vanguard(Broker fees vary)Transaction Fee on Conversion to ETF SharesNone through Vanguard(Broker fees vary)Annual Fund Operating Expenses(Expenses that you pay each year as a percentage of the value of your investment)Management Fees0.07%12b-1 Distribution FeeNoneOther Expenses0.02%Total Annual Fund Operating Expenses0.09%7
ExampleThe following example is intended to help you compare the cost of investing in theFund’s ETF Shares with the cost of investing in other funds. It illustrates thehypothetical expenses that you would incur over various periods if you invested 10,000 in the Fund’s shares. This example assumes that the Shares provide a returnof 5% each year and that total annual fund operating expenses remain as stated in thepreceding table. You would incur these hypothetical expenses whether or not youredeem your investment at the end of the given period. Although your actual costsmay be higher or lower, based on these assumptions your costs would be:1 Year3 Years5 Years10 Years 9 29 51 115This example does not include the brokerage commissions that you may pay to buyand sell ETF Shares of the Fund.Portfolio TurnoverThe Fund pays transaction costs, such as commissions, when it buys and sellssecurities (or “turns over” its portfolio). A higher portfolio turnover rate may indicatehigher transaction costs and may result in more taxes when Fund shares are held in ataxable account. These costs, which are not reflected in annual fund operatingexpenses or in the previous expense example, reduce the Fund’s performance. Duringthe most recent fiscal year, the Fund’s portfolio turnover rate was 6% of the averagevalue of its portfolio.Principal Investment StrategiesThe Fund employs an indexing investment approach designed to track theperformance of the Standard & Poor‘s Completion Index, a broadly diversified index ofstocks of small and mid-size U.S. companies. The S&P Completion Index contains allof the U.S. common stocks regularly traded on the New York Stock Exchange and theNasdaq over-the-counter market, except those stocks included in the S&P 500 Index.The Fund invests by sampling the Index, meaning that it holds a broadly diversifiedcollection of securities that, in the aggregate, approximates the full Index in terms ofkey characteristics. These characteristics include industry weightings and marketcapitalization, as well as certain financial measures, such as price/earnings ratio anddividend yield.8
Principal RisksAn investment in the Fund could lose money over short or even long periods. Youshould expect the Fund’s share price and total return to fluctuate within a wide range.The Fund is subject to the following risks, which could affect the Fund’s performance: Stock market risk, which is the chance that stock prices overall will decline. Stockmarkets tend to move in cycles, with periods of rising prices and periods of fallingprices. The Fund’s target index tracks a subset of the U.S. stock market, which couldcause the Fund to perform differently from the overall stock market. In addition, theFund’s target index may, at times, become focused in stocks of a particular marketsector, which would subject the Fund to proportionately higher exposure to the risksof that sector. Investment style risk, which is the chance that returns from small- and midcapitalization stocks will trail returns from the overall stock market. Historically, smalland mid-cap stocks have been more volatile in price than the large-cap stocks thatdominate the overall market, and they often perform quite differently. Small and midsize companies tend to have greater stock volatility because, among other things,these companies are more sensitive to changing economic conditions. Index sampling risk, which is the chance that the securities selected for the Fund, inthe aggregate, will not provide investment performance matching that of the Fund’starget index. Index sampling risk for the Fund should be low.Because ETF Shares are traded on an exchange, they are subject to additional risks: The Fund’s ETF Shares are listed for trading on NYSE Arca and are bought and soldon the secondary market at market prices. Although it is expected that the marketprice of an ETF Share typically will approximate its net asset value (NAV), there maybe times when the market price and the NAV differ significantly. Thus, you may paymore or less than NAV when you buy ETF Shares on the secondary market, and youmay receive more or less than NAV when you sell those shares. Although the Fund’s ETF Shares are listed for trading on NYSE Arca, it is possiblethat an active trading market may not be maintained. Trading of the Fund’s ETF Shares may be halted by the activation of individual ormarketwide trading halts (which halt trading for a specific period of time when theprice of a particular security or overall market prices decline by a specifiedpercentage). Trading of the Fund’s ETF Shares may also be halted if (1) the shares aredelisted from NYSE Arca without first being listed on another exchange or (2) NYSEArca officials determine that such action is appropriate in the interest of a fair andorderly market or for the protection of investors.An investment in the Fund is not a deposit of a bank and is not insured or guaranteedby the Federal Deposit Insurance Corporation or any other government agency.9
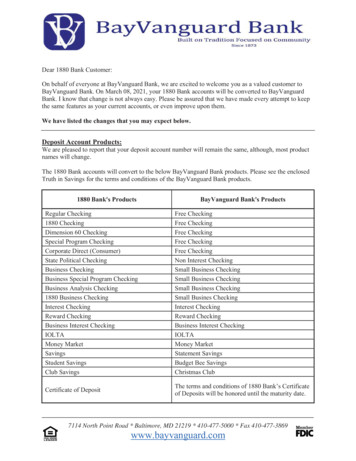
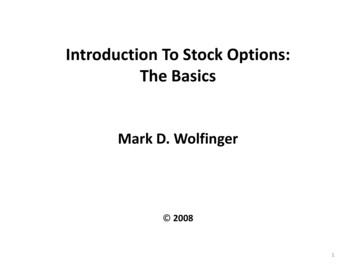
Annual Total ReturnsThe following bar chart and table are intended to help you understand the risks ofinvesting in the Fund. The bar chart shows how the performance of the Fund‘s ETFShares (based on NAV) has varied from one calendar year to another over the periodsshown. The table shows how the average annual total returns of the ETF Sharescompare with those of the Fund‘s target index and a comparative index, which haveinvestment characteristics similar to those of the Fund. Keep in mind that the Fund’spast performance (before and after taxes) does not indicate how the Fund will performin the future. Updated performance information is available on our website atvanguard.com/performance or by calling Vanguard toll-free at 800-662-7447.Annual Total Returns — Vanguard Extended Market Index Fund ETF 0097.55-3.26-38.60During the periods shown in the bar chart, the highest return for a calendar quarterwas 21.73% (quarter ended June 30, 2009), and the lowest return for a quarter was–26.54% (quarter ended December 31, 2008).10
Average Annual Total Returns for Periods Ended December 31, 20151 Year5 Years10 YearsVanguard Extended Market Index Fund ETF SharesBased on NAVReturn Before Taxes–3.26%10.45%7.80%Return After Taxes on Distributions–3.6410.097.48Return After Taxes on Distributions and Sale of Fund Shares–1.678.246.28–3.2610.457.81Standard & Poor's Completion Index–3.35%10.37%7.68%Spliced Dow Jones U.S. Completion Total Stock Market Index–3.4210.247.90Based on Market PriceReturn Before TaxesComparative Indexes(reflect no deduction for fees, expenses, or taxes)Actual after-tax returns depend on your tax situation and may differ from those shown inthe preceding table. When after-tax returns are calculated, it is assumed that theshareholder was in the highest individual federal marginal income tax bracket at the timeof each distribution of income or capital gains or upon redemption. State and localincome taxes are not reflected in the calculations. Please note that after-tax returns arenot relevant for a shareholder who holds fund shares in a tax-deferred account, such asan individual retirement account or a 401(k) plan. Also, figures captioned Return AfterTaxes on Distributions and Sale of Fund Shares may be higher than other figures for thesame period if a capital loss occurs upon redemption and results in an assumed taxdeduction for the shareholder.Investment AdvisorThe Vanguard Group, Inc. (Vanguard)Portfolio ManagersDonald M. Butler, CFA, Principal of Vanguard. He has managed the Fund since 1997(co-managed since 2016).Scott E. Geiger, Portfolio Manager at Vanguard. He has co-managed the Fund since 2016.11
Purchase and Sale of Fund SharesYou can buy and sell ETF Shares of the Fund through a brokerage firm. The price you payor receive for ETF Shares will be the prevailing market price, which may be more or lessthan the NAV of the shares. The brokerage firm may charge you a commission to executethe transaction. Unless imposed by your brokerage firm, there is no minimum dollaramount you must invest and no minimum number of shares you must buy. ETF Shares ofthe Fund cannot be directly purchased from or redeemed with the Fund, except bycertain authorized broker-dealers. These broker-dealers may purchase and redeem ETFShares only in large blocks (Creation Units) worth several million dollars, typically inexchange for baskets of securities. For this Fund, the number of ETF Shares in a CreationUnit is 200,000.Tax InformationThe Fund’s distributions may be taxable as ordina
an individual retirement account or a 401(k) plan. Also, figures captioned Return After . Transaction Fee on Purchases and Sales None through Vanguard (Broker fees vary) Transaction Fee on Re