Transcription
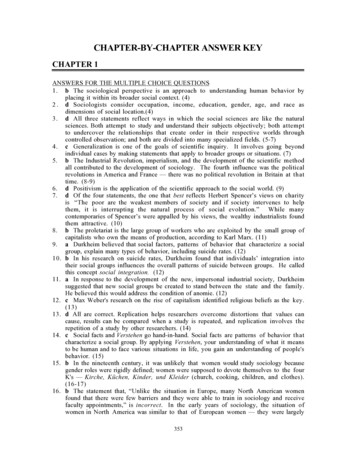
Chapter 1 – Burden: mortality, morbidity and risk factorsChapter 1Burden: mortality, morbidity and risk factorsThis chapter reviews the current burden and trends of NCDs and the risk factors. It also provides thelatest estimates on the number, rates and causes of global deaths from NCDs and the prevalence of themost important related risk factors. A description of the methods used to produce these estimates isprovided in Annex 1. Data are presented in two ways: according to the six WHO geographical regions1and by the four World Bank income groups.2 A listing of countries according to the WHO regions andWorld Bank income groups in 2008 is in Annex 2. Maps showing the global distribution of NCDrelated mortality and selected risk factors are presented in Annex 3, along with the individual countryestimates for NCD mortality and selected risk factors presented in Annex 4.MortalityA total of 57 million deaths occurred in the world during 2008; 36 million (63%) were due to NCDs,principally cardiovascular diseases, diabetes, cancer and chronic respiratory diseases (1). Nearly80% of these NCD deaths (29 million) occurred in low- and middle-income countries. NCDs arethe most frequent causes of death in most countries in the Americas, the Eastern Mediterranean,Europe, South-East Asia, and the Western Pacific. In the African Region, there are still moredeaths from infectious diseases than NCDs. Even there, however, the prevalence of NCDs isrising rapidly and is projected to cause almost three-quarters as many deaths as communicable,maternal, perinatal, and nutritional diseases by 2020, and to exceed them as the most commoncauses of death by 2030 (2).WHO projections show that NCDs will be responsible for a significantly increased total number of deathsin the next decade. NCD deaths are projected to increase by 15% globally between 2010 and 2020 (to44 million deaths). The greatest increases will be in the WHO regions of Africa, South-East Asia and theEastern Mediterranean, where they will increase by over 20%. In contrast, in the European Region, WHOestimates there will be no increase. In the African Region, NCDs will cause around 3.9 million deaths by2020. The regions that are projected to have the greatest total number of NCD deaths in 2020 are SouthEast Asia (10.4 million deaths) and the Western Pacific (12.3 million deaths) (2).NCD deaths areprojected toincrease by15% globallybetween 2010and 2020. Thegreatest increaseswill be in Africa,the EasternMediterranean,and South-EastAsia, where theywill increase byover 20%With the exception of the African Region, NCD mortality exceeds that of communicable, maternal,perinatal and nutritional conditions combined. For men in the European Region, deaths from NCDsare estimated to be 13 times higher than these other causes combined, and for men in the WesternPacific Region they are estimated to be eight times higher (Figure 1).In 2008, the overall NCD age-standardized death rates in low- and middle-income countries were 756per 100 000 for males and 565 per 100 000 for females – respectively 65% and 85% higher than formen and women in high-income countries. Age-standardized NCD mortality rates for all ages werehighest in the African Region for males (844 per 100 000) and for females (724 per 100 000).The leading causes of NCD deaths in 2008 were: cardiovascular diseases (17 million deaths, or 48%of NCD deaths); cancers (7.6 million, or 21% of NCD deaths); and respiratory diseases, includingasthma and chronic obstructive pulmonary disease (COPD), (4.2 million). Diabetes caused anadditional 1.3 million deaths.Over 80% of cardiovascular and diabetes deaths, and almost 90% of deaths from COPD, occurredin low- and middle-income countries. Behavioural risk factors, including tobacco use, physicalinactivity, and unhealthy diet, are responsible for about 80% of coronary heart disease and1The six WHO regions are the African Region, the Region of the Americas, the South-East Asia Region, the EuropeanRegion, the Eastern Mediterranean Region and the Western Pacific Region.2The World Bank income groups categorize nations according to average gross national income (GNI) per capita into lowincome, lower-middle-income, upper-middle-income and high-income countries. Income groups for the year 2008 wereused in this report.9
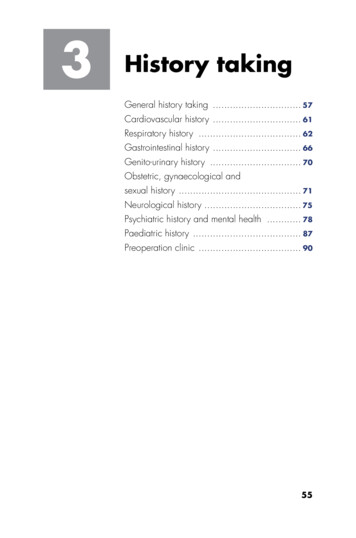
Chapter 1 – Burden: mortality, morbidity and risk factorsFigure 1. Total deaths by broad cause group, by WHO Region, World Bank income group and by sex, 20081816MalesFemalesTotal deaths w- Lower- Upper- Highincome middle- middle- incomeincome w- Lower- Upper- Highincome middle- middle- incomeincome incomeCommunicable, maternal, perinataland nutritional conditions(Note: AFR African Region, AMR Region of the Americas, EMR Eastern Mediterranean Region, EUR European Region, SEAR South-East AsiaRegion, WPR Western Pacific Region).cerebrovascular disease (3). These important behavioural risk factors of heart disease and stroke arediscussed in detail later in this chapter.In low- andmiddle-incomecountries, 29% ofNCD deaths occuramong peopleunder the age of60, comparedto 13% in highincome countriesMore than two thirds of all cancer deaths occur in low- and middle-income countries. Lung, breast,colorectal, stomach and liver cancers cause the majority of cancer deaths. In high-income countries,the leading causes of cancer deaths are lung cancer among men and breast cancer among women. Inlow- and middle-income countries cancer levels vary according to the prevailing underlying risks.In sub-Saharan Africa, for example, cervical cancer is the leading cause of cancer death amongwomen. Risk factors for cancer include the four shared behavioural factors (tobacco use, unhealthydiet, insufficient physical activity and the harmful use of alcohol), but infections such as hepatitisB, hepatitis C (liver cancer), human papillomavirus (HPV; cervical cancer) and Helicobacter pylori(stomach cancer) also cause up to 18% of cancer burden (4). In addition, cancers are also causedby radiation and a variety of environmental and occupational exposures of varying importance,depending on the specific geographical region and cancer site.Premature death is a major consideration when evaluating the impact of NCDs on a given population,with approximately 44% of all NCD deaths occurring before the age of 70. In low- and middleincome countries, a higher proportion (48%) of all NCD deaths are estimated to occur in peopleunder the age of 70, compared with high-income countries (26%). The difference is even moremarked for NCD deaths in younger age ranges: in low- and middle-income countries, 29% of NCDdeaths occur among people under the age of 60, compared to 13% in high-income countries.Figure 2 shows the proportion of NCD deaths (in 2008) among people under the age of 70, bycause. Cardiovascular diseases were responsible for the largest proportion of NCD deaths underthe age of 70 (39%), followed by cancers (27%). Chronic respiratory diseases, digestive diseases10
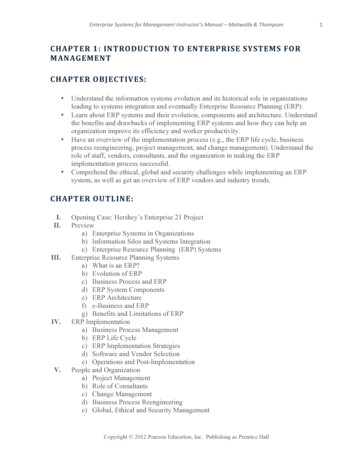
Chapter 1 – Burden: mortality, morbidity and risk factorsand other NCDs were together responsible forapproximately 30% of deaths, and diabetes wasresponsible for 4% (2).Population growth and improved longevity areleading to increasing numbers and proportions ofolder people, with population ageing emergingas a significant trend in many parts of the world.As populations age, annual NCD deaths areprojected to rise substantially, to 52 million in2030. Whereas annual infectious disease deathsare projected to decline by around 7 million overthe next 20 years, annual cardiovascular diseasemortality is projected to increase by 6 million,and annual cancer deaths by 4 million. In lowand middle-income countries, NCDs will beresponsible for three times as many disabilityadjusted life years (DALYs)3 and nearly fivetimes as many deaths as communicable diseases,maternal, perinatal and nutritional conditionscombined, by 2030 (2).Figure 2. Proportion of global NCD deaths under the age of 70, bycause of death, 2008CancersDiabetesCardiovascular diseaseDigestive diseasesChronic respiratorydiseasesOther noncommunicablediseasesMorbidityIn addition to information about NCD-related deaths, morbidity data are important for the managementof health-care systems and for planning and evaluation of health service delivery. However, reliabledata on NCD morbidity are unavailable in many countries. The most comprehensive morbidity dataavailable relate to cancer and are available from population- or hospital-based cancer registries.Such data are important since information on the incidence and types of cancer is required forplanning cancer control programmes. Only population-based cancer registries can provide anunbiased description of the cancer profile in a given population. Although disease registries fordiabetes, hypertension (raised blood pressure) and renal insufficiency exist in some countries, theseare generally only available for well-resourced settings, rather than entire populations. Data on theprevalence of diabetes and raised blood glucose are available from population-based surveys. Raisedblood pressure is discussed as a risk factor in the following section.CancerCancer is predicted to be an increasingly important cause of morbidity and mortality in the nextfew decades, in all regions of the world. The challenges of tackling cancer are enormous and –when combined with population ageing – increases in cancer prevalence are inevitable, regardless ofcurrent or future actions or levels of investment. The forecasted changes in population demographicsin the next two decades mean that even if current global cancer rates remain unchanged, the estimatedincidence of 12.7 million new cancer cases in 2008 (5) will rise to 21.4 million by 2030, with nearlytwo thirds of all cancer diagnoses occurring in low- and middle-income countries (6).Large variations in both cancer frequency and case fatality are observed, even in relation to themajor forms of cancer, in different regions of the world. Figure 3 presents the most frequent types ofcancer diagnosis (based on age-standardized rates) in each country, for men and women.The geographical variation in cancer distribution and patterns is mirrored on examination of cancermorbidity and mortality data in relation to the World Bank income groups of countries (Figure4). Within upper-middle-income and high-income countries, prostate and breast cancers are the3The disability-adjusted life year (DALY) is a measure of overall disease burden, expressed as the number of potentialproductive years lost due to premature ill-health, disability or early death.11
Chapter 1 – Burden: mortality, morbidity and risk factorsFigure 3. Most frequently diagnosed cancers worldwide, by country and sex, 2008Most frequently diagnosed cancers, MalesLip, oral cavityOesophagusStomachLarge bowelLiverLungKaposi sarcomaProstateBladderNot applicableData not availableMost frequently diagnosed cancers, FemalesLiverBreastCervix uteriThyroidNot applicableData not availablemost commonly diagnosed in males and females respectively, with lung and colorectal cancersrepresenting the next most common types in both sexes. These cancers also represent the mostfrequent types of cancer-related deaths in these countries although lung cancer is the most commoncause of cancer death in both sexes. Within low-income countries, the absolute burden of canceris much lower, and while lung and breast cancers remain among the most common diagnoses andtypes of cancer-related deaths, cancers of the cervix, stomach and liver are also among the leadingtypes – all of which are cancers with infection-related etiology.Middle-income countries are intermediate with respect to their patterns of cancer burden. Within thelower-middle-income countries, the three most common types of cancer are lung, stomach and livercancers in males, and breast, cervix and lung cancer in females, i.e. a similar pattern to the low-incomecountries (although liver, colorectal and oesophageal cancers are also of importance). The lowermiddle-income group contains some of the most populous countries in the world, including China andIndia, hence the absolute numbers of cancers and cancer-related deaths are notably high in this group.Future planning of service provision is an integral part of cancer control programmes. Consideringthe projected growth in cancer morbidity, important differences can be observed in relation to WorldBank income groups. The estimated percentage increase in cancer incidence by 2030 (comparedwith 2008) will be greater in low- (82%) and lower-middle-income countries (70%) compared withthe upper-middle- (58%) and high-income countries (40%). Without any changes in underlying risk12
Chapter 1 – Burden: mortality, morbidity and risk factorsFigure 4. Estimated annual number of new cases and deaths for the 10 most common cancers, by World Bankincome groups and by sex, tateLungColorectumBladderStomachKidneyNon-Hodgkin lymphomaMelanoma of n-Hodgkin lymphomaMelanoma of chCervix rectumLeukaemiaLip, oral tumLeukaemiaLip, oral cavityBreastCervix uteriLungStomachColorectumLiverCorpus uteriOesophagusLeukaemiaLip, oral cavityCervix -HodgkinLip, oral cavityLeukaemia01000New 003000DeathsFigure 5. Estimated annual number of new cancer cases 2008 and predicted 2030, by World Bank income groupsAnnual number of new cases e2008Upper-middle-incomeHigh-income203013
Chapter 1 – Burden: mortality, morbidity and risk factorsFigure 6. Age-standardized incidence of all cancers (excluding non-melanoma skin cancer), by type, per 100 000population for both sexes, by WHO Region, MREMRCervix uteri (women only)ColorectumEURSEARLungBreast (women only)WPROther cancersfactors (i.e. based only on anticipated demographic changes), between 10 and 11 million cancerswill be diagnosed annually in 2030 in the low- and lower-middle-income countries (Figure 5).The WHO Regions of Europe and the Americas had the highest incidence of all types of cancercombined for both sexes (Figure 6). Countries in the Eastern Mediterranean Region had the lowestincidence rates. Except in the African and South-East Asia Regions, men have higher overall ratesfor all types of cancer than women.Lung cancer rates among both sexes (combined) were highest in the Western Pacific Region,followed by Europe and the Americas. They were lowest in the African Region.Women in the African Region had the highest incidence of cancer of the cervix uteri, followed by thosein the South-East Asia Region. Women in the Eastern Mediterranean Region had the lowest cervicalcancer incidence. For breast cancer, women in the European Region had the highest rates followed bythe Region of the Americas. These latter rates were more than double those of the other WHO regions.Men in the Region of the Americas had the highest rates of prostate cancer, followed by the EuropeanRegion. The lowest rate of prostate cancer was in the South-East Asia Region.Among the WHO regions, the countries in the Western Pacific Region had by far the highestincidence of stomach cancer and liver cancer. The lowest incidence of stomach cancer was in theAfrican Region. Men in the Western Pacific Region had five times the rate of liver cancer of menin all other regions, except for the African Region (where it remained more than double the rate).Women in the Western Pacific Region also had a considerably higher liver cancer incidence rate thanwomen in other regions.14
Chapter 1 – Burden: mortality, morbidity and risk factorsFigure 7. Age-standardized incidence rates of all cancer (excluding non-melanoma skin cancer), by type of cancer,per 100 000 population for both sexes, by World Bank income groups, tomachLower-middle-incomeCervix uteri (women only)ColorectumUpper-middle-incomeLungBreast (women only)High-incomeOther cancersThe European Region had the highest incidence of colorectal cancer followed by the Region of theAmericas, while the African Region had the lowest reported incidence.According to the World Bank income groups, the cancer rates for all cancers combined (excludingnon-melanoma skin cancers) rose with increasing levels of country income (Figure 7). High-incomecountries had more than double the rate of all cancers combined of low-income countries. In allcountries, other than those in the low-income category, men have considerably higher combinedrates of all types of cancer than women. The exception of low-income countries is most likelyexplained by the high rates of cervical cancer among women in the African Region.High-income countries had more than double the lung cancer incidence of low-income countries. Highincome countries had approximately 10 times the rate of prostate cancer than lower-middle-incomecountries. For breast cancer, incidence rates rose rapidly in accordance with level of country income, withhigh-income countries demonstrating more than three times the rate of low-income countries. Similarly,colorectal cancer incidence also rose in parallel with the level of country income. Conversely, highincome countries had considerably lower cervical cancer incidence rates than low- and middle-incomecountries. Finally, low- and lower-middle income countries also had the highest rates of liver cancer.DiabetesImpaired glucose tolerance and impaired fasting glycaemia are risk categories for future developmentof diabetes and cardiovascular disease (7). In some age groups, people with diabetes have a two-foldincrease in the risk of stroke (8). Diabetes is the leading cause of renal failure in many populationsin both developed and developing countries. Lower limb amputations are at least 10 times morecommon in people with diabetes than in non-diabetic individuals in developed countries; more than15
Chapter 1 – Burden: mortality, morbidity and risk factorsFigure 8. Age-standardized prevalence of diabetes in adults aged 25 years, by WHO Region and World Bankincome group, comparable estimates, 2008% of th sexeshalf of all non-traumatic lower limb amputations are due to diabetes (9). Diabetes is one of theleading causes of visual impairment and blindness in developed countries (10). People with diabetesrequire at least two to three times the health-care resources compared to people who do not havediabetes, and diabetes care may account for up to 15% of national health care budgets (11). Inaddition, the risk of tuberculosis is three times higher among people with diabetes (12).The apparent prevalence of hyperglycaemia depends on the diagnostic criteria used in epidemiologicalsurveys. 4 The global prevalence of diabetes in 2008 was estimated to be 10% in adults aged 25 years. The prevalence of diabetes was highest in the Eastern Mediterranean Region and the Regionof the Americas (11% for both sexes) and lowest in the WHO European and Western Pacific Regions(9% for both sexes) (Figure 8). The magnitude of diabetes and other abnormalities of glucosetolerance are considerably higher than the above estimates if the categories of ‘impaired fasting’ and‘impaired glucose tolerance’ are also included.The estimated prevalence of diabetes was relatively consistent across the income
between 2010 and 2020. The greatest increases will be in Africa, the Eastern Mediterranean, and South-East Asia, where they will increase by over 20%. Chapter 1 – Burden: mortality, morbidity and risk factors 10 cerebrovascular disease (3). These important