Transcription
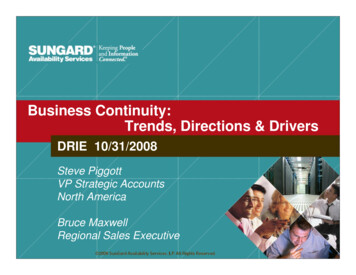
Business Continuity:Trends, Directions & DriversDRIE 10/31/2008Steve PiggottVP Strategic AccountsNorth AmericaBruce MaxwellRegional Sales Executive
Theme For Discussion Introductions Market Drivers, Trends & Directions Restorable, Recoverable, Available? Internal, Commercial or Hybrid? Program Road Map Alternatives Optimal Spend / Call To Action
About SunGard Leading provider of software and IT servicesfor financial services, higher education and public sector Leading provider of information availability services 25,000 customers in 50 countries 16,000 employees 4 billion in revenue Fortune 500, privately heldSunGard went private in 2005 as aresult of an LBO valued at 11.5 bn.SunGard was founded in 1983 through theLBO of a division of Sun Oil Company.SunGard went public in an IPO in 1986.Since 1986 SunGard has completed morethan 150 acquisitions.Investors include Silver Lake Partners,Bain Capital, Blackstone Group,Goldman Sachs Capital Partners, KKR,Providence Equity and Texas PacificGroup.
SunGard Availability Services Market Leadership and Growth Significant customer base and solution mix Over 25 years experience and more than 8,000 clients worldwideincluding 70 of the Fortune 100 Over 3,000 Managed Services & Hosting customers Two Acquisitions in 2008 (Strohl and Vericenter) We do business where you do business 60 facilities world wide A nationwide network of SAS 70 Type II managed data centers International presence with significant North American footprint Experience ‘Break & build’ data center environments every day 2300 successful customer recoveries Creative, flexible, & vendor independent Financially Robust 1.6B Service Provider [ 5B total SunGard] Financial stability of a Fortune 500 company
What is Information Availability?ALWAYS ON NO DOWNTIME NO DELAYS Uninterrupted communications– Application services help ensure availability of mission-critical data– 24/7system availability and YS AVAILABLE 2 MINUTES 2 HOURS Minimal downtime and accelerated restarts– Keep backup data or equipment at a SunGard facility– Operations seamlessly transferred to a SunGard facility and back toyour facility via dedicated networkALWAYS READY 1 DAY 2 DAYS Quickly relocate and restart Bring backup data and people to SunGard for real-time access todatabases and automatic call distribution systems Back up and running as quickly as possible
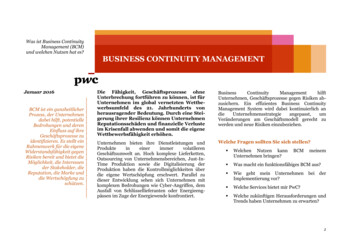
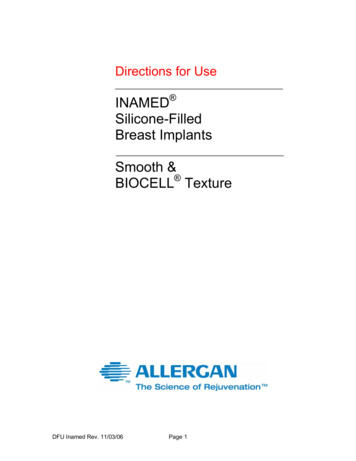
North American FacilitiesCalgaryQuebec CitySeattleMontrealMinneapolisPortlandToronto (3)St. Paul (2)DetroitNorthbrookBostonCarlstadt (3)Wood Dale (2)IndianapolisThorntonDenverAuroraEnglewoodSan RamonClevelandPittsburgh*Marlborough (2)QueensWarminster*PhiladelphiaHerndonSt. Louis (2)NashvilleHuntersvilleCharlotte/Raleigh (2)ScottsdaleAtlanta (2) & AlpharettaSmyrnaCypressPhoenixSan DiegoLas ColinasGrand PrairieDallasManaged IT Services,Recovery & WorkgroupRecovery & WorkgroupAustin*Honolulu, HIFacility TypesHouston (3)OrlandoManaged IT ServicesWorkgroup*[process center]Metepec, MX
International ReachUNITED KINGDOM BristolCoventryCrawleyDundeeElland oleStockportThealeWarringtonDENMARK CopenhagenFRANCE Lognes ParisBELGIUM BrusselsLUXEMBOURG LuxembrourgNORWAY OsloSWEDEN StockholmLONDON DocklandsRecovery Campus London TechnologyCentre (LTC) City RecoveryCampus South BankRecovery Campus
SunGard Global Network BackboneChicago MetroDWDMInfrastructureScaleNetU.K. es ndianapolisKansas ashington DCSt. LouisRichmondSan FranciscoCharlotteNashvilleAtlanta nSan nvilleNew OrleansHoustonOrlandoWest PalmMiamiMetepec, MXSan Juan
Drivers, Trends & Directions
What Are IT Top-of-Mind Issues?
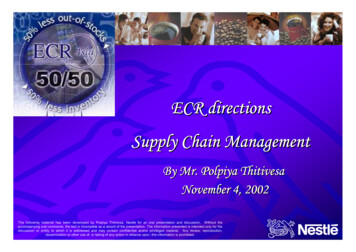
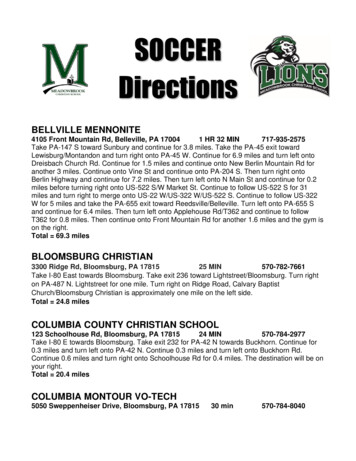
StorcanePeoplesesocPrUnauthorizedAccessT BDPrGo oximitvt.Bld yg.rrsosLaPower FailureFacility FireUti litGa iesLe s akkortw eNe utagOorismeplackrWo lenceVioTechnologyAssetImpactInfo. SecurityBreachTetDasielitciFaTB DDTBoadIcernakePandemicquEarthToHurrimRisk Wheel
Today’s Business Requirements Are DifferentHistorically: Fires Hurricanes Tornadoes Earthquakes Floods Power failureCharacteristics:Statistically predictable,quantifiable, insurable,well-understoodToday: Cybercrime and denial of service Terrorist targets of opportunity Wireless devices Trading partner connectivity Public infrastructure concerns(telcos, airlines, globalization) Protection of human capital The Truth: Current CapabilityCharacteristics:Intentional, difficult to quantify,ambiguous boundaries, trustdimensions
Realization: Serious Disconnect in HowMany Organizations Plan for ‘Disasters’Catastrophic Disasters Widespread and welldocumenteddestruction 90% of BusinessContinuity budgets Some chance ofoccurring Stakeholdersunderstand and willhave compassion inthese situationsService Interruptions Malicious events, Viruses, HumanError Millions of dollars of quantifiable losses Infrastructure Failure 50% of outages are hardware orpower related Perception is reality:Outage Failure to anticipate Stakeholders will not tolerate anoutage associated with this type ofevent Regulatory Agencies have littletolerance to unexplained compliancefailures
Business Drivers Focusing on driving down costs to maximize ROI Streamlining Service Delivery across IT and Business Processes Shifting Toward Centralizing IT Infrastructures & Shared Services Execution of a Comprehensive Roadmap for an Optimal SourcingStrategy Adopting Alternative Service Delivery Models Rationalizing and Managing Application Portfolios
Market Drivers and Trends Recovery Time Objectives (RTO) and Recovery PointObjectives (RPO) are shrinking Increased pressures to develop a cost-effective yet highly performingBCDR solutions (across all verticals) Select sourcing replaces “traditional” takeoveroutsourcing Emphasis on lower costs and time invested in supporting BCDRstrategy De-emphasis on “Desire For Control” Higher willingness to use third party vendors as a part of co-sourcing Market Statistics: 79% of current tape based recovery clients prefer an AdvancedRecovery that includes vaulting or replication to a secondary location 54% prefer that the vaulting or replication solution is managed by theprovider
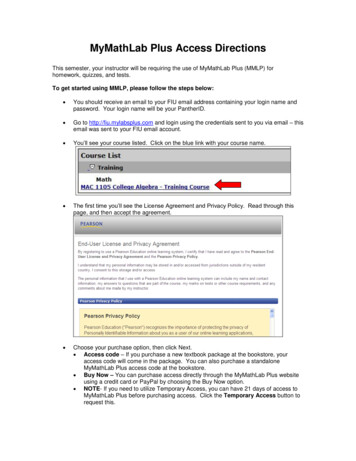
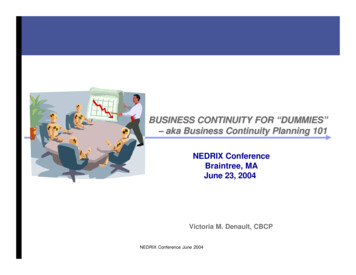
Recovery Time Objectives (RTOs) forMission-Critical Functions by ESALELOCAL/STATE/REGIONAL GOVTFEDERAL GOVTHEALTHCARE PROVIDERFINANCIAL 0%10%Less than 4 hours20%4 to 12 hours30%40%13 to 24 hours50%60%25 to 72 hours70%80%More than 72 hours90%100%
Market Drivers and Trends Clients expect high levels of involvement from their 3rdparty provider Management of Operating Systems, Applications, andsupporting infrastructure for Production environments Provider executes test and recovery validation Prevalent Datacenter challenges Power and cooling costs continue to rise Increasing need for flexibility and automation in servermanagement Rising needs for on-demand capacity for testing anddevelopment environments
Market Drivers and Trends Server & Data Center Consolidation Traditionally for lower TCO, better control and increasedflexibility Increased ROI through multi-purpose use of existinginfrastructure and virtualization strategies Consolidation strategies leverage expanded productioncapabilities for DR (vendor or internal) Implementation of virtualization technologies for DRenable customers to recover faster, utilize hardware moreefficiently and overcome hardware disparities in theHotsite 44% of all clients have implemented a form ofvirtualization 26% of all clients will implement a form of virtualizationover the next 12-18 months
So, What Are Your Peers Doing? Focused on Architectural Availability vs Restoration Augmenting Internal Skills With Subject MatterExpertise Leveraging partners for intellectual capital,experience and managed services Designing Services, Processes & Applications WithContinuity Criteria Built in (ROI) Designing Scalable, Tiered, Hybrid RecoverabilitySolutions Utilizing Internal & Hybrid Alternate Sites for TieredRecoverability
Restorable, Recoverable or Available?
Restorable, Recoverable or Available?Recovery Point Achievable (RPA)Crisis afetyLife/Safety- NotificationsNotificationsLast ionDeclarationVital RecordsFailover System / Application / taFailover NetworkVoiceVoice/ tand-up Business rocessProcessProcessBacklogBacklogRecreate Lost Transactions and Newly Stockpiled rationRecovery Time Achievable ome
Tiered Recovery SpectrumTraditional DisasterRecoveryTraditionalDisaster rsDaysDisaster ToleranceWeeks
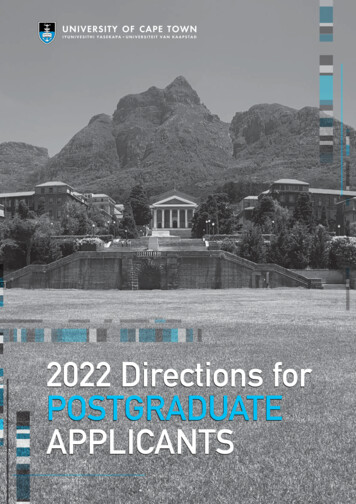
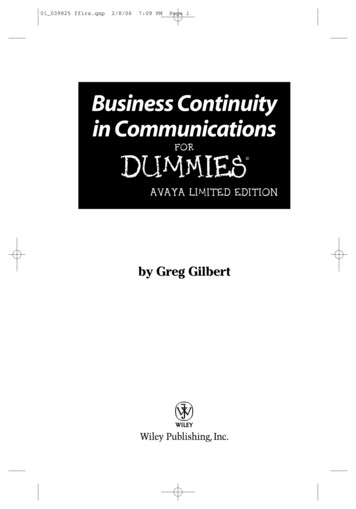
Recovery Time GuidelinesSupporting TechnologyRTO/RPODedicated/Managed:dedicated equipment,data replicationRTO/RPOAdvanced Recovery:dedicated and shared equipmentwith data replication24- 48 hrsRTO/RPOAdvanced Tape Recovery:restore ATOT/ATOD with advancedtape recovery resources48-72 hrsRTOTraditional Recovery:Restore from tape ATOT/ATOD0 - 12 hrs12- 24 hrsFinancial ImpactsAndRecovery CostsRTO/RPO
Availability Options ComparisonTransactionsNot toreTransactionRecreation7 DaysCurrentConcurrent Business RecoveryDataReplication-3 DaysConcurrent Business RecoveryDataReplication &ManagedServices-24 -12-1 DaysConcurrent Business Recovery01224364860728496 108 120 132 144 156 168 180 192 204 216 228 240 252 264 276 288 300 312 324 336 348 36024
Internal, Commercial or Hybrid?
Discussion Points Opportunity Control Perceived ROI thru merger, acquisition and/or consolidation Business need Dependence on access to information Reduced recovery points & times Customer & Supplier satisfaction, SLA’s, legal & regulatory compliance Security: Minimize risks & exposures Technology drivers Growth of disparate technologies Growth of aggregate data/storage requirements (inability to restore fromtape) Complexity of integrated processes, applications and inter-dependencies Improving total cost/performance: TCO equation requires factual answers Simpler to implement high-availability solutions, facilitating scalability &testability Internal drivers Politics/Control Resource sharing potential (staff & environments) Focus on core business: Are core competencies being effectivelyleveraged?
Discussion Points Most organizations have 50% or more of the equipment needed tofacilitate a high-availability architecture: The challenge is to find the solution provider capable of enabling the repurposing of the infrastructure in a reasonable amount of time with integrity High Availability is less disruptive on your staff and more easily tested: Resiliency and availability is a “posture” Restorability is an audit check list item One size does not fit all: Services providers must offer you a continuum of services to meet differentrecovery needs (tiers) for each business function Service Providers that don’t operate “living, breathing” Data Centers cannot be expected to improve your “posture”
Road Map Alternatives
Road Map: Desired OutcomesProvide optimal spend alternatives for enhanced resiliency & recoverability Restorable, recoverable or available today? Structured discovery of Tier One architecture & inter-dependencies Validate requirements for Tier One processes are resilient/recoverabletoday from a business process perspective Validation of system & applications interdependencies Consensus on the environmental requirements for Tier One General Categorization of Tier 2-4 requirements & solutions sets Conclusions & recommendations on roadmap alternatives with costestimates
Develop A Programmatic Approach
Optimal Spend / Call To Action
What Our Customers Are Talking About:LowerCosts Leverage Hostingeconomies of scale Infrastructure is acommodity Optimal SpendSolutionsTechnologyEvolution IT Infrastructure Virtualization Tiered Recoverability,not point solutionsReliabilityFlexibility& Service InformationAvailability ProfessionalServicesProgrammaticApproach Security Service LevelAgreementScalability Infrastructure“on demand” Diverse solution portfolio Ability to addressrampant growth Customization Betteralternative to“Corporate IT” Treated like acustomer
Call To Action: Execute Your Game Plan Establish multi-faceted dialog now to share experience andintellectual capital Establish executable baseline capabilities & constraints to quantify& qualify current & evolving risk profile (compliment ongoingactivities) Determine optimal spend (internal, hybrid, commercial) Collaborate, develop and execute on agreed to initiatives andtimeframes Become better prepared for your next ‘event’
Our Role Has Evolved .CEOCOOCFOCIOCCOCAOChief AvailabilityOfficerSUNGARD
Business Continuity: Trends, Directions & Drivers DRIE 10/31/2008 Steve Piggott VP Strategic Accounts North America Bruce Maxwell . Program Road Map Alternatives Optimal Spend / Call To Action. About SunGard SunGard was founded in 1983 through the LBO of a division of Sun Oil Company. SunGard went public i