Transcription
The Oscilloscope and the Function Generator:Some introductory exercisesfor students in the advanced labsIntroductionSo many of the experiments in the advanced labs make use of oscilloscopes and function generatorsthat it is useful to learn their general operation. Function generators are signal sources whichprovide a specifiable voltage applied over a specifiable time, such as a “sine wave” or “triangle wave”signal. These signals are used to control other apparatus to, for example, vary a magnetic field(superconductivity and NMR experiments) send a radioactive source back and forth (Mössbauereffect experiment), or act as a timing signal, i.e., “clock” (phase-sensitive detection experiment).Oscilloscopes are a type of signal analyzer—they show the experimenter a picture of the signal,usually in the form of a voltage versus time graph. The user can then study this picture to learnthe amplitude, frequency, and overall shape of the signal which may depend on the physics beingexplored in the experiment.Both function generators and oscilloscopes are highly sophisticated and technologically maturedevices. The oldest forms of them date back to the beginnings of electronic engineering, and theirmodern descendants are often digitally based, multifunction devices costing thousands of dollars.This collection of exercises is intended to get you started on some of the basics of operating ’scopesand generators, but it takes a good deal of experience to learn how to operate them well and takefull advantage of their capabilities.Function generator basicsFunction generators, whether the old analog type or the newer digital type, have a few commonfeatures: A way to select a waveform type: sine, square, and triangle are most common, but some willgive ramps, pulses, “noise”, or allow you to program a particular arbitrary shape. A way to select the waveform frequency. Typical frequency ranges are from 0.01 Hz to 10 MHz. A way to select the waveform amplitude. At least two outputs. The “main” output, which is where you find the desired waveform,typically has a maximum voltage of 20 volts peak-to-peak, or 10 volts range. The mostcommon output impedance of the main output is 50 ohms, although lower output impedancescan sometimes be found. A second output, sometimes called “sync”, “aux” or “TTL” producesa square wave with standard 0 and 5 volt digital signal levels. It is used for synchronizinganother device (such as an oscilloscope) to the possibly variable main output signal.A wide variety of other features are available on most modern function generators, such as “frequency sweep”—the ability to automatically vary the frequency between a minimum and maximum value, “DC offset”—a knob that adds a specified amount of DC voltage to the time-varying1
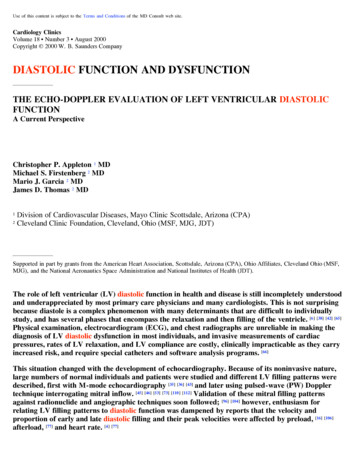
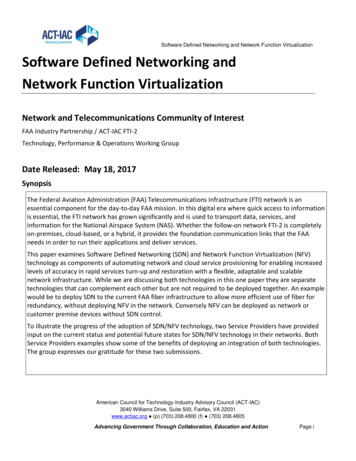
waveform, and extra inputs or outputs that can be used to control these extra features by otherinstruments.Oscilloscope basicsAll oscilloscopes share certain basic features. Refer to Fig. 1 to see where typical controls may befound. The most recognizable feature: a screen. On older analog scopes this is a cathode-ray tube orCRT; the signal creates a moving dot or “trace” across the screen. On newer digital scopesthe screen is a CRT or flat-panel display that operates like a computer monitor. The basicuse of the screen is to display the signals in a voltage versus time graph. The screen usuallyhas a graticule on it of about 1 cm squares. At least two (maybe more) signal inputs, or “channels”, typically called “CH1”, “CH2”, etc.,and one external “trigger” input, typically called “EXT TRIG”. A collection of controls related to vertical part of the display associated with the input signals.These control the kind of coupling to the input: direct—“DC”, through a capacitor—“AC”,or disconnected—“GND”. The amount of amplification applied to the signal is controlled bya knob, and is specified in terms of screen units: a “10mV/div” setting means that a 10millivolt change in the input signal will move the trace vertically by one major division. A collection of controls related to the horizontal part of the display. These controls set thetime axis and are calibrated in seconds per division, e.g., 1µs/div means that one majordivision corresponds to 1 microsecond. The horizontal controls are sometimes called the“timebase” and the setting is called the “sweep rate”. A collection of controls called the “trigger” that are used to synchronize the input signal tothe horizontal display. Because there is no fixed relationship between an external signal andthe internal timebase, the trigger makes the scope wait until some prescribed level in an inputis reached before beginning its display. Triggering controls are discussed in more detail onpage 6.In addition to the above features which are common to both analog and digital varieties, digitaloscilloscopes typically come with the ability to save data and control settings to memory, performmathematical operations on data traces, average many cycles together to reduce the effect of randomfluctuations, and carry out automatic measurements of frequency and amplitude of the input signals.One can also make printouts of the display screen to keep a paper record of the measurement. Thebasic and advanced features of oscilloscopes will be explored in the following exercises.2
Figure 1: Front panel layouts of the digital scope (top) and the analog scope (bottom).3
Getting startedIn this exercise you will look at the types of signals available from a generator and explore the basiccontrols of the generator and digital oscilloscope. First check to see that you have the followingequipment at your station: One digital oscilloscope. You may have one of the following, all made by Tektronix: TDS320,TDS340, TDS360, TDS620B or TDS3012. One analog oscilloscope. These are Tektronix models 2213A, 2215A, or 2235. Two function generators. Analog types are made by Krohn-Hite, Wavetek, or Exact and areidentifiable by their prominent frequency-adjust knob and fairly simple panel controls. Digitaltypes are made by Wavetek and Stanford Research Systems (SRS) and are identifiable by thedigital display and large number of panel buttons. An oscilloscope probe. A scope probe is not just a wire with a clip, but it has other circuitryin it to modify the signal before it passes to the scope input. In most of the advanced labexperiments, the scope is wired into the setup using BNC cables, so you won’t use a probein these cases, but it is standard equipment when using a scope to study the internals of acircuit. A box of small parts, which should have a small screwdriver (possibly made of plastic), a fewresistors, a capacitor, some wires and some BNC adaptors. A plug-in circuit board (“breadboard”) that can be used to wire up test circuits. BNC cables. You will need a few of these. There are a variety of lengths available on racksattached to the back side of the mobile whiteboard.Let’s get started by looking at some function generator signals.1. Turn on a function generator. The digital ones will take a few seconds to complete internaltests, but the analog ones will be ready right away.2. Turn on the digital oscilloscope. After the scope completes its internal tests, press the “Clearmenu” button at the lower right hand corner of the display screen.3. Get a couple of BNC cables from the cable rack; six-foot lengths should be adequate. Use theBNC cables to connect the “main” output of the generator to CH1 of the oscilloscope andthe “aux” (or “sync” or “TTL”) output to CH2.4. Set the controls of the function generator to produce a sine wave of about 1000 Hz frequencyand a few volts amplitude. Depending on your generator, here’s how:ANALOG (Krohn-Hite, Wavetek, Exact) Use the “waveform” or “function” switch to select thesine (curvy-line) waveform type. Use the frequency adjust knob and multiplier button/switchto select the frequency, and then set the amplitude knob (“Ampl” or “Attenuator”) at about12 o’clock, with any attenuator switches set at 0dB.DIGITAL (SRS DS345) Use the 4, 5 buttons under the FUNCTION menu to highlightthe sine function symbol. Press the FREQ button, and then key in “1” followed by the4
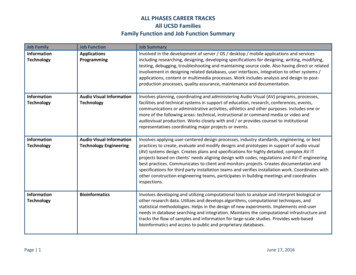
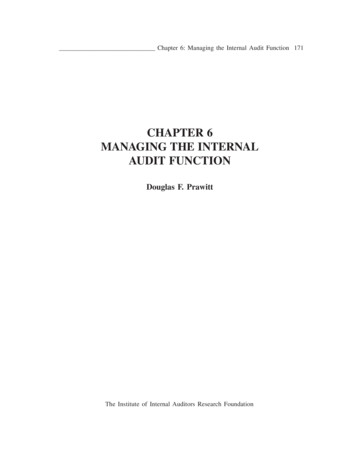
Figure 2: Digital scope display of a 1 kHz sine wave from a function generator and its associated“sync” signal. Note these important features: the channel 0-volt markers (“1 ” and “2 ”); thetrigger indicators: the “T” in the middle of the screen and the small arrow on the right; the channelsensitivities (volts/div), sweep time (sec/div) and trigger settings are shown along the bottom ofscreen: channel 1 (“Ch1 1V”) is showing a 2 volt peak-to-peak sine wave, and channel 2 (“Ch2 5V”)is showing a 0 to 5 volt square wave. The sweep time is 500 µs/div (“M 500µs”), and the triggeris set for a 20 mV positive-going level in channel 1.“kHz/Vrms” units button. To set the amplitude, press the AMPL button followed by “2”and the “kHz/Vrms” units button.DIGITAL (Wavetek 29) Select the “Sine” option under the FUNCTION menu. PressFREQ/PER under the SET menu, followed by “1” and the “kHz us mV” units button.Set the amplitude by pressing AMPL followed by “2” and “MHz ns V”. IMPORTANT:the Wavetek 29 will not activate its main output until you press the OUTPUT button at thelower right, above the MAIN OUT connector.5. In order to start from a uniform setting, reset the oscilloscope to its factory default valuesby pressing the SAVE/RECALL button, and then using the softkeys to choose the “factorydefault” setup. Then press the CH1 and CH2 buttons to turn on both of these channels.Finally, press AUTOSET on the oscilloscope panel. Autoset tell the scope to examine theinputs and choose a best guess at reasonable input gain and timebase settings. You shouldsee a display similar to that shown in Fig. 2. If you don’t get this, ask for help now.Oscilloscope vertical, horizontal and trigger controlsNow that you have a signal, explore the effects of the various scope controls. Refer to Fig. 1 tohelp you locate the controls on your scope.Vertical1. Press the CH1 button and see what happens when you turn the POSITION and VOLTS/DIVknobs. Pay attention to both the changes in the displayed waveform and the text indicators5
at the bottom of the screen. You should be able to deduce the meaning of these indicators.2. Press the CH2 button and repeat the above step.3. You can turn a waveform off by first pressing the channel selector button (turning the adjacentgreen LED on), followed by the WAVEFORM OFF button. Try this, and turn off and thenon the waveforms from channel 1 and channel 2.4. Press the VERTICAL MENU button and study the various options that are controllable bythe softkeys.Horizontal1. Adjust the POSITION and SEC/DIV knobs and see what happens. Notice that both thesample rate and the sweep rate depend on the setting of the SEC/DIV knob. (The sample rateis the rate at which the waveform is digitized, and it must be notably higher than the sweeprate for the trace to be accurately drawn.) Also notice how the bar indicator and triggerposition indicator at the top of the screen changes as you move the POSITION knob: the barrepresents the scope’s memory, and the region between the square brackets [ ] representsthe amount of the memory shown on the screen. In the TDS300 series, the screen alwayslooks at a portion of the scope’s total memory; in the TDS600 series, the amount of memoryvisible on the screen is adjustable (as an option under the HORIZONTAL MENU); in theTDS3000 series, the screen always looks at all of the scope’s memory, but you can zoom inon a small part of it with the “magnify” option (under the button with the magnifying glasssymbol).2. (TDS300 and TDS600 series only) Press the HORIZONTAL MENU button and study thevarious options. Note in particular the presets for the trigger location on the screen. Otheroptions are used less frequently, so you can ignore them for now.TriggerThe purpose of a trigger is to synchronize the scope’s measurement cycle with an input signal.You can think of triggering as analogous to the following example. Imagine that you want tomeasure the time duration that a runner takes to run the first 100 meters on an 800 meter trackwhile she runs laps. You would first position yourself so that you could see the runner approacha specific marker and then start your timer as she passed it. After timing the 100-meter stretch,you would wait until the runner made a full lap and returned to the marker again before timing itagain. Because the events you are measuring (100-meter time duration over successive laps) takea different amount of time than the duration of a full lap, and may start at different time pointsfrom lap to lap, you need to wait for a part of each lap for the runner to reach the marker beforestarting your timer. The oscilloscope trigger works in a similar way: the scope waits until the inputwaveform reaches a particular level or produces a particular pattern before starting its “trace” ormeasurement cycle. Subsequent traces occur after waiting until the level/pattern repeats.The operation of the oscilloscope trigger is the most difficult skill for the novice to learn. Beforewe look at the trigger controls, let’s review some terms associated with triggering.Trace Jargon term for the visible part of a scope’s measurement cycle. The term originates fromthe older analog scopes in which a moving bright dot is created on a CRT screen by an electron6
beam deflected under the influence of the vertical and horizontal amplifiers. In digital scopesthe trace is the visual display of the scope’s data memory. In general, a proper trigger mustoccur before a trace is created or updated.Trigger Level The voltage that a trigger signal must cross before the trace will start.Slope The trigger level coupled with the “slope” defines the pattern that must be sensed by thetrigger circuit before it will start the trace. A “positive slope” means that the trigger levelmust be crossed going from a lower to a higher voltage, i.e., “going up”; likewise a “negativeslope” means that the trigger level must be crossed going from a higher to a lower voltage:“going down”.Source The signal from which the trigger circuit takes its input. If the trigger comes from one ofthe channel inputs (CH1 or CH2), the source is “internal” or INT. This is the most commonchoice. The second most common choice is from a separate signal connected to a specialtrigger input, called EXT TRIG (or just EXT). The other choices are from the 60Hz powerline signal (LINE) or from an oscillator internal to the scope (AUTO).Mode Refers to additional conditions under which a trace is triggered. The two basic modes are“normal” (NORM) and “automatic” (AUTO). Under the normal triggering mode, no tracewill be made until the triggering condition is met. Under automatic triggering, the scopelooks for a valid triggering condition within a certain time, but if none is found, it will triggeranyway. Automatic triggering is useful when you are looking for a signal that you do notknow much about—you may see some movement in the trace but it won’t be stable. Normaltriggering gives you more control over when a trace happens, and is the best mode to usewhen you know that a usable trigger signal exists. With analog scopes the screen will beblank under normal triggering unless a valid trigger occurs; with digital scopes the screen willfreeze the last trace recorded.Coupling DC coupling means that the trigger signal is passed to the trigger circuit unchanged.AC coupling means that any constant or very slowly varying voltage is blocked from thetrigger circuit. Some scopes also have coupling options for low-frequency or high-frequencyrejection in order to reduce the effects of noise that may be present in those frequency ranges.Holdoff A time period following a trigger event where subsequent triggers are blocked. The holdoffcontrol can help stabilize traces when looking at more complex waveforms that have manypossible trigger points.Delay A waiting time between trigger event and the start of a trace. Trigger delay is used whenyou want to look at a part of a signal that happens well after the desired trigger point.Pretrigger The time before the trigger event. Digital scopes can show a fairly long pretriggerperiod. You can use this period to see the signal leading up to the trigger condition. Analogscopes have a very short pretrigger period.Most of the time you need only worry about four settings: the trigger level, the slope, the modeand the source. Let’s see how these work.1. Press AUTOSET again to reestablish the settings so that the traces are similar to Fig. 2.2. Press the TRIGGER MENU button.7
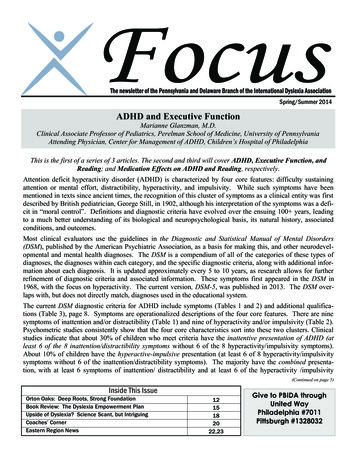
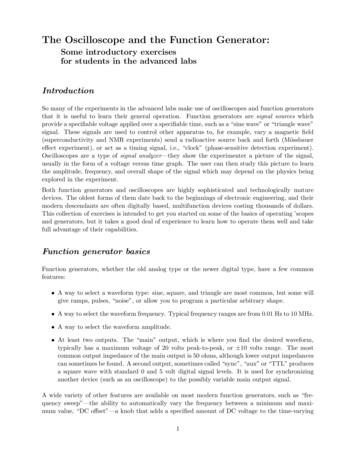
Figure 3: Digital scope measurements of a triangle wave.3. Look at the softkey selections along the bottom of the display, select the “Level” menu, andturn the LEVEL knob. The source for the trigger should be CH1. Note what happens on thescreen. In particular, note how the sine wave shifts horizontally as you change the level.4. Select the “Slope” menu, and note how the waveform changes when you switch betweenthe positive and negative slope settings (from the softkeys on the side of the display). Payattention to the shape of the waveform right at the “T” marker.5. Select the “Mode” menu, and make sure the mode is set to “Auto (Untriggered Roll)”. Turnthe LEVEL knob clockwise until the arrow marker denoting the trigger level is well abovethe sine wave. You should see the trace lose stability and drift horizontally. Now switch themode to “Normal”. The trace should freeze. When you adjust the level back down, the tracewill become active again once the scope senses a valid trigger.6. Select the “Source” menu, and select “Ch 2”. Notice how the trigger markers change to thesecond trace. Now disconnect the sync signal going into CH2 and plug it into the EXT TRIGinput. You should lose triggering first, but recover it when you select “Ext” from the sourcemenu.Exercise 1: Making measurements with a scopeNow that we have reviewed the basics, you should be able to make the following setup: Use thegenerator to create a 2100 Hz triangle wave of approximately 2.4 volts peak-to-peak amplitude.Feed this signal into CH1 of the digital scope and get a stable trace showing this signal. Youshould see something similar to Fig. 3. When you make this setup, think about what kind oftrigger settings you need to make a stable trace.Now, measure the amplitude and frequency of this signal by three different methods: Use the graticule. This method works with any oscilloscope. Compare your waveformto the markings on the screen and use them along with the horizontal and vertical settings8
to calculate the amplitude and frequency. For example, in Fig. 3 the vertical peak-to-peakextent of the waveform is a little less than 5 large divisions (more accurately, about 4.9large divisions), and the vertical sensitivity is 500mV/div, so the peak-to-peak amplitude is4.9 500mV 2.45V. The horizontal extent corresponding to one full period is a bit lessthan 4.8 large divisions, and the sweep rate is 100µs/div, so the period is 4.8 100µs 480µs,which gives a frequency of 1/(480 10 6 s) 2080 Hz. Use the cursors. The digital scopes (and some advanced analog scopes) have cursor markersthat can be used to ease the challenge of converting graticule distances to time and voltageunits. To access the cursors on our digital scopes, press the CURSOR button near theupper right of the front panel. Notice that you can select either “H bars” (horizontal bars:voltage only), “V bars” (vertical bars: time only) or “Paired” (both time and voltage). Thecursor positions are controlled by the unmarked “General Purpose Knob” that is linked tothe TOGGLE button; see Fig. 1 to help you locate it. Choose one of the cursor options, andsee what happens when you turn the General Purpose Knob and press the TOGGLE button.Notice also the appearance of the and @ symbols at the right side of the scree
Oscilloscopes are a type of signal analyzer they show the experimenter a picture of the signal, usually in the form of a voltage versus time graph. The user can then study this picture to learn the amplitude, frequen