Transcription
University of RochesterUser’s Guide toURGEMS Ad‐ Hoc Reporting GuideUsing IBM Cognos Workspace Advanced, Version 10.2.1Version 1.0April, 20161 Page
Table of ContentsTable of Contents . Error! Bookmark not defined.Introduction to the Interface . 3Choosing a Reporting Source . 4Navigation within Workspace Advanced . 5Create an Award 5Building the “My Awards” report . 8Adding data fields . 10Building the “Sample budget to expenses/encumbrance” report . 11Selecting the fields and arranging the layout . 12Creating a calculated field. 13Grouping fields . Error! Bookmark not defined. 14Setting up totaling for columns . 14Setting up filters for restricting results . 14Conditional Filtering . 162 Page
Introduction to the InterfaceWhat is Cognos Workspace Advanced?Cognos Workspace Advanced is a tool that allows users to build ad hoc reports from URGEMS data. Allfields in URGEMS will be available for use when creating custom (Ad Hoc) reports. This can be used tosupplement any standard reports within URGEMS.NOTE: if you already have access to COGNOS, you will also have access to Cognos Workspace Advanced.If you don’t have access please complete the required Cognos Access form to request access.Logging inActivate the Workspace Advanced report authoring tool by logging into the IBM Cognos application ‐https://cognos.dw.its.rochester.eduOnce logged in, users can follow one of two steps.If logging into Cognos for the first time, users will see this start screen:Logging in for firsttimeIf already logged into Cognos, use the drop down menu choice (Launch Cognos Workspace Advanced)when already logged in:Already logged intoCognos3 Page
Choosing a Reporting SourceUsers will then be shown a list of report packages users have either used recently, or can navigate to. Inthe accompanying graphic, users will see various choices. Depending on a user’s permissions, users willbe able to make a selection from the list. Users may have to navigate up/down through folders to selectthe proper reporting package.1. Drill down to the URGEMS Ad‐Hoc reportingpackage by selecting the following:a. Select the Cognos folder, then PublicFolders , then #URGEMS Ad‐Hoc folder as seen in theadjacent imageb. Next select the Packages folderThis will take you to the complete path of:c. Finally, select the URGEMS Adhoc objectTip: If the user has already run an ad hoc report, look to the “Recently used packages”section for a quick link for the URGEMS Ad‐Hoc folder path.Users will now be presented with a screen to choose whether they wish to create a new report, oropen an existing report.4 Page
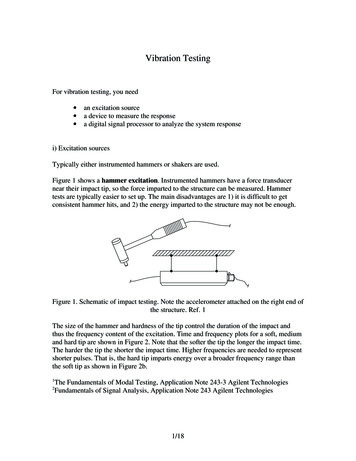
Create a ReportTo create a new report, follow these steps.1. Choose Create New (Report) from the screen options seen above from the IBM Workspacescreen.Tip: If users uncheck the “Show this dialog in the future” option, this screen will no longer appear nexttime you log in, but users will still have the option to Create new or Open existing when in the mainapplication window, under the “File icon” () drop down menu.After selecting to create a new report, a variety of templates will appear for the different types ofreports that can be authored.2. Select List format. This is a traditional lookingspreadsheet style report template. Other choices such ascrosstab and chart will be discussed later.Navigation within Workspace AdvancedAfter selecting the List template, the template will load on screen.Main MenuSub ortFooter5 Page
Toolbars:The Main Menu bar consists of the following menu and submenu choices:“FILE”EDITVIEWNewUndoPage DesignOpenRedoSaveCutPagePreviewToolbarsSave AsCopyVisual AidsPDF PageSetupCopy DataPreviewOptionsReportpropertiesPasteLog OnPaste ToLog OffDeleteSTRUCTUREDATASTYLEGroup/UngroupData PropertiesStyleSwapRows/ColumnsSection / UnsectionFilter Remove,EditSuppress NoSuppress, SuppressRows, SuppressoptionsSortConditionalFormatApply TableStyleHeaders / FootersPivot Table toCrossTabSummarize Automatic,total, Count,AVGCalculate ‐ / *Insert ChildrenDrill OptionsRUNRun Report‐ HTMLRun Report‐ PDFRun Report‐ Excel2007TOOLSAutocorrectShow SpecShowSpecification(Selection)Run Report‐ Excel2007 dataRun Report‐ Excel2002Open fromClipboardRun Report‐ CSVManageShared SetReferencesOptionsRun Report‐ XMLRunOptionsCopy toClipboardThe submenu toolbars have the associated icons with many of the above features. Users can tell byhovering over them which ones have what function.6 Page
Source and Toolbox Navigation Tabs:The far right menu is broken into two navigational tabs: Source and Toolbox. The user can toggle backand forth between the Source and the Toolbox tools to use. Appendix A (at the end of thisdocumentation) will list out all the Menu navigation choices and the icons and what they mean.The Source Navigation Tab allows users to drill through thevarious data fields from URGEMS that users can incorporateinto a report. Items that users can drag into a report are eitherdata fields (text fields, or calculations) directly from URGEMS,or custom calculations prebuilt in IBM Cognos WorkspaceAdvanced.Users can expand / collapse these sections where users see thetiny triangles. To add a data field to the report body, just clickon the field, hold down with the left mouse button, and drag itto the appropriate position on the reporting grid. Additionally,users can double click on a source field which will automaticallyadd the field to the last column of the report. Hovering over adata field will trigger a tooltip to appear if one has beenFor the Toolbox tab, there is a list of objects users can add tothe report such as advanced features or functions like a URLhyperlink or a text box. There are many objects that can beadded to a report which have their own set of properties toconfigure.For example, tables can be used as organizers for whereobjects appear in a report; different graphical output objects ‐like List, Chart, and Crosstab – can now be shown on the samereport.7 Page
Building the “My Awards” reportBegin building a simple report, based on the URGEMS data set. This report will list out the awards usershave permissions to view. This report looks similar to the Workday Financials URF0313 report. Below isan example of the Ad Hoc My Awards report below:Cognos Columns referenced to URGEMS:8 Page
Steps to create the My Awards report:This report will show you general Award information (Award number, title PI on the Award, status,total funded and Project Begin date). This can be used as the basis for high level Award report. Open Cognos Workspace AdvancedSelect a List report layoutAdd fieldsAdd totals and countsSave and Print1. Open Workspace Advanced, either from the main menu screen or from the Launch bar. Users willthen be prompted to select a data source for the report.a. Look either in the most recently used or navigate to the #URGEMS Ad‐ Hoc report packagefolder and select the URGEMS Ad‐Hoc object.Tip: Look tothe “Recentlyusedpackages”section for aquick link tothe URGEMSAd‐Hoc folderpath, if areport hasalready beenrun.b. Users may be prompted to “Allow Access”; choose yes.c. When users see the IBM Workspace Advanced window, choose Create New Report button.Users should now see the following:2. Select the List report layout from the New window on screen. Workspace Advanced will now drawthe screen for users to work within.9 Page
Adding data fieldsUsers can either drag & drop data from the Source navigation tab, or double‐click on fields and theywill append to the last column on the right. Users can drag columns around after for re‐alignment ifso desired.Tip: Go to the VIEW menu and select Page Design. This will let users add fields without populating withreal data, which will slow down the build time.3. Below are the URGEMS fields to build this report.Add each field (Double click, or Drag and Drop) to the Report Build Area of the screen using theSource navigation tab.Data FieldSource Foldera. Agency TypeNon‐Salary Data / Agencyb. Agency Award NumberNon‐Salary Data / Awardc. UR Award NoNon‐Salary Data / Awardd. Award TitleNon‐Salary Data / Awarde. PI/Resp (Responsible)Non‐Salary Data / Awardf. StatusNon‐Salary Data / Awardg. Total Funded AmountNon‐Salary Data / Awardh. Project Begin DateNon‐Salary Data / Award/Dates4. Once the columns are set, group the awards based on the Agency Type.GroupClick on the header field of the Agency Type column, and click on the Group iconin thestandard toolbar. Once this is set and View/ Page Preview is selected, the awards will line up undereach award type. This will be done in step 7.5. Next, add a total to the Total Funded Amount column to show the totals for that Agency Type.SummarizeClick on the Total Funded Amount column header and click on the Summarize iconstandard toolbar.By choosing “automatic summary”, the report will total Awards by Agency Type.in the10 P a g e
6. To add a count, click on the Agency Award Number or UR Award No column and in the SummarizeCounticonchoice, choose Count. A count total will be listed below.Note: if a data cell is blank, it will not be counted.7. Change View to Page Preview to see the actual data for this report.8. To add a Title to the report, double click on the “Double click to edit text” section in the pageheader. A Text window will appear. Type in the Report title here, then click OK.9. Save the report for later reference.a. Select the “File”option in the Main Menu, then choose Save. Type in the name ofthe report and choose the folder the report should be saved in (My Reports, or Public).10. Run and Print your report. Select Run in the Main Menu and choose the format desired (HTML, PDF,or Excel). This will launch the application with the report data. Here you can print out the reportwithin the application chosen.Building the “Budget to Expenses/Encumbrance” reportThe next report to build will be a “budget to expenses/encumbrance report”. Here is a snapshot of whatit will look like when completed:11 P a g e
The steps to build this report will be: Selecting the fields and arranging the layout as above.Create a calculated field (variance)Grouping FAO’s and creating automatic summaries ( totals)Set filtersAdd conditional formatting to show where the actuals exceed the budgeted amountsWhen users click and drag (or double‐click and append) the fields should be arranged in the ordershown in the sample.Selecting the fields and arranging the layout1. Go to the VIEW menu and select View /Page Design. This will let users add fields withoutpopulating with real data, which will slow down user build time. Next, select the followingfields from the respective query subjects:Data Fielda. FAO yearb. Statusc. FAOd. Descriptione. Categoryf. Budget Amt (Amount)g. Total Enc (Encumbered)Amt (Amount)h. Exp (Expense) TotalAmounti. Variance (to be built later)Source oryCategoryCategoryEncumbrances/Expenditures / EncumbranceEncumbrances/Expenditures/ ExpensesA calculated field: Budget Amount –ExpenseTotal Amount12 P a g e
Creating a calculated fieldOne of the fields to create is a calculated field, as it doesn’t exist as a drop down choice in the reportingpackage. It will be named Variance, and the calculation will be the difference between the budgeted andthe expense incurred amount.2. To create a calculated field, click on one of the report columns that will be used in thecalculation, then select the Toolbox /Query Calculation icon from the listfrom thestandard toolbar. This will start a dialog of how the calculation is to be created:3. Rename the calculation in the upper left area within the Name field to Variance.4. The data fields used in the calculation will come from the Available Components center tab.In this example, create a calculation for the following: Budget Amount – Exp Total Amounta. Select the fields in the Available Components area of the window by double‐clickingBudget Amt, then type in a “‐“ sign, then double‐click on the Exp Total Amount field5. Select the OK button to automatically add the calculation column to the report.6. Now, group the expenses by FAO. Click on the FAO column on the report page, and then goto the upper toolbar and click on the Group/Ungroup toolbar icon(Users could also goto the Structure/Group Ungroup within the Main Menu as well).This will group all lines to the same FAO. Users will see the Group icon in the report column.To ungroup, simply click again on the Group icon in the upper toolbar.13 P a g e
Report structure in Workspace Advanced:Setting up totaling for columnsFollow these steps to set up the totaling for the various columns.7. Click and hold down the shift key for each numerical field users wish to have a total on, andthen choose from the upper menu:or in the Data/Summarize from Main Menu, thenselect Automatic Summary choice.For this example, apply totaling to the Total Enc Amt, Exp Total Amount and the TotalAnticipated YTD columns.Report structure in Workspace Advanced:Setting up filters for restricting resultsNext, the initial filters need to be set. Filters can be applied to any column. If the report is notfiltered, it may take a long time to run or it will time itself out.To set the filters:a. Click on the FAO Year and then click on the Filter icon, and from the drop downchoose Create Custom Filter (users can also edit the filter later if required).b. Users will be presented with the following Filter Dialog box:14 P a g e
c. Choose Specific values from the Values drop down listd. Click on the choice(s) from the left side, and then click on the green arrow in themiddle to transfer to the right side with I the Selected Values section. These willnow be the valid choices that the report will execute on.e. When users are done making filter choices, click on the OK button to apply the filter.f. To see what filter choices have been made, click on the Filter icon again and selectEdit filters to see the following:g. Users can edit these or remove them using either the X (to delete) or the pencil (toedit).h. Go to the menu bar and choose View/ Page Preview to view the report data.15 P a g e
Report structure in Workspace Advanced:Advanced: Conditional FilteringThe final activity for this report would be to help identify where expenses have exceeded thebudgeted amounts. The idea is to apply conditional styling (which is similar to conditional formattingin Microsoft Excel).8. To apply conditional styling to a data field, select, the Variance column then click on theicon at the right end of the toolbar. A “wizard” will now appear:a. Click on the bottom left icon (paper with a sun) to add a new conditional style; basethe style on a data field, in this case Variance, then select OK.16 P a g e
9. Next, users will pick the coloring to appear when values appear between two numbers (inthis case, “poor” is defined as happening below the breakpoint). Click on the drop‐down andselect POOR. Users will then be prompted for a thresh hold number (what is the top limit ofthe lower value); in this case I use negative 0.01 (‐0.01), as that dividing line betweenProfitable and Loss.10. Add Variance to the Name field11. Select OKReport structure in Workspace Advanced:SupportFor technical support contact the UnivIT Help Desk for assistance.–UnivIT: 275‐2000 or email UnivITHelp@ur.rochester.edu–URMC: 275‐3200 or email HelpDesk ISD@URMC.rochester.edu17 P a g e
What is Cognos Workspace Advanced? Cognos Workspace Advanced is a tool that allows users to build ad hoc reports from URGEMS data. All fields in URGEMS will be available for use when creating custom (Ad Hoc) reports. This can