Transcription
Automated Dispatch System User GuideADS User GuideFebruary 2, 2021Copyright 2021 CALIFORNIA INDEPENDENT SYSTEM OPERATOR. All rights reserved.Revision 02/02/20211
Revision criptionUpdated color codingdescriptions for Validcolumn and Resource IDcolumn (Sections 3 and10)New User Guide forupdated ADSCopyright 2021 CALIFORNIA INDEPENDENT SYSTEM OPERATOR. All rights reserved.Revision 02/02/20212
Table of ContentsRevision History . 21 Introduction . 52 System Overview: Accessing and Navigating ADS . 6Accessing the ADS Application. 63 Data Grids Overview . 8Batch Status/Interval Display/Alarm Management Grid . 9Messages and Options Menu . 10Resource Data Grid . 10Instructions Detail Grid . 10Trajectory Plot . 114 Grid Filtering and Column Settings, including Resource Data Grid and Instruction Grids . 12Column Configuration . 12Column Picker . 12Column Order . 13Column Width . 13Column Sorting . 14Column Filtering. 14Column Calculations (Default) . 195 Real Time Tab. 20Exceptional Dispatches (EDs) . 21Commitment Instructions . 22Transition Instructions . 22Ancillary Service Awards (AS Awards) . 23Unannounced Ancillary Service Tests (AS Tests) . 23Operating Instructions and Follow DOT Flag (Eligible Intermittent Resources in CAISO BA) . 246 Hourly Pre-Dispatch Tab . 25Responding to Hourly Instructions . 267 Options Menu . 27Configurations (Profiles) . 27System Messages and Message Query . 29Query Tool . 308 Trouble Shooting – Logging in . 32Copyright 2021 CALIFORNIA INDEPENDENT SYSTEM OPERATOR. All rights reserved.Revision 02/02/20213
9 Advanced Filter User Exercises (additional examples) . 3310 Column Definitions (Data Dictionary) . 3611 Additional information . 42Questions . 42Technical Information . 43Day Light Savings . 43Pop up notifications on the Desktop . 43Copyright 2021 CALIFORNIA INDEPENDENT SYSTEM OPERATOR. All rights reserved.Revision 02/02/20214
1 Introduction The objective of this document is to provide details on using and interpreting theinformation available on the Automated Dispatch System (ADS) user interface (UI).The ADS UI is based on a WebSDK platform. ADS displays commitment (start – up / shut down / transition) instructions, energyinstructions, and ancillary services awards from the real-time market application.The energy instructions include, but are not limited to 5 (five) minute dispatchoperating targets (DOT) from the Real Time Economic Dispatch (RTED), 10 minutecontingency dispatch (RTCD), Exceptional Dispatch, and Hourly Intertie Instructionsfrom the Hourly Scheduling Process (HASP).o This document will touch on portions of the real time market timeline andprocesses, but will be limited to how data is displayed in ADS. AdditionalInformation regarding dispatching rules, market operations, andprocedures can be found in the Business Practice Manuals for MarketOperations and Market Instruments, which can be downloaded onwww.caiso.com Rules Business Practice Manuals.The organization of this manual is as follows:oSection 1 is introductory material. Notably, it contains an overview of thepurpose and intended use of the application.oSection 2 describes an introduction into logging into the application, aswell as the basic functionality of the user interface used to navigate ADS.oSection 3 discusses an overview and functionality of each grid within theADS application.oSection 4 discusses more advanced functionality, such as filtering andconfiguration of save sets and use of the query tool.oSection 5 expands on the Real Time tab.oSection 6 expands on the Hourly Pre-Dispatch tab.oSection 7 discusses the additional Options Menu and using each of thoseoptions.oSection 8 discusses troubleshooting steps for various issues that users mayhave experienced when logging into the ADS application.oSection 9 contains additional examples for advanced filtering, set up asuser exercises to become familiarized with the filtering tool.oSection 10 contains a table of data column short descriptions.oSection 11 discusses other resources for additional information regardingADS.Copyright 2021 CALIFORNIA INDEPENDENT SYSTEM OPERATOR. All rights reserved.Revision 02/02/20215
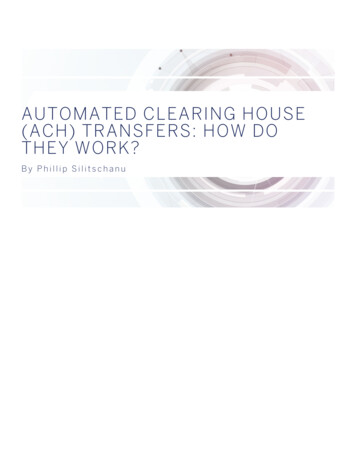
2 System Overview: Accessing and Navigating ADSAccessing the ADS Application The ADS application is web-based application with role-based access via the CAISO MultipleApplication Certificate (CMA) for authentication.o To access ADS, a user will need to work with their organization’s User AccessAdministrator (UAA) – who administers the CMA certificate, as well as provisions access.o Access can be at the Scheduling Coordinator ID (SCID) level or setup for specific accessfor a set of resources through an Access Control List (ACL). For more information on this,please work with your UAA and refer to the Access Identity Management (AIM) UserGuide.o Access can be read only (view of ADS dispatches) or read-write which provides capabilityto accept dispatches (hourly intertie dispatches, for example).o Accessible via the environment’s Market Participant Portalo Supported Browsers: latest Chrome version or Microsoft Edge with Chromium 85.xTip! To view in Full Screen mode in Chrome,Shortcut Key: hit F11 on keyboard, OR click 3 dots in upper right hand side ofChrome Browser, navigate to row labeled Zoom and click the “square” iconTo exit Full Screen, again hit F11 or click “X” when hovering in the middle of thedisplay ADS Main Display: upon logging in, a main display will be shown with multiple data grids withinthe display which we call the Application Content area. At the top of the display, it contains asystem dashboard, which has common navigation commands like previous/next page, refresh,stop loading, adjust Time Zone, and log out.Figure 1Copyright 2021 CALIFORNIA INDEPENDENT SYSTEM OPERATOR. All rights reserved.Revision 02/02/20216
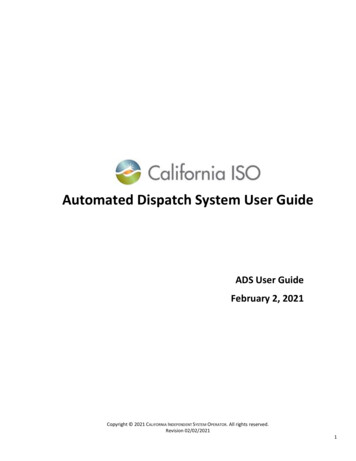
IconDescriptionBackForwardStopRefresh (Use this when loading a new profile)User Preferences (US Time Zone Change)Exit (can also X out of window in upper right corner of browserwindow). Using this button will close all open windows. There are certain components that are common to many displays in the Application Contentarea, including in the Resource Data Grid, and Instructions Grid.In the Resource Data, Instruction Grid, and other grids, the toolbar is found in the area outlinedin red in Figure 2 below.o May include filtering, navigating, and exporting options. It contains filters that allow theuser to control the information displayed on the data grid portion of the display. Thefilter options is always at the upper edge of the grid. More detail on using these optionsare described in Section 4, Grid Filtering andFigure 2IconDescriptionRestore Default Sort. It is possible to change the sort orderof the contents of a tabular display by clicking on the titlerow. Clicking on the Restore Default Sort button restores thesort order to the default, that is, it removes any sorting thathas been established by clicking on title rows.This is an advanced filter icon, allowing to only display datathat matches the advanced filter criteria – utilized for whenmultiple filters need to be applied.Reset Advanced Filter (Clear all)This is an inline filter icon, allowing to only display data thatmatches the inline filter criteria. To close or reset, click onthis icon again.This is used to export the contents of the data grid with thebelow options:Export All – all data grid items in resultsExport Page – data on page viewExport Wizard – will allow selection for excel or .csvCopyright 2021 CALIFORNIA INDEPENDENT SYSTEM OPERATOR. All rights reserved.Revision 02/02/20217
This is a column select tool that will allow the user to add orremove columns from the grid. The default will always loadwhen logging in.This button may be on some displays to allow the user tomake some adjustments in Tabular grids. This is the ‘Edit’icon used to edit a selected set of rows. Example: editingaudio options in the Configurations tool. Data Grid: Each area under the navigation menu is a data grid. The available data grids areBatch, Messages, Resource Data, Trajectory Plot, and Instruction. These were previously knownas Panels in the ADS Delphi Client. System Message Bar: This is at the very bottom of the Application Content Area. It is used toadvise the user of various events, errors, etc. This area grows and shrinks vertically toaccommodate the message(s) that need to be shown. For example, if an ADS maintenance (suchas a Fallback) caused a brief interruption, it may appear:3 Data Grids Overview This section will review each data grid in the main display within the Application Content Areao Batch Status/Interval Display Grido Message and Options Menuo Resource Data Grido Instructions Grid, ando Trajectory PlotCopyright 2021 CALIFORNIA INDEPENDENT SYSTEM OPERATOR. All rights reserved.Revision 02/02/20218
Batch Status/Interval Display/Alarm Management Grid Instructions sent by the Real Time Market to ADS are sent in what is called a Batch. When a newbatch is received, such as a new batch of RT DOT dispatches, the column for the received batchwill flash red until acknowledged by clicking on the column or click OK on the pop up message (ifconfigured). Acknowledge visual flashing and audio alarms in Batch grid: oSelecting/clicking in the column will acknowledge the alarm, which will stop the columnfrom flashing red.oSelecting/clicking in the main title column under “Interval” will clear all alarms.oWhen the Continuous alarm is active for a Batch type, the alarm will run continuouslyuntil acknowledged. This can be acknowledged from the Batch grid by clicking on theBatch Column to acknowledge the batch, which will mute the alarm.Filtering the Resource Data from the Batch GridoWhen a column is selected in the batch grid, all resources with records for the receivedbatch will be highlighted in the resource data grid. Clicking again will remove thehighlight.oPreconfigured filter: When the filter checkbox is selected below a batch column, onlyresources with records for the filtered batch will be displayed in the Resource Data grid. For example, if the filter checkbox below the Commitment column is selected,then only resources with records in the batch for Commitment will be displayedin the below grid.Reading Current Interval vs Dispatch Interval rowsoCurrent interval displays the time period that is currently active in real timeoDispatch interval displays the time period that is currently being displayed and willbecome real time once it reaches the current clock timeoExceptional Dispatch (ED) records may have several active time periods and types ofEDs, this column displays results when an ED has been received in the recent Batchinstruction. The received/status will reflect time batch was received.Operation Instructions records may have several active time periods, the Opr Ins columndisplay results when an Operating Instruction has been received in the recent Batchinstruction. The received/status will reflect time batch was received.oCopyright 2021 CALIFORNIA INDEPENDENT SYSTEM OPERATOR. All rights reserved.Revision 02/02/20219
o A/S Test records may have several active time periods, the columns are used to displaywhether there are active records for the interval. If there are none active, these rowswill remain blank. The received/status will reflect time received.Received/Status row displays the time that the last batch was received. Inaddition, the status will display a countdown timer for Hourly Instructions whichwill indicate how much time is left in the current response period.Messages and Options Menu The panel shows a chronological history of the batches that were received by the ADS Client.This is a good indicator to determine if ADS is connected and receiving data. Each batch has adescription of the type of data contained in the batch as well as a unique batch id. The batch idis primarily used by other automated systems that may use the batch id when programmaticallypulling data into their 3rd party systems. Options Menu above the Message grid contains three options, and when clicked will open a popup display for that option.o “System Messages” allows for querying of messageso “Query Tool” allows for searching of historical datao “Configurations” allows for configuration of profiles (i.e. saving a saveset), configurationof audio alerts, and configuration of pop up messagesResource Data Grid This is the main display which provides resource specific data including MW totals, relevanttimes, and other resource specific information.o An instruction is considered ‘Validated’ and will have a green or yellow box in the Validcolumn if an instruction was acknowledged Green if the instruction was acknowledged by a user with write access. Yellow if the instruction was acknowledged by a customer’s AutomatedProgramming Interface (API), with read access only (not read-write access)o Otherwise the instruction is “Unvalidated’ and the box will be redAs the Resource Data grid is the main display, this grid is covered more in depth in the ResourceData Grid and Instructions Grid section.Note: The default view will contain a Resource ID and SCID column, however for the purposes ofconfidentiality, this column has been hidden or removed for many of the screenshots in this guide.Instructions Detail Grid The Instructions Detail also shows a chronological history of the DOTs, Commitments, andadditional instructions for the resource selected in the Resource Data grid. The InstructionsCopyright 2021 CALIFORNIA INDEPENDENT SYSTEM OPERATOR. All rights reserved.Revision 02/02/202110
Detail grid can be customized similar to the Resource grid, using the column picker and theinline filter.Trajectory Plot The Trajectory Plot shows tracks a history of the dispatch operating targets (DOTs) and dispatchoperating points (DOPs) for the resource selected in the Resource panel.The DOT is the instruction go-to MW that the resource should be following.The DOP is primarily used in Settlements, which considers where the resource is ramping to andfrom, to calculate Expected Energy on a 5 minute basis. The DOP is based on the OperatingRamp Rate submitted by the Scheduling Coordinator (SC) in the SIBR application.Copyright 2021 CALIFORNIA INDEPENDENT SYSTEM OPERATOR. All rights reserved.Revision 02/02/202111
4 Grid Filtering and Column Settings, including Resource Data Grid andInstruction GridsThe Resource Data grid is set up with multiple tabs (viewed across the top of the Resource Data grid). The selected tab that is being viewed is highlighted in Blue as seen in the figure above.There are two (2) default tabs (pre-filtered), and 14 additional tabs – all of which can be usedand further filtered/configured. The 2 default tabs are the Real Time and Hourly Pre-dispatchtabs. There are a total of 16 tabs.o The Real Time tab has a pre-programmed filter to exclude Hourly Pr
display ADS Main Display: upon logging in, a main display will be shown with multiple data grids within the display which we call the Application Content area. At the top of the display, it contains a system dashboard, which has common navigation commands like previous/next page, refre