Transcription
Application Sharing inthe Virtual ClassroomTesting FrameworkThis document is for the actual testing of the differentapplication and screen sharing solutions.Gerhold Benjamin Kooper11/19/2010
18 November 20101. IntroductionThis document is to outline the testing factors and issues to test on the different screen and applicationssharing tools. It would also outline how these tests would be done.In this document the attributes to be tested for the analysis discussed in the Analysis Framework isdiscussed. The document would also outline how to tests the different attributes and the software andtools used for each of these tests.2. The Testing Environment SetupThe setup under which the testing would be done is shown below.Figure 1: Environment SetupMain PC-Intel Quad Processor, 2.66GHz x 43 GiB Physical Memory, 1GiB Virtual MemoryThree NIC: eth0 1 Gbps, eth1?, eth2 ?Ubuntu 10.04 Luicd, 2.6.32-25-generic kernelThe desktops are able to access internet by using the masquerade function of the iptables software. Themain pc can also manipulate the bandwidth between it and the Desktops by using the iproute kernelmodule script.2
18 November 20102 Nanoware PCs-Intel(R) Atom 1.60GHZ x22 GiB Physical Memory1 NIC ?Ubuntu 9.04 , Windows Vista Home Edition3. Pre TestThere are some tests or investigation to be done before doing the testing of the application and screensharing systems. These tests would help in setting the tests criteria.3.1.Network MappingThis investigation is to determine the physical network layout to address issues regarding hostedsolutions on different continents.This may be done by using route trace which would show the different routers the IP packet passes toget to the server. As per the IP protocol design, the same route may not be followed at all times, so thishas to be taken into account. The IP address of each router can then be entered into the websitewww.ip2location.com to get the geographical location.The network mapping could also be determined more accurately by obtaining the network map fromthe Internet Service Providers in South Africa and Namibia.3.2.Proxy Affect on LatencyThe ping test provides the network latency to the host being pinged. This however may not reflect thesame latency on the application protocol layer. The HTTP protocol data has to pass trough the proxyserver and add delay.Have also to find out whether there are policies by the Rhodes IT Department that throttle networktraffic of certain nature such as streaming audio/video. Also to see if ssh traffic is slowed down bythrottling.3.3.Computer PerformanceInitial trials of application sharing system on the Atom Processor show high processor activity when evenjust moving the mouse around or activities causing frequent changes on screen. Have to investigatesignificance of processor speed and type.4. SoftwareThis part is to test the issues concerning the software itself with assumption that the bandwidth andnetwork connection is ideal and has no problems.3
18 November 20104.1. LatencyIn the screen and application session systems, it is the delay between when the presenter initiates anactivity, such as mouse click or cursor move on the screen and when a participants or student observesthe same action on their computer.One way of testing this would be by observation as both desktop computers are on the same table. Onecan perhaps click on one desktop and watch how quickly the action responds on the other desktop.To have amore accurate measure, screen recording software can be used. The shared application can berun on the same screen together with Wireshark to see the packets leave of the application sharingsoftware. This would allow measuring the delay between when a mouse click on a menu of the sharedapplication and the moment the IP packet is send onto the network. This measurement can be tomilliseconds.4.2. SmoothnessA smooth experience is one that flows easily with a minimum of choppiness or flicker. In screen andapplication sharing, what underlies a smooth experience is often a high frame rate.This can be tested by watching a video clip in the shared screen or application and observer thesmoothness of the video playback. The video should be encoded at different frame rates such as: 25 frames per second used in standard video and5 frames per second being used in CCTV security camerasAn ideal performance would be to see a smooth picture on the viewers screen encoded at 25 frames persec or higher.It should be checked and noted whether the software allows the user to change the frame rate. Theframe rate change would directly affect the bandwidth use.The frame rate when used with compression may have a negative correlation where the higher thefrequency of update, the less efficient it is as the endpoint may not be able to compress anddecompress the updates fast enough.4.3. FidelityFidelity denotes how accurate a copy is to its source. When screen sharing, presentation with perfectfidelity looks identical to both the presenter and attendee.This can be tested by observation on both desktop computers. One can make observations withdifferent settings of screen resolution and background inclusion or exclusion. The resolution changeswould however directly affect the bandwidth use.As the fidelity can be changed by changing the screen resolution, it should be noted whether thesoftware allows user to change resolution.4
18 November 20104.4. Partial Screen UpdatesSome software use techniques to minimize the amount of traffic to be send over the network forupdating the screen and would try to only send parts of the screen that have changed. This is alsoknown as Run Length Encoding (RLE).The effectives of this would change as the proportion of screen has to change. The test here is to seewhen having windows on the screen needing frequent updates, such as a video clip, what is theoptimum size in terms of proportion considering resolution one can have. It can be measured in termsof ½, ¼ or so.4.5. CompressionMany of the software use compression to further reduce bandwidth usage and improve applicationperformance.This test is to see the affect of compression in improving performance of the application sharingsolution. Compression rate on images of different formats may be higher then other, but this test is tosee the significance.5. NetworkThis part is to test the issues concerning the bandwidth with assumption that the software is ideal andhas no problems.5.1. ProtocolsThis would be to see the protocols used by each system.5.2. Physical International ConnectionIn the case of web based application, this test would check if one physical connection is used. It is also tosee if there is a difference in performance of the network when connecting at different times.5.3. BandwidthIn this test, the bandwidth used by each system and protocol would be measured. The bandwidth wouldalso be manipulated to test system performance at different speeds.The bandwidth usages of the application would be directly affected by some settings in the softwaresuch as screen resolutions, frame update rate and compression enabling.The solutions can be tested at different speeds such as: 10 mbps, 5 mbps, 1 mbps, 512 kbps, 128 kbps, 56 kbpsIn addition to the bandwidth, network latency would be added such as 500 ms, 300 ms, 100 ms and 10ms. Added to this would be random packet loss and random connection loss to emulate unreliablenetworks. Combination of these various attributes one may have a test situation such as 5 mbpsbandwidth, 300 ms latency, 5 seconds connection loss and 5 % packet loss.5
18 November 2010Tests should be done from the UNAM connection to have the situation of the connection for morerelevant testing.The Wide Area Network Emulator (WANem) provides this functionality.6. Testing CandidatesThe Application Screen Sharing Solutions to be tested can be categorized as follows: Display Protocolo NX FreeNXo VNC/RFB TightVNC, RealVNC, iTALCo RDP Windows Remote Desktopo HTTP FreeNX, TeamViewer, Vyew, LogMeIn, Adobe Acrobat CONNECTNOW, Mikogo,Skyfex, Shareitnow, Yuuguu Transport Protocolo UDP TeamViewero Architectureo Replicated Flexible JAMM Platformo Windows Windows Remote Desktop, TightVNC, TeamViewero Linux FreeNX, TightVNC, RealVNC, iTALC Offeredo Free FreeNX, TightVNC, RealVNC, iTALC, TeamViewer, Mikogoo Limited CrossLoopso Trail GoToMeeting, Glance, eBLVD, BeamYourScreen, Gatherplace, SLLight, AT&TConnect, Anyplace Control, Assemb'Live, Elluminate, Fuze Meeting, Hear Me,Toktumi Desktop Sharing 6
18 November 20107. Remote Desktop Full Screen Update TestsFull screen update tests would check the maximum time it would takes the solution to update thescreen. The test would also see the compression efficiency. For this test the following would bemeasured: Data size transferredTime it takes to do completed data transferAverage speed in mbpsAverage packets send per secondAverage packets sizeTime it takes to complete screen updateThe test would first be done with default settings and later with solution tuned for best performance.Benchmark: Bandwidth usage for resolution, window size and frame rate combination.Below is an example of a table for testing the bandwidth usage for different solution with attributesbelow: 1024x768 pixelsWindows sizes taken as proportion of screen such as full, ½ or ¼ of screenVideo encoded ranging from 25 to 5 frames per secondNetwork latency for example 10 ms, 100 ms, 300 ms and 500 msSome solution allow different compression and encoding such as RLE, ZLIB, HextileSolutionResolutionColor DeptDisplay ProtocolTransport ProtocolDisplay EncodingScreen UpdateEncoding: [Product Name]: [1024x768, 1280x1024]: [8 bit, 16 bit, 32 bit]: [VNC, HTTP, AIP, X, NX, etc]: [UDP, TCP]: [Low-level Graphics, High-level Graphics, 2D draw Primitives]: [Lazy, Eager, Server Push, Client Pull]: [RLE, ZLIB, etc]Network Latency: [10 ms, 100 ms, 300 ms, 500 ms]7
18 November 2010Notes: When doing a testing, the screen recording has to be done at the same time as capturing thenetwork packets. The IP packets have to be captured closed to the client thereby needing to connect both clientand main pc to a hub acting device. Also to make sure the network emulation is completed onpackets captured. The network stats have to be compiled immediately after capture to account dropped packetsand other network errors. Screen recording software should capture at a higher frame rate. Ping test done to measure network quality by using the flood option wit packet size 1440 bytes.The packet size is chosen as initial screen sharing test done show the largest packet size where1448 bytes. The following are the results of ping test for two servers in Namibia:o Command eneterd was sudo ping server -s 1440 - foelc.nolnet.edu.na Hosted by Gijima:PING elc.nolnet.edu.na ( 96.44.128.207) 1440(1468) bytes ofdata.3674 packets transmitted, 3507 received, 4% packet loss,time 50904msrtt min/avg/max/mdev 57.637/59.393/93.349/1.263 ms, pipe7, ipg/ewma 13.859/60.527 msowwwscan.unam.na which is the mail server at UNAM campus:PING unammail.unam.na (196.20.25.200) 1440(1468) bytes ofdata.3237 packets transmitted, 3059 received, 5% packet loss,time 46564msrtt min/avg/max/mdev 112.225/125.039/197.240/10.748 ms,pipe 15, ipg/ewma 14.389/120.921 ms Determine for each solution whether only the part of the screen that changes is updated.7.1. Methodology-7.1.1. SoftwareNetEm Network Emulator: Based on the iproute Linux kernel. Control network latency andtransfer rate.WireShark. Capture traffic and analyzeMS Excel. Used to calculate network data sums for each picture update.8
18 November 2010-Presentation Programs such as MS PowerPoint and Open Office Presentation. To displaypictures using full screen.7.1.2. Steps or Procedure7.1.2.1.NetworkThe steps or procedures for the full screen update tests are outlined below. First the solution being tested is started on the pc to act as the display server. The screen resolution is set at the necessary places. The latency is set at the Main PC using the Traffic Control command as shown here:sudo tc qdisc add dev eth1 root netem delay 60ms 5msoAbove eth1 would be the interface to which the display server is connected, so it canalso be eth2 or eth0o netem is the Queuing Discipline used in this case as to the iproute Linux kernel moduleo For this test 60ms with variation of 5 ms is set for network latency as this is what thelatency is more or less to Namibia. Servers such as www.telecom.na,www.mweb.com.na and elc.nolnet.edu.na were pinged. Results were sometimes about70ms and 50ms. The client to be used for the remote session is connected to the display server. A presentation is started on the display server with full screen images. MS PowerPoint is usedfor windows and Open Office Presentation for Ubuntu. Same images are used in same order. WireShark is started to capture packets to and from the display server.9
18 November 2010 After all slideshow is done and captured packets are saved, the I/O Graph is opened from menuStatistics- IO Graph. Example shown below: The tick interval is changed to 0.01 sec and the Y units to Bytes/Tick. This allows for an accuratereading of the start and end times of screen updated traffic on the graph. The start and end times for the screen update transferred is then used to located the start andend packets numbers. Example shown below: As shown above the start time from the I/O Graph is about 44.0 sec. In the screenshot above thefirst packet with a big payload would correspond to the start of the traffic peak whichcorresponds to packet number 5070. Using same steps the end packet number of the trafficpeak corresponding to screen update should be deteremined.10
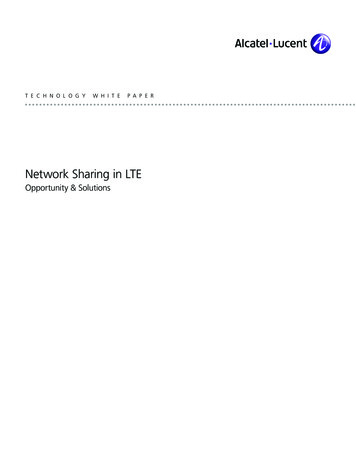
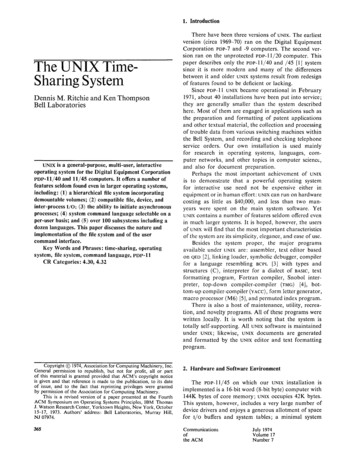
18 November 2010 Having the start and end packet numbers for each instance of screen update, filter is applied toonly view the packets captured for each particular screen update separately. The filter would beframe.number 5070 and frame.number 6801 Now the traffic statistic is easily obtained by using menu Statistics- Summary. Examplesummary below:7.1.2.2.Software To measure the time it takes for the solution to paint the screen is measured using screenrecording software. The recording is then scanned frame by frame through a video editing toolto get time difference from start of screen update to end in milliseconds.7.2. Solution 1: Windows Remote Desktop[About Windows Remote Desktop]Settings Date: 9 NovemberApplication: Windows Remote Desktop on XP SP3Client: Terminal Server Client on UbuntuResolution: 1280x960, 16bit color deptLatency: 60ms 5msDisplay Server: Nanoware PCExperience: High Speed Broadband (Visual styles, Persistent bitmap caching)Transport Protocol: TCPNotes:Uses interlacing so the screen gets painted twice. Half of the download already has the screenupdated and second half only makes it clearer. Picture quality is hard to differentiate. Theresolution above is shown when viewing the screen settings during remote session. It seems the11
18 November 2010remote desktop uses the resolution setting of the connecting client computer.ResultsFigure 2: I/O Graph. Y bytesNo.1234Data (bytes)5651443 (5.39 MB)6753188 (6.44 MB)8245131 (7.86 MB)7590665 (7.23 MB)-Time11.8 sec14.2 sec16.8 sec15.8 secAvg. mbps3.8273.8083.9253.839Avg. Packets/s558.9529.7593.2540.9Avg. Packets Size855.9 bytes898.6 bytes827.0 bytes997.1 bytesData is the amount of bytes send for the screen update for a single pictureTime is the duration of updating a single pictureThe average kbps is the average transfer rate during the data transferred to completed updateof single pictureSettings DateApplicationClientResolutionLatencyDisplay ServerExperienceTransport Protocol: 11 November: Windows Remote Desktop on XP SP3: Remote Desktop Client on Windows 7: 800x600, 16bit color dept: 60ms 5ms: Nanoware PC: High Speed Broadband (Desktop composition, Visual styles): TCP12
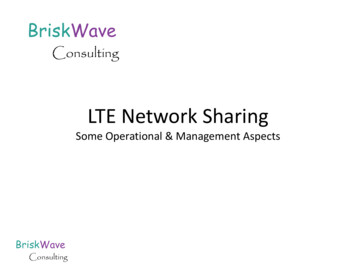
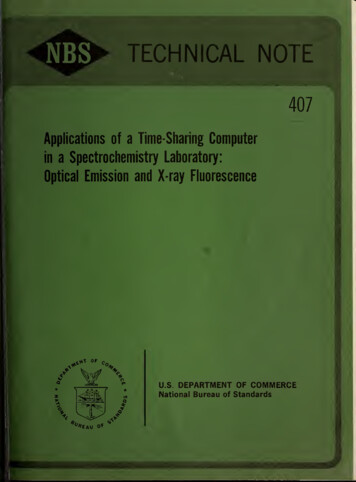
18 November 2010 Notes:ResultsFigure 3: I/O Graph. Y bytesIn above graph the interlacing affect is clearer. The first screen paint finishes at the point where thegraph takes a dip as can be seen above.No.12345Data (bytes)819075 (799.9 KB)1612301 (1.54 MB)991145 (967.9 KB)1053450 (1.00 MB)965567 (942.9 KB)Time3.4 sec3.6 sec3.3 sec3.7 sec3.2 secAvg. mbps1.9063.6052.4322.2952.436Avg. Packets/s280.4485.4352.3324.3341.9Avg. Packets Size849.7 bytes928.2 bytes862.6 bytes884.5 bytes890.7 bytesSettings DateApplicationClientResolutionLatencyDisplay ServerExperienceTransport Protocol: 11 November: Windows Remote Desktop on XP SP3: Remote Desktop Client on XP Virtual Machine on Main PC: 800x600, 16bit color dept: 60ms 5ms: Nanoware PC: High Speed Broadband (Desktop composition, Visual styles): TCP13
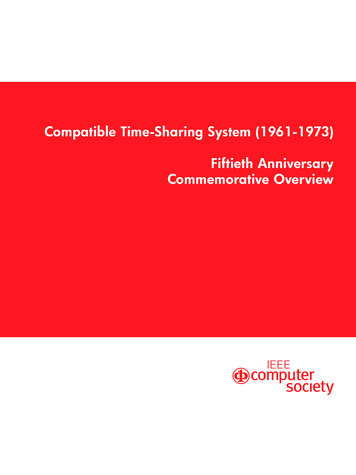
18 November 2010 Notes:Screen time is taken at different time then when network traffic was captured.ResultsFigure 4: I/O Graph. Y bytesNo.12345Data (bytes)Time NAvg. mbps Avg. Packets/s Avg. Packets SizeTime S*840466 (820.8 KB)3.1 sec2.199344.3798.2 bytes0.8011643723 (1.57 MB) 3.3 sec4.006577.9866.5 bytes0.7991011359 (987.7 KB) 3.3 sec2.473377.7818.3 bytes1.01072916 (1.02 MB) 3.2 sec2.650394.9838.9 bytes0.8985775 (962.7 KB)2.9 sec2.758419.0822.9 bytes1.0Time is the time it takes for first screen paint. Does not include second interlaced paint.7.3. Solution 2: FreeNXFreeNX Server is the Free and GPL'd NX server implementation by Fabian Franz, based onNoMachine.com's NX technology. NX compresses the X11 data to minimize the amount of datatransmitted and uses the SSH protocol to send its data. Although designed primarily to optimize X11sessions, NX server can be configured as a proxy server to tunnel Remote Desktop Protocol (forWindows Remote Desktop Services sessions) and remote Virtual Network Computing sessions (mostmodern general-purpose operating system platforms), giving them some of the same speedimprovements. Same screen can be shared by shadowing.14
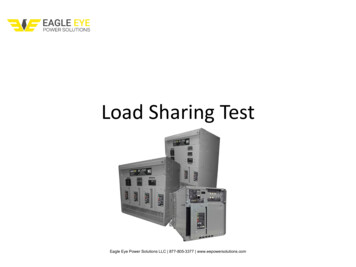
18 November 2010Settings Date: 10 November 2010Application: FreeNX Server on Ubuntu 9.10 Desktop VersionClient: NX Client for Linux by NoMachineResolution: 1024x768Latency: 60ms 5msDisplay Server: Nanoware PCTransport Protocol: TCPNotes:NX Client cache cleared.ResultsFigure 5: I/O Graph. Y bytesNo.1234Data (bytes)303444 (296.3 KB)134230 (131.1 KB)89 036 (86.9 KB)99 778 (97.4 KB)Time1.6 sec0.8 sec0.5 sec0.5 secAvg. mbps1.5141.3331.4531.647Avg. Packets/s215.8217.2208.1233.1Avg. Packets Size877.0 bytes767.0 bytes872.1 bytes883.0 bytesNX Manager Session log:NXPROXY - Version 3.4.0Copyright (C) 2001, 2010 NoMachine.See http://www.nomachine.com/ for more information.Info: Proxy running in client mode with pid '7042'.Session: Starting session at 'Wed Nov 10 19:08:05 2010'.15
18 November 2010Warning: Connected to remote version 3.3.0 with local version 3.4.0.Info: Connection with remote proxy completed.Info: Using ADSL link parameters 512/24/1/0.Info: Using cache parameters 4/4096KB/16384KB/16384KB.Info: Using pack method 'adaptive-7' with session 'gnome'.Info: Using ZLIB data compression 1/1/32.Info: Using ZLIB stream compression 4/4.Info: No suitable cache file found.Info: Forwarding X11 connections to display ':0.0'.Info: Listening to font server connections on port '11000'.Session: Session started at 'Wed Nov 10 19:08:05 2010'.Info: Established X server connection.Info: Using shared memory parameters 1/4096K.7.4. Solution 3: TightVNCTightVNC is an RFB protocol solution for remote screen access and sharing. It uses so-called "tightencoding" of areas, which is effectively a combination of JPEG compression and other types of encoding.Other encodings are ZRLE, RRE, CoRRE, Zlib, Hextile and CopyRect. It can be used on variety of platforms.Custom compression level of encoding used and of JPEG can be set by user.Settings Date: 12 November 2010Application: TightVNC on Windows 7Client: VNC Viewer on XPRe
To have amore accurate measure, screen recording software can be used. The shared application can be run on the same screen together with Wireshark to see the packets leave of the application sharing software. This would allow measuring the