Transcription
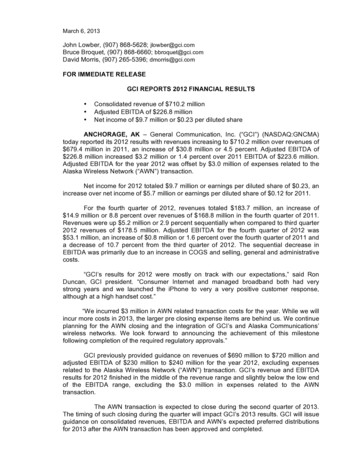
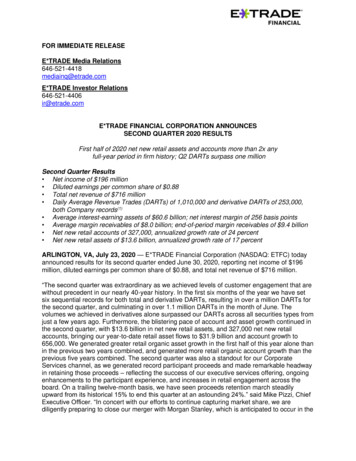
FOR IMMEDIATE RELEASEE*TRADE Media Relations646-521-4418mediainq@etrade.comE*TRADE Investor Relations646-521-4406ir@etrade.comE*TRADE FINANCIAL CORPORATION ANNOUNCESSECOND QUARTER 2020 RESULTSFirst half of 2020 net new retail assets and accounts more than 2x anyfull-year period in firm history; Q2 DARTs surpass one millionSecond Quarter Results Net income of 196 million Diluted earnings per common share of 0.88 Total net revenue of 716 million Daily Average Revenue Trades (DARTs) of 1,010,000 and derivative DARTs of 253,000,both Company records(1) Average interest-earning assets of 60.6 billion; net interest margin of 256 basis points Average margin receivables of 8.0 billion; end-of-period margin receivables of 9.4 billion Net new retail accounts of 327,000, annualized growth rate of 24 percent Net new retail assets of 13.6 billion, annualized growth rate of 17 percentARLINGTON, VA, July 23, 2020 — E*TRADE Financial Corporation (NASDAQ: ETFC) todayannounced results for its second quarter ended June 30, 2020, reporting net income of 196million, diluted earnings per common share of 0.88, and total net revenue of 716 million.“The second quarter was extraordinary as we achieved levels of customer engagement that arewithout precedent in our nearly 40-year history. In the first six months of the year we have setsix sequential records for both total and derivative DARTs, resulting in over a million DARTs forthe second quarter, and culminating in over 1.1 million DARTs in the month of June. Thevolumes we achieved in derivatives alone surpassed our DARTs across all securities types fromjust a few years ago. Furthermore, the blistering pace of account and asset growth continued inthe second quarter, with 13.6 billion in net new retail assets, and 327,000 net new retailaccounts, bringing our year-to-date retail asset flows to 31.9 billion and account growth to656,000. We generated greater retail organic asset growth in the first half of this year alone thanin the previous two years combined, and generated more retail organic account growth than theprevious five years combined. The second quarter was also a standout for our CorporateServices channel, as we generated record participant proceeds and made remarkable headwayin retaining those proceeds – reflecting the success of our executive services offering, ongoingenhancements to the participant experience, and increases in retail engagement across theboard. On a trailing twelve-month basis, we have seen proceeds retention march steadilyupward from its historical 15% to end this quarter at an astounding 24%.” said Mike Pizzi, ChiefExecutive Officer. “In concert with our efforts to continue capturing market share, we arediligently preparing to close our merger with Morgan Stanley, which is anticipated to occur in the
E*TRADE Financial Corporation Announces Second Quarter 2020 ResultsPage 2fourth quarter of this year. We obtained shareholder approval for the merger last week, andalong with Morgan Stanley, are working to obtain the remaining required regulatory approvals.”“We delivered strong financial results on top of continued record setting operating metrics,” saidChad Turner, Chief Financial Officer. “We generated our highest period ever of revenue fromtrading-related activity, which more than offset the quarter-over-quarter pressure on net interestincome, given the Fed's recent rate cuts to near zero. While we remain prudent on managingexpenses as we navigate this low interest rate environment, we continue to opportunisticallyinvest in sales and marketing to maintain the tremendous momentum in growth of accounts,assets, and deposits amid an environment that is particularly ripe for franchise growth.”“With yet another quarter of record growth now etched into our history, our model proves itsmight once again, illustrating that we continue to reach previously unthinkable heights in servingdigitally-inclined retail investors and institutional clients,” continued Mike Pizzi. “In setting oursights on the horizon, we look forward to joining forces with Morgan Stanley – following theanticipated fourth quarter close – creating an unparalleled leader in wealth management andworkplace solutions. As the original place to invest online, E*TRADE invented a category nearlyforty years ago, and continued to leverage its digital ethos to improve myriad corners of thefinancial services industry, including investing, trading, stock plan administration, RIA custody,and student loan benefits. It is thrilling to contemplate what we can achieve within the umbrellaof a world-class financial services powerhouse.”The Company also declared a quarterly cash dividend of 0.14 per share on the Company'soutstanding shares of common stock. The dividend is payable on August 25, 2020, toshareholders of record as of the close of business on August 19, 2020.In lieu of a conference call, the Company published supplementary materials to its corporatewebsite. Historical metrics and financials can also be found on the E*TRADE Financialcorporate website at about.etrade.com.
E*TRADE Financial Corporation Announces Second Quarter 2020 ResultsPage 3About E*TRADE FinancialE*TRADE Financial and its subsidiaries provide financial services including brokerage andbanking products and services to traders, investors, stock plan administrators and participantsand registered investment advisers (RIAs). Securities products and services are offered byE*TRADE Securities LLC (Member FINRA/SIPC). Commodity futures and options on futuresproducts and services are offered by E*TRADE Futures LLC (Member NFA). Managed AccountSolutions are offered through E*TRADE Capital Management, LLC, a Registered InvestmentAdviser. Bank products and services are offered by E*TRADE Bank, and RIA custody solutionsare offered by E*TRADE Savings Bank, both of which are federal savings banks (MembersFDIC). Employee stock and student loan benefit plan solutions are offered by E*TRADEFinancial Corporate Services, Inc. More information is available at www.etrade.com. ETFC-E###Important NoticesE*TRADE, E*TRADE Financial, E*TRADE Bank, E*TRADE Savings Bank, and the E*TRADElogo are trademarks or registered trademarks of E*TRADE Financial Corporation.Forward-Looking StatementsThis press release contains forward-looking statements made pursuant to the Safe HarborProvisions of the Private Securities Litigation Reform Act of 1995. The statements contained inthis press release that are forward looking, including statements regarding the Company's futureplans and its ability to gain market share and manage expenses, pay additional dividends in thefuture, and the consummation of the proposed transaction with Morgan Stanley and theanticipated benefits thereof, are “forward-looking statements” within the meaning of the federalsecurities laws, and are subject to a number of uncertainties and risks. Actual results may differmaterially from those indicated in the forward-looking statements. The uncertainties and risksinclude, but are not limited to: risks related to macro trends of the economy in general; marketvolatility and its impact on trading volumes; fluctuations in interest rates; potential systemdisruptions and security breaches; our ability to attract and retain customers and develop newproducts and services; increased competition; increased restrictions resulting from financialregulatory reform or changes in the policies of our regulators, including with respect to approvalof any future dividend; the consummation of the proposed transaction with Morgan Stanley andthe anticipated benefits thereof; adverse developments in litigation or regulatory matters; thetiming and duration of, and the amount of cash expended in connection with dividend payments;the extent to which a disease pandemic, such as the coronavirus (COVID-19) outbreak, andmeasures taken in response thereto could materially adversely affect our business, results ofoperations and financial condition; and the other factors set forth in our annual report on Form10-K and subsequent reports on Forms 10-Q and 8-K, filed with the US Securities andExchange Commission (including information under the caption “Risk Factors”). Any forwardlooking statement included in this release speaks only as of the date of this communication; theCompany disclaims any obligation to update any information, except as required by law. 2020 E*TRADE Financial Corporation. All rights reserved.
E*TRADE Financial Corporation Announces Second Quarter 2020 ResultsPage 4E*TRADE FINANCIAL CORPORATIONConsolidated Statements of Income(In millions, except share data and per share amounts)(Unaudited)Three Months EndedSix Months EndedJune 30,March 31,June 30,202020202019June 30,20202019Revenue:Interest income Interest expenseNet interest incomeCommissionsFees and service chargesGains (losses) on securities and other, netOther revenue409 443 560 852 02432052031264082442320(64)43(53)1113122424Total non-interest income328307195635458Total net 332Advertising and market development645648120102Clearing and servicing4744329162Professional services3023265348Occupancy and ation and amortization2423214742344781515153030Provision (benefit) for credit lossesNon-interest expense:Compensation and benefitsFDIC insurance premiumsAmortization of other intangiblesRestructuring and acquisition-relatedactivities216—18—Other non-interest expenses2031235141Total non-interest ncome before income tax expenseIncome tax expenseNet income 196 —Preferred stock dividends181 219 —20377 2050920Net income available to commonshareholders 196 161 219 357 489Basic earnings per common share 0.89 0.73 0.90 1.61 2.00Diluted earnings per common share 0.88 0.72 0.90 1.61 2.00Weighted average common sharesoutstanding:Basic (in ed (in ends declared per common share 0.14 0.14 0.14 0.28 0.28
E*TRADE Financial Corporation Announces Second Quarter 2020 ResultsPage 5E*TRADE FINANCIAL CORPORATIONConsolidated Balance Sheets(In millions, except share data)(Unaudited)ASSETSCash and equivalentsCash segregated under federal or other regulations June 30,December 31,202020194365,570 7501,879Available-for-sale securities19,99219,501Held-to-maturity 953563392,5092,510405433Margin receivablesLoans receivable,net(2)Receivables from brokers, dealers and clearing organizationsProperty and equipment, netGoodwillOther intangibles, netOther assetsTotal assets1,7631,370 70,371 61,416 43,667 38,606LIABILITIES AND SHAREHOLDERS' EQUITYLiabilities:DepositsCustomer payables15,67112,849Payables to brokers, dealers and clearing organizations1,524893Corporate debt1,4121,410Other l paid-in-capital4,3284,416Retained earnings1,8431,464(42)(28)Total liabilitiesShareholders' equity:Preferred stock, 0.01 par value, 1,000,000 shares authorized,403,000 shares issued and outstanding at both June 30, 2020 andDecember 31, 2019, respectively; aggregate liquidation preferenceof 700 at both June 30, 2020 and December 31, 2019, respectivelyCommon stock, 0.01 par value, 400,000,000 shares authorized,221,092,693 and 222,622,333 shares issued and outstanding atJune 30, 2020 and December 31, 2019, respectivelyAccumulated other comprehensive lossTotal shareholders' equityTotal liabilities and shareholders' equity6,820 70,3716,543 61,416
E*TRADE Financial Corporation Announces Second Quarter 2020 ResultsPage 6Key Performance Metrics(3)Corporate (dollars in millions)Qtr ended6/30/20Operating margin %(4)Adjusted operating margin%(4)Employees36 %1%43 %(6)%37 %37 %—%42 %(5)%4,11613 %equity(5)Qtr ended6/30/19Qtr ended6/30/20vs.6/30/1937 %4,178Return on common equity(5)Adjusted return on commonQtr ended3/31/20Qtr ended6/30/20vs.3/31/2013 %2%11 %2%12 %1%4,261(2)%15 %(2)%14 %(1)%Common equity book value per share(6) 27.73 26.385% 25.758%Tangible common equity book value pershare(6) 16.72 15.2610 % 15.359%Cash and equivalents 436 1,105(61)% 38015 %Corporate cash(7) 377 438(14)% 32317 %Average interest-earning assets 60,604 56,662256282Net interest margin (basis points)Customer Activity (dollars in billions)Qtr ended6/30/20Qtr ended3/31/207 % 61,361(26)Qtr ended6/30/20vs.3/31/20320Qtr ended6/30/19(1)%(64)Qtr ended6/30/20vs.6/30/19Customer directed trades (MM)(8)63.640.457 %17.3268 %Trading days63.062.0N.M.63.0N.M.1,009,956657,18354 %274,838267 %253,32025%187,08028%35 %(3)%91,35833%177 tive DARTs %(8)(9)Margin receivables 9.4 7.329 %
E*TRADE Financial Corporation Announces Second Quarter 2020 ResultsPage 7Key Performance Metrics(3)Customer Activity (dollars in billions)Gross new retail accountsGross new advisor services accounts(10)Gross new corporate services accountsGross new accountsNet new retail accountsQtr ended6/30/20vs.3/31/20Qtr ended6/30/19Qtr ended6/30/20vs.6/30/19Qtr ended6/30/20Qtr ended3/31/20393,540431,937(9)%143,205175 )%484,315531,354(9)%241,368101 ,745)5%53N.M.Net new corporate services 2)%70,017409 %Net new advisor servicesNet new accountsEnd of period retail accounts5,825,2655,498,5966%5,122,66914 %End of period advisor services accounts(10)140,904144,453(2)%151,275(7)%End of period corporate services 590,0055%7,127,81911 %End of period accountsNet new retail account growth rate23.8 %25.4 %(1.6)%2.7 %21.1 %Net new advisor services account growthrate(10)(9.8)%(10.1)%0.3 %0.1 %(9.9)%Net new corporate services accountgrowth rate6.8 %8.0 %(1.2)%7.9 %(1.1)%Net new total account growth rate18.8 %20.1 %(1.3)%4.0 %14.8 % 18.3(26)% 1.7N.M.(0.1)—% 17.9(25)% 1.6N.M.Net new retail assets(11)Net new advisor services 13.6 13.5assets(10)(11)Net new retail and advisor servicesassets(0.1)(0.4)75 %Net new retail assets growth rate16.9 %20.2 %(3.3)%2.1 %14.8 %Net new advisor services assets growthrate(10)(2.1)%(7.1)%5.0 %(1.2)%(0.9)%Net new retail and advisor servicesassets growth rate15.9 %18.8 %(2.9)%1.9 %14.0 %Retail AssetsSecurity holdingsCash and depositsRetail assets 307.691.0 238.682.629 % 10 %268.261.215 %49 % 398.6 321.224 % 329.421 % 17.0 14.616 % 18.4(8)%1.020 %19.4(6)%Advisor Services AssetsSecurity holdingsCash and depositsAdvisor services assets(10)1.2 18.22.0 16.6(40)%10 %
E*TRADE Financial Corporation Announces Second Quarter 2020 ResultsPage 8Key Performance Metrics(3)Qtr ended6/30/20Customer Activity (dollars in billions)Qtr ended3/31/20Qtr ended6/30/20vs.3/31/20Qtr ended6/30/19Qtr ended6/30/20vs.6/30/19Corporate Services AssetsVested equity holdings Vested options holdingsCorporate services vested assets 57.5 Unvested holdingsCorporate services assets134.0191.5 173.597.637 % 95.341 %38.251 %47.022 %135.841 % 142.335 %113.753 %117.048 % 365.0 249.546 % 259.341 % 324.692.2 253.284.628 % 9%286.662.213 %48 % 416.8 337.823 % 348.819 %135.841 %142.335 % 473.628 % 491.124 %Total Customer AssetsSecurity holdingsCash and deposits(12)Retail and advisor services assetsCorporate services vested assetsRetail, advisor services, and corporateservices vested assetsCorporate services unvested holdingsTotal customer assets191.5 608.3113.753 %117.048 % 781.8 587.333 % 608.129 % (6.4) (1.9)N.M. (0.5)N.M.0.2N.M.(0.3)N.M.173.5Net (buy) / sell activityRetail net (buy) / sell activityAdvisor services net (buy) / sell activity(0.9)1.0(7.3)(0.9)Dow Jones Industrial Average25,81321,91718 %26,600(3)%Nasdaq Composite10,0597,70031 %8,00626 %3,1002,58520 %2,9425%Net (buy) / sell activity N.M.N.M. Market IndicesStandard & Poor's 500
E*TRADE Financial Corporation Announces Second Quarter 2020 ResultsPage 9Qtr ended6/30/20CapitalQtr ended3/31/20Qtr ended6/30/20vs.3/31/20Qtr ended6/30/19Qtr ended6/30/20vs.6/30/19E*TRADE Financial6.7 %6.8 %(0.1)%6.7 %—%Common Equity Tier 1 capital ratio(13)29.4 %29.3 %0.1 %33.9 %(4.5)%Tier 1 risk-based capital ratio(13)34.9 %35.1 %(0.2)%40.4 %(5.5)%Total risk-based capital ratio(13)34.9 %35.1 %(0.2)%40.7 %(5.8)%Tier 1 leverage ratio(13)E*TRADE BankTier 1 leverage ratio(13)7.2 %7.4 %(0.2)%7.3 %(0.1)%Common Equity Tier 1 capital ratio(13)34.9 %35.8 %(0.9)%40.2 %(5.3)%Tier 1 risk-based capital ratio(13)34.9 %35.8 %(0.9)%40.2 %(5.3)%34.9 %35.8 %(0.9)%40.5 %(5.6)%Total risk-based capitalratio(13)
E*TRADE Financial Corporation Announces Second Quarter 2020 ResultsPage 10Average Balance Sheet Data(dollars in millions)Three Months EndedJune 30, 2020Cash and equivalentsCash segregated under federal or otherregulationsInvestment securitiesMarch 31, lanceInc./Exp.Yield/CostBalanceInc./Exp.Yield/Cost 633 —0.14 % 767 21.01 %5,46730.20 %2,58681.26 %43,5712722.50 %41,0332852.78 %Margin receivables8,039683.40 %9,361944.04 %Loans1,515164.18 %1,564215.36 %Broker-related receivables and other1,379—0.13 %1,35141.24 %60,6043592.37 %56,6624142.93 %—50—2960,60440956,6624433.13 %50.06 %Total interest-earning assetsOther interest revenue(a)Total interest-earning assetsTotal non-interest earning assetsTotal assets2.70 %7,1726,673 67,776 63,335Sweep deposits:Brokerage sweep deposits 36,684Bank sweep depositsSavings deposits 20.02 % 31,641 232—0.13 %3,307131.63 %1,692—0.01 %2,23430.45 %1,700—0.02 %1,603—0.02 %16,92110.02 %14,07640.13 %976—0.01 %836—0.03 %61N.M.51N.M.1,411133.87 %1,411143.86 %59,622170.11 %55,113400.29 %—4—3Total interest-bearing liabilities59,6222155,113430.31 %Total non-interest-bearing liabilities1,4611,86161,08356,9744002.82 %Other depositsCustomer payablesBroker-related payables and otherOther borrowingsCorporate debtTotal interest-bearing liabilitiesOther interest expense(b)Total liabilitiesTotal shareholders' equity0.14 %6,6936,361Total liabilities and shareholders' equity 67,776 63,335Excess interest earning assets over interestbearing liabilities/ net interest income/ netinterest margin 982 3882.56 % 1,549 (a)Other interest revenue is earned on certain securities loaned balances. Interest expense incurred on other securities loanedbalances is presented on the broker-related payables and other line item above.(b)Other interest expense is incurred on certain securities borrowed balances. Interest income earned on other securitiesborrowed balances is presented on the broker-related receivables and other line item above.
E*TRADE Financial Corporation Announces Second Quarter 2020 ResultsPage 11Three Months EndedAverage Balance Sheet DataJune 30, 2019(dollars in 32.33 %87162.63 %Investment securities47,3753683.11 %Margin receivables10,0841305.17 %1,920285.75 %65932.23 %61,3615383.51 %—22Total interest-earning assets61,3615603.66 %Total non-interest-earning assets5,093180.20 %Cash and equivalentsCash segregated under federal or other regulations AverageLoansBroker-related receivables and otherTotal interest-earning assetsOther interest revenue(a)Total assets452 66,454 37,380 Sweep deposits:Brokerage sweep depositsBank sweep deposits(b)Savings depositsOther depositsCustomer payablesBroker-related payables and otherOther borrowingsCorporate debtTotal interest-bearing liabilitiesOther interest expense(c)Total interest-bearing liabilitiesTotal non-interest-bearing liabilities ———%6,347231.47 %1,732—0.03 %10,59380.31 %1,05010.46 %31243.78 %1,410144.06 %58,824680.47 %—258,824700.48 %4903.20 %1,016Total liabilities59,840Total shareholders' equity6,614Total liabilities and shareholders' equity 66,454Excess interest earning assets over interest bearing liabilities/ net interestincome/ net interest mar
FDIC). Employee stock and student loan benefit plan solutions are offered by E*TRADE Financial Corporate Services, Inc. More information is available at www.etrade.com. ETFC-E # # # Important Notices E*TRADE, E*TRADE Finan
