Transcription
FIXED INCOME INVESTORPRESENTATIONFY 2020
Classification: LimitedGroup Overview2
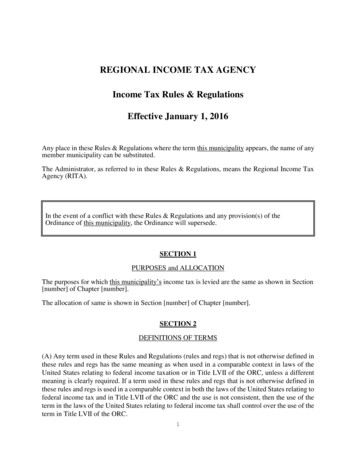
Classification:ResultsLimitedGroup OverviewCapital, Funding &LiquidityAppendixSimple group structure with multiple issuance pointsHoldCoLloyds Banking GroupMain EntitiesRatings1Example ProductsA3 / BBB / A Neg / Neg / NegP-2 / A-2 / F1Senior UnsecuredCapital-Ring-Fenced Sub-GroupNon-Ring-Fenced Sub-GroupInsurance Sub-GroupEquity Investments Sub-GroupLloyds Bank, Bank of ScotlandLloyds Bank Corporate MarketsScottish WidowsLloyds Equity InvestmentsA1 / A / A Sta / Neg / NegP-1 / A-1 / F1A1 / A / A Sta / Neg / NegP-1 / A-1 / F1A2 / A / AA-2Sta / Neg / Neg- / A-1 / F-1--Senior UnsecuredCovered BondsABSCD, CPSenior UnsecuredCD, Yankee CD, CPCapital---L&A: 488bn4,5Assets: 608bn5L&A: 25bn5Assets: 99bn5L&A: N/AAssets: 172bn3,5L&A: N/AAssets: 4bn5EU sub: BerlinEU sub: FrankfurtEU sub: Luxembourg1 - Ratings shown as Moody’s/S&P/Fitch. 2 – Rating shown is for Scottish Widows Ltd Insurance Financial Strength Rating. 3 – Insurance assets includes Wealth. 4 – “L&A” refers to Loans & Advances to Customers and banks. 5 – L&A & Total Assets as atH1 2020, except for Scottish Widows and LEIL which is as at FY 2020. FY 2020 figures for Lloyds Bank, Bank of Scotland and Lloyds Bank Corporate Markets to be disclosed on 11 th March 2021.3
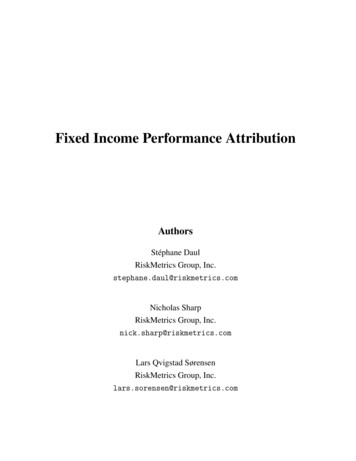
Classification: LimitedGrowth in customer franchise, with further opportunities in targeted areasChannels market shareDigital new business volumes11Branch new business volumes19%27%Product market shareConsumer credit card balancesPCA deposit balancesSME and small business lending balancesMortgage balances (open book)Mid corporate main bank relationshipsSavings balances2Consumer loan balancesHome insurance (flow)3Black Horse car finance balancesCorporate pensions (flow)Individual annuities (flow)Merchant acquiring volumes (flow)Individual pensions & drawdown (flow)4Wealth management emarketshare5: 19%5%3%2%RetailCommercial BankingInsurance & Wealth1 – Average volume share across PCAs, loans, savings, cards and home insurance. 2 – Comprises unsecured personal loans, overdrafts and Black Horse retail lending balances. 3 – Annualised Premium Equivalent newbusiness on an estimated whole of market basis. 4 – Excludes execution-only stockbrokers. 5 – Average market share calculated for core financial services products. Market data sources: ABI, BoE, CACI, Compeer,eBenchmarkers, Experian pH, FLA, Ipsos MORI FRS, Spence Johnson, UK Finance and internal estimates. Note: Market shares as of Dec 2020 with exception of PCA and Savings (Nov 2020);4Merchant acquiring volumes (Oct 2020); Individual annuities and Individual pensions & drawdown (Sep 2020); Wealth management AuA (Dec 2019).
Classification: LimitedSupporting all stakeholders in 2020Successfully supporting customers, colleagues andcommunities through the pandemic 12bnGovernment-backed loans for businesscustomers1Strength of business modelenabling continued delivery Digital leader, with accelerated transformation Record customer satisfactionc.1.3mPayment holidays across Mortgages, Cards,Motor Finance and Loans2 750kBranch outreach wellbeing calls tocustomers Enhanced franchise strength through the pandemic; 50kColleagues working from home for most of2020 All time high employee engagement score; above UKDonated to help communities through ourcharitable Foundations Well positioned to support sustainable and inclusive 25.5m1 – Data as at 12 Feb 2021. 2 – Cumulative payment holidays granted as at 17 Feb 2021. Continued efficiency enabling increased investment 39bn deposit growthhigh performing normnational recovery5
Classification: LimitedHelping Britain Prosper is at the heart of who we are and underpins our businessDriving sustainability Strategy to help thetransition to a sustainable low carbon economylaunched in 2018 10mhomes that could bepowered as a result ofour support to renewableenergy projects in 20182020 5.7bnin green financeprovided in 20182020Supporting customers Helping Britain get ahome and supporting businesses to startand growc. 40bnof lending to helppeople buy their firsthome in 2018-2020Championing diversity First FTSE100 company to set publicgender, Black, Asian and Minority Ethnic and specific Blackcolleague targets37%women in seniorroles; up from 28%in 2014c.8%Black, Asian & MinorityEthnic colleagues insenior roles; up fromc.6% in 2018Strengthening communities Tackling socialdisadvantage across Britain through ourcharity partnerships and staff volunteering 265k 76m1.8mbusinessessupported to startup in 2018-2020donated to ourindependentFoundations in2018-2020individuals, SMEsand charities trainedin digital skills in2018-2020Note: examples of our social and environmental initiatives and Helping Britain Prosper Plan achievements.6
Classification: Limited2020 highlights show significant progress across our ESG ambitions Ambitious goal to help reduce emissions we finance by 50% by 2030, on path to net zeroby 2050 or soonerEnvironmental Developed three new operational climate pledges including net zero carbon operations by2030 Calculated initial estimate of our 2018 financed emissions baseline covering c.70% ofGroup’s balance sheet1 Through Scottish Widows announced 440m divestment from companies that fail to meetour ESG standardsSocial Launched our Race Action Plan to help drive cultural change, recruitment and progressionacross the Group First FTSE100 company to set a public goal for senior roles held by Black colleagues (3%by 2025) Developed new gender and ethnic diversity aspirations for colleagues in senior roles 51m total community investment, including 25.5m for our four independent charitableFoundationsESG Ratingsimproved over2020 MSCI ratingimproved to AAfrom BBB Sustainalyticsscore improvedto 23.3 from24.4 (mediumrisk) Leadership succession confirmed with Board approving appointment of new Group Chair andnew Group CEOGovernance Comprehensive shareholder engagement incl. Board Governance Event and retail investorbriefing Employee engagement at all-time high at 81% reflecting continued support to colleagues New ESG Report, including enhanced TCFD disclosures and new SASB index1 – Excluding Insurance & Wealth7
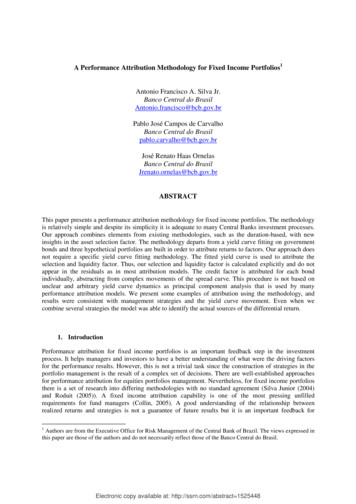
Classification: LimitedEconomy supported by Government actions with strong housing marketLBG customers’ card spend2HPI & mortgage market completions1(5-day rolling average, % change vs same period a year earlier)MortgageCompletions ( bn)HPI (%)100%8%3025201510506%4%2%0%1 Jan 20Mortgage Completions-50%-100%1 Jan 20Total Credit CardFood and DrinkFurloughedemployments per dayUnemploymentrate (%)6%8,000,0004.8%Total Debit CardRestaurantsHolidays31 Jan 21Households deposit & credit growth4Unemployment rate & employment furloughed34.9%(% change vs same period a year earlier)12%10%5.0%5%4.5%8%6%4,000,0002,000,000 4.0% 4.0%4.0%0Feb0%31 Dec ly furloughed4%JulPartially furloughedAugSepOctUnemployment rateNov0%201520162017Deposits201820192020Lending1 – Sources: Bank of England, non seasonally adjusted; Halifax HPI, non seasonally adjusted percentage change from Dec 2019. 2 – Excludes financial services spend and MBNA. 3 – Sources: HMRC & ONS.4 – Source: Bank of England, growth measure, excludes write-offs.8
Classification: LimitedBusiness transformed by our clear strategic path since 2011GSR1 (2011-2014)GSR2 (2015-2017)PurposeKeystrategicactionsGSR3 (2018-2020)Helping Britain ProsperReshape our portfolioCreate the best customer experienceLeading customer experienceSimplify the GroupBecome simpler and more efficientDigitising the GroupInvest in core businessDeliver sustainable growthMaximising Group capabilitiesTransforming ways of workingStrengthen balance sheet & liquidity 60%Increase in all channel NPSsince 20111Clearoutcomes81% 7bn9.1ppEmployee engagement index; 29pp since 20112Cumulative strategicinvestmentIncrease in CET1 ratiosince 2010417.4m 20% 50%Digital active users;Largest UK digital bankReduction in operating costssince 20103; market leading CIRReduction in RWAssince 201041 – Comparable NPS not available for 2010. 2 – Measurement began in 2011. 3 – 2010 excludes TSB. 4 – 2010 restated to reflect current rules. 12bnCapital returnedto shareholders since 20149
Classification: LimitedOur strategic progress has created capabilities that position us well for the futureEfficiency has created capacity for new investment andopportunitiesOur core capabilitiesPurpose driven, customer focusedbusiness modelDifferentiated and sustainable franchiseDigital leadershipEfficiency and investment focusedLow risk businessWell positioned for Strategic Review 202110
Classification: LimitedFinancial Update11
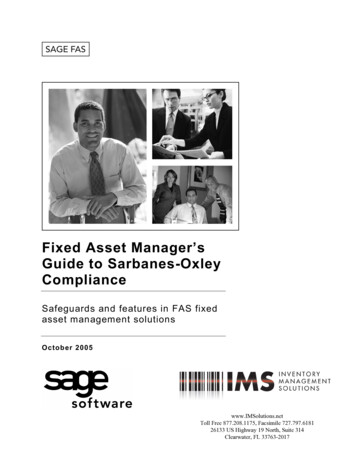
Classification: LimitedResilient business model, returning to profitability in the second halfQ4 2020120201Net income 3.6bn 6% 14.4bn(16)%Cost:income ratio(incl. remediation)59.9% 3.0pp55.3% 6.8ppPre-provisionoperating profit 1.4bn(2)% 6.4bn(27)%Impairment 128m 4.2bnStatutory profitbefore tax 792m(24)% 1,226m(72)%Statutory return ontangible equity27.2%(0.2)pp3.7%(4.1)ppTNAV52.3p 0.1p52.3p 1.5pCET1 ratio NII of 10.8bn down 13%, driven by lower rates andchanging asset mix. 2020 NIM 2.52%; Q4 NIM 2.46% Other income 4.5bn; down 21% with lower customeractivity and lower non-recurring items Total costs of 8.0bn, down 4% Impairment up, impacted by economic outlook; belowQ3 guidance Statutory profit before tax of 1.2bn Strong balance sheet and capital build- Increase of 39bn in customer deposits; loan:depositratio of 98%- RWAs stable- CET1 ratio 16.2%; significantly above requirements16.2%1 – Q4 2020 variance quoted against Q3 2020; 2020 variance quoted against 2019. 2 – Existing basis. FY 2020 2.3% and Q4 2020 5.9% on new basis.12
Classification: LimitedStrong customer franchise: resilient lending and Retail deposit growth ahead ofmarket2020 deposit change2020 lending changeRetail 1.5bn Mortgage balances up 5.2bn, to 293.8bn; including Q4( bn)( bn)Commercial- 2.2bnRetail 30.8bnCommercial 7.8bnopen book growth of 6.7bn Credit card balances down 3.4bn, to 14.3bn; including0.76% reduction in H20.6 SME balances up 8.5bn, predominately driven by BBLs9.68.5 Corporate and Institutional balances decline a result of5.2continued optimisation and reduced RCF4 demand0.3(1.2)(3.4)(0.9)20.5- Retail deposits up 30.8bn, reflecting low spend and12.8(0.9) Total deposits up 38.9bninflows to trusted brands, ahead of market(8.6)- SME deposits up 12.8bn, partially driven byGovernment-backed lending held on deposit(4.0)(1.3)MortgagesSME2Credit cardsMid CorporatesRetail current a/cMotor financeCIC3Retail relationshipsOther1OtherRetail tacticalSME2Mid CorporatesCIC3- Corporate and Institutional deposit reduction driven bypricing optimisation Flat to modest AIEA growth expected in 2021Other1 – Includes Unsecured loans, Overdrafts and primarily Europe. 2 – Retail Business Banking included within SME for reporting purposes. 3 – Corporate and Institutional Clients. 4 – Revolving Credit Facility.13
Classification: LimitedRate and yield curve headwinds, partly offset by strong mortgage activityNet interest income and banking net interest margin( m) 2020 NII 10.8bn, down 13% on prior year; NIM at 252bps28812,377(657)2019(375)Asset spread& mix252- NIM decrease impacted by lower rates and asset mix10,773- Q4 NIM of 2.46% ahead of guidance; benefitting fromlower funding costs, strong mortgage margins andCorporate and Institutional lending balance reductions(572)Liability spread Wholesale funding& mix& other12020NIM (bps)Q4 Net interest marginhelping offset back book attrition4 bps2 NIM expected to be in excess of 240bps in 2021- Strength in mortgage new business margins continuing,(bps)242- Q4 AIEAs broadly stable at 437bn122246- Unsecured balances likely to fall in H1 before recoveringin H2(3)- Continued optimisation in Commercial- High quality deposit growth reducing other funding needsQ3 20Rates(incl. erfunding1 – Includes income on the Group’s structural hedge and non-banking net interest income.Q4 20- Structural hedge headwinds in a lower rate environment14
Classification: LimitedIncreased hedge capacityHedged balances1( bn)185190210179180186606062909094293030H2 2019Structural hedgeH1 2020H2 20204544844943003103061121311454243Balance sheet notionalH1 202043H2 2019Shareholders’ equity Structural hedge notional balance of 186bn- c.2.5 year weighted average life, up from c.2 years in Q3 Hedge capacity of 210bn, increase of 25bn in 202038% 24bn unhedged capacity provides flexibility Income of 2.4bn from structural hedge in 2020 c. 60bn of maturities and hedge income expected tobe c. 400m lower in 2021Current accounts Materially lower income headwind from hedge in 2022and 2023 based on expected maturities and yield curveH2 2020Other customer depositsHedge capacity1 – The external sterling structural hedge notional is managed as a portfolio, split shown is indicative.15
Classification: LimitedOther income stabilising, geared to customer activity and ongoing investmentOther income( bn) Other income 4.5bn; impacted by lower customer activityand lower non-recurring items vs. 20191.21.21.11.0- Retail impacted by lower interchange income and Lex fleetvolumesQ1 20Q2 20- Lower transaction banking volumes in CommercialQ4 20Q3 20- Insurance & Wealth impacted by lower new business,assumption changes and reduction in non-recurring items;including AMMR1 chargeDivisional other income( bn) Q4 improvement in markets activity and LDC performance,20201.71.31.3in part offset by Insurance assumptions review4.5 Activity expected to recover in 2021 with gradual easing ofrestrictions20192.01.42.05.7 Ongoing investment to build the business and increasediversification over medium termRetailCommercial BankingInsurance & WealthAsset sales and Other1 – Asset Management Market Review.16
Classification: LimitedContinued strong focus on costs, alongside investment in the future of the businessTotal costs( m)(4)%8,320 Total costs of 8.0bn down 4% with operating costs4% lower and remediation costs 15% lower103(45)(238)7,964 BAU costs 4% lower, driven by sustained cost(110)(66)2019CostsavingsPay &inflationInvestment& dep’nOther Remediation2020accelerates opportunity in the medium term- Covid-related costs and compensation headwinds in( bn)9.68.320102021 of 100m to 19201920202020BAU costsreduction delivery, lower remuneration; partially offsetby increased pensions and Covid-related costs Covid has created near term challenges, butOperating costs over time11.3 Delivery on operating cost target of 7.6bn- Travel savings from new working patterns- Acceleration of new technology adoption and propertyoptimisation plans Operating costs to reduce further to c. 7.5bn in 2021Investment and depreciation1 – 2010 to 2017 adjusted to reflect the impact of IFRS 16.17
Classification: LimitedCommitted to further efficiency improvements, supporting continued investmentProven record of managing costsCost framework presents opportunities(BAU costs1, bn)BAU costs Productivity and 3rd party management (e.g.(24)%6.86.56.1 Rigorous matrix approach to BAU ng –Medium-term)suppliers) improvements to continue Covid relief costs to continue but increasingautomation improves efficiency (e.g. BBLs) One-off pandemic costs unlikely to be repeated(e.g. overtime, IT equipment) New ways of working (e.g. travel) Further adoption of new technologies likely to2014201520162017ResourceIT & Ops20182019Property3rd party2020Strategicopportunityenabled byinvestmentOther BAU(Medium-term)drive transformational shift in costs (e.g. cloud) Customer behaviour driving future distributionstrategy; expect to rationalise while maintaininglargest branch network in the UK Property footprint reducing as we adopt newworking patterns1 – 2014 to 2018 adjusted to reflect the impact of IFRS 16.18
Classification: LimitedSolid underlying impairment performance, with lower charges expected in 2021Impairment charges ( m)2020Q4 202019Incr. vs 2019Charges pre-updated MES1,6104181,291319 Stable observed credit experience in Q41,3593831,038321- Support schemes remaining 4(259)–2,2341,025(417)2–1,025Commercial Banking809(42)2–809uncertainties around outcomesManagement overlay400200–400 Base case univariate sensitivities:4,2471281,2912,956RetailCommercial BankingOtherCoronavirus impactedrestructuring cases1Updated economic outlookRetailTotal impairment charge Improved outlook since Q3 and FY impairment chargelower than expected at Q3- Peak unemployment forecast now 8.0% in Q3 2021 (9.0%at Q3)- HPI outturn in 2020 of 5.9% (2.0% at Q3) Additional 400m overlay incorporated, reflecting wider- 1% increase in unemployment 205m- 10% decrease in HPI 284mExpectedcredit lossProb.-weightedWeightingBalance sheetECL 6,860mUpsideBase CaseDownsideSeveredownside30%30%30%10% 5,766m 6,354m 7,468m 9,838m Based on current assumptions, 2021 impairmentexpected to return closer to pre-pandemic levels withnet asset quality ratio to be below 40bps1 – Further charges on existing material cases in restructuring at the end of 2019 where coronavirus has directly hampered the recovery strategy. 2 – Divisional impacts in Q4 include 659m benefit from improvedeconomic outlook offset by incorporation of 200m severe overlay adjustment previously held centrally.19
Classification: LimitedBuilding coverage ratios across product areas( m)ECL2020Net ECLincreaseP&LchargeWrite-offs& otherECL2019Retail4,0081,2122,384(1,172)2,796UK 994,247(1,548)4,161Commercial Stock of ECL provisions 6.9bn, providingsignificant balance sheet resilience- Stock of Stage 1&2 ECL up 2.1bn in 2020covering anticipated losses yet to emerge Write-offs at pre-crisis levels (FY 2019 1.6bn) Overall coverage strengthened to 1.4% of totallending and 28.1% on Stage 3 assets2019CoverageTotalTotal 86% of Retail Stage 2 up to date, 98% in22.5%1.1%0.8% Coverage on Cards portfolio of 6.4%, up .4%0.8%Coverage (excl. Recoveries)Drawn( bn)1ECL( m)1Stage 1Stage 2Stage 3Retail354.54,0080.3%4.3%UK ommercialin 2020, with proactive charge-off policy at4 months in arrears- Stage 3 Cards coverage increased to 59%- Equivalent 12 month charge-off policy increasesCards Stage 3 coverage to 73%, overall to 8.8%31 – Loans and advances to customers only; excludes 28m of ECL on other assets at 31/12/2020 ( 19m at 31/12/2019). 2 – Includes reverse repos of 58.6bn which dilutes reported Group coverage by 0.1pp.3 – Estimated based on last 12 months charge-offs retained in Stage 3 at appropriate coverage.20
Classification: LimitedStrong performance on payment holidays with over 90% now maturedCurrent status of Retail payment holidays and balances1( bn)PHs granted61.91.72.42.3In-force25.10.10.20.3 Total of c.1.3m payment holidays (PHs) granted on 68bnof lending, of which 6bn (8%) currently in force- 98% of first PHs have matured, of which 89% have1.43.13.7resumed payment- 76% of extended PHs now expired with 88% resumingpayment; 31k customers missing paymentsMatured PHs0.10.10.20.20.20.20.153.80.2 5% (c. 4bn) of matured PHs have missed payments; ofwhich 24k mortgages, 36k cards, 20k loans, 10k motor- Of the matured PHs with missed payments 30% were0.1already in arrears2.01.8 28k PHs granted on 0.8bn of len
1 - Ratings shown as Moody’s/S&P/Fitch. 2 –Rating shown is for Scottish Widows Ltd Insurance Financial Strength Rating. 3 –Insurance assets includes Wealth. 4 –“L&A” refers to Loans & Advances to Customers and banks. 5 –L&A & Total Assets as at H1 2020, ex