Transcription
NPMS Operator WorkshopNovember 18, 2015Welcome, callers. Your lines will bemuted except for designated Q&Aperiods which will occurapproximately every 30 minutes.
Safety and Logistics Emergency Exits Restrooms 15 minute break in the morning and afternoon,lunch will be 12:00‐1:00
Need for Workshop Operators use different systems and methods toprepare their NPMS submissions Operators are concerned about the size of theirsubmissions becoming unmanageable if additionaldata is collected by the NPMS in the future PHMSA needs to gather information about operators’data which will help us design our internal systemsand processes most effectively
Need for Workshop PHMSA staff and operators need to discuss the detailsof Appendix D: submitting NPMS data in LRS format A dialogue about “predominant” as it relates to NPMSdata is needed
OverviewDiscussion formatMorning Introduction, goals, and desired outcomes NPMS innovation showcaseGeospatial data format and LRS submissions LRS 101 for those unfamiliar with the technologyLunch 12:00‐1:00Afternoon Segmentation in geospatial data Generalizing values (predominance) Q&A and wrap‐up
Discussion Leaders Amy Nelson, PHMSA GIS ManagerLeigha Gooding, PHMSA GIS SpecialistKatie Field, Michael Baker InternationalBellinda Monge, Michael Baker InternationalRon Brush, New Century SoftwareChuck Wright, New Century Software
Boundaries Discussion will be limited to technical aspects ofpreparing operators’ data for current or future NPMSsubmissions This is not the forum to discuss any of the proposedattributes or standards in the NPMS InformationCollection Comment period was extended until 11/25 OK for onsite participants to ask questions at anytime, but we have to keep the callers to designatedslots to reduce background noise
Goals and Outcomes Understand how operators are storing data andpreparing their NPMS submissions PHMSA gathers information about operators whouse LRS; Operators gain a better understanding ofhow LRS format submissions could be prepared Understand how operators segment pipelines and Gain a better understanding as to whether collecting“predominant” values is feasible or useful
Q&A regarding introduction(Questions from the roomwill be taken first, thenphone lines will be open)
NPMS Technology ShowcaseLeigha Gooding (PHMSA) & Chuck Wright (New Century Software) 30‐minute showcase of select NPMS projects inorder to: Illustrate how we address existing data challenges Foster transparency and trust by explaining what we dowith operator data submissions Help operators understand the reasoning behind NPMSrequirements and the questions we ask whileprocessing operator data submissions
Unique NPMS Challenges Must standardize information from many different sources INTO LRSWe don’t know what you know so we need to be detectives Your company’s pipeline operationsYour company’s asset salesYour company’s asset constructionYour company’s asset dataMust produce pipe centric information – not just operator centricData from nearly 1,200 different operators 520,000 miles Gas – 313,000Liquid – 207,000Analysis and Cartography with 1 million pipe segmentsDissemination of information Website – Average around 18,000 unique visitors per monthPublic Map Viewer – Average around 20,000 user sessions per monthPIMMA – Average around 900 users sessions per monthGIS data requests‐ Average around 40 fulfilled deliveries per month
Submission Manager
Submission Automation to an extent
General Submission Workflow(QC 1 & QC 2)
Creating Pipeline History Challenge: Record history of pipeline changeswhen NPMS data is replaced on a yearly basis.––––Acquired or divestedChanges in statusChange in commodityImproved spatial location or re‐routes Solution: Change Detection– Custom tool– On a per‐segment basis, matches this year’ssubmission to pipelines in the NPMS national layer– Matches by a combination of spatial location andattribute values
Change Detection Matching Submission feature is buffered to determine whatNPMS features are nearby.– Buffer is iteratively increased if no NPMS features arefound. 14 use case (UC) scenarios are used to identify if thereis a match or not.– For all submission segments– For all NPMS national layer segments for that OPID Each UC has an associated confidence level– Green: high confidence; no analyst interaction needed– Yellow: fairly certain but requires analyst confirmation– Red: low confidence or no match; analyst interactionneeded
Example Use Cases
Change Detection ExampleNo Match in National Layer – New Construction?No Match in New Submission – Sold?Perfect Match to your OPIDMatch to Another Operator’s Pipe – Purchase?
Change Detection ExampleNo Match in National Layer – New Construction? UC 1 ‐ Segment matchSubmission segment and NPMS segment match 1:1OPIDs match exactlyREVIS CD of submission is NOT "J" or "C"STATUS CD of NPMS segment is not "B".No Match in New Submission – Sold?Perfect Match to your OPID UC 3 – New constructionSubmission segment has no 1:1 match found in theNPMS for any OPIDREVIS CD of submission is “J" or "C"STATUS CD of NPMS segment is not "B".Match to Another Operator’s Pipe – Purchase? UC 5 – No match; Changeto soldNPMS segment with same OPID has no 1:1 match foundin submission data. UC 10 – Segment match;Different OPIDSubmission segment and NPMS segment match 1:1OPIDs DO NOT MATCHREVIS CD of submission is NOT "J" or "C"STATUS CD of NPMS segment is not "B".
Change Detection Interface
Impact of Change DetectionMatching When the submission data is loaded to our LRS‐production environment, an unique ID istransferred from the existing feature to thematching submission feature. Resulting in spatial and attribute History on thepipeline– Allows PHMSA to look back in time to see how The spatial location has changed The attributes have changed (OPID, commodity, status, etc.)– Support’s PHMSA’s goal of being pipe‐centric, ratherthan OPID‐centric
Inspection Unit AssignmentPurpose – Link inspection records to NPMS pipes Tag every pipeline with thecorrect Inspection Unit ID(event along centerline) Enable spatial visualizationand analysis of inspectioninformation Support inspectionplanning and risk ranking
Inspection Unit AssignmentChallenges Operator could not submit this attributeNPMS could not rely on consistentgeometry, attributes or segment IDsyear after yearSimilar parallel or intersecting pipes canbelong to different inspection units1 centerline can belong to manyinspection unitsInspection Unit boundaries change
Inspection Unit AssignmentOld IUEventsTool buildsArchivesTool Compares archivesand New Pipe CenterlinesArchive Compare Assign Analyst‐Review Commit
Inspection Unit AssignmentTool Assigns potential Inspection Units with confidence levels to each pipe centerline usingavailable attributes, locations and use casesArchive Compare Assign Analyst‐Review Commit
Inspection Unit AssignmentAnalyst Reviews report and interacts with map to finalize inspection unit assignments andboundary points on each pipe centerlineArchive Compare Assign Analyst‐Review Commit
Inspection Unit AssignmentCommit final unit assignments and event boundaries to production databaseArchive Compare Assign Analyst‐Review Commit
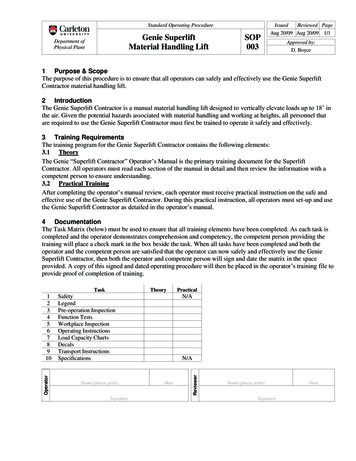
Inspection Unit Modification ToolPurpose Capture and communicate spatial changes to unit boundariesChallenge Inspection personnel define and change inspection unitboundaries from field office locations across the country, manywith little to no GIS experience The NPMS database is only edited by GIS personnel atheadquarters
Inspection Unit Modification Tool
Gas and Liquid Incident Association Tool Link incidents topipelines Build history of incidentsfor a pipe, not only anoperator Pipe centric dataTool accommodatesinitial data productionand maintenance afterchange detection onnew submissions everyyear
PIMMA Open GIS, Google base maps, dynamic search box and right‐click menusView and query pipe history, inspection unit and accident association dataQueries allow for multiple user‐defined criteriaIncorporates information from inspection databases
PIMMA PIMMA on DOT network for internal use by PHMSAUpdating PIMMA on NPMS website with similar technology and select dataand query access in Spring 2016Also planning a mobile application
Typical projects using data from nearly 1200 operators: Hotspot analysis to identify bestlocations for new inspectors andPHMSA officesEstimated dwelling and populationcounts near pipelinesAnalysis to support rulemakings andengineering researchHighway, railway and waterwayanalysisAccident and natural disasterpreparedness and response mappingRisk ranking and inspection planning
Questions?Phone lines will be open after takingquestions from the roomA 15‐ minute break will follow thequestion period
Overview of PipelineLinear ReferencingRon BrushNew Century Software
Goals Define common terminology– Line, Route, Measure, Continuous Station, EngineeringStationing, Station Equation, Piggable Segment– Same definitions as PODS; familiar terms Linear referenced Pipe Centerline Point and Linear Events (not time‐based events) Examples––––PODS RelationalPODS SpatialAPDMUPDM
Linear Referencing One master Centerline is used to identify the geographic and linearreferenced location of the pipeline Point and linear features are positioned on the centerline using thelinear referenced location Used to determine relative linear position of features along N/10.1/index.html#/What is linear yroads.com/signshop58.shtml
Line A pipeline as defined by thebusiness Unique pipeline id, unique name‐Line 100 – ML to Windsor TB Independent of attributes:diameter, product type, material,etc. 2’ to 1000 miles long May pass through multiplefacilities, Counties and StatesPODS Relational:PODS Spatial:APDM:LineLogical LineLoopLogical LineLoop
Route‐ One or more Routes make up a LinePODS Relational:PODS Spatial:APDM:RoutePhysical LineLoopPhysical LineLoop‐ Often Launcher to Receiver –Piggable Segment‐ Compressor Station to Compressor Station32‐ Also a lateral, take‐off, an interconnect‐ Continuous, non‐branching run of pipe‐ Independent of any pipe attributes1Comp. StationComp. Station4
Common Linear ReferencingMethods As‐built Engineering Stationing Milepost Continuous Stationing
Engineering Station ExampleOriginal As‐built stationingLine Route SeriesStationingAB99100 0 00 to 17 00 (Active pipe)AB99200 15 00 to 20 00 (Active pipe)AB100 90005 00 to 15 00 (Abandoned pipe)Station Equation10 0015 00 17 00Back 17 00Ahead 15 00200’ Reroute0 005 0015 0020 00
Continuous Station ExampleTrue 3‐D length of pipe Route from beginning (in Orange)Line Route SeriesStationingAB99100 0 00 to 17 00 (Active pipe)AB99200 15 00 to 20 00 (Active pipe)10 00(1000)15 00 17 00(1500) (1700)Measures0 to 17001700 to 2200Station EquationBack 17 00Ahead 15 00200’ Reroute0 00(0)5 00(500)15 00(1700)20 00(2200)
Graphic Centerline Example Centerline Route Unique Route ID Each Centerline Vertex has 3 coordinates (PolylineM)(Latitude, Longitude, Measure) or (X, Y, M) Measures must be monotonic increasing No multi-part features(x,y,852)(x,y,1520)Route ID 99(x,y,0)(x,y,500)(x,y,1700)(x,y,2200)
Linear Event ExampleLine IDRoute ID1990199199Point Event at 100(x,y,0)BeginMeasureDIAMETERWALL THPIPE 520)Linear Event from 1000 to 2000(x,y,1700)(x,y,2200)
LRS EventsPoint and Linear Events Linear Events cannot span routesBegin Measure End MeasureOnly the centerline is spatial (PolylineM)NPMS Event tables are non‐spatial
Data Models used in thePipeline Industry
About PODSwww.pods.org Not for profit industry trade association60 Operator members95 Vendor members2 Models– PODS Relational– PODS Spatial
PODS Relational 6.0www.pods.org Usually “Spatialized” LRS Data Model Point and LinearEvent tables DB Transactions Widely used in US
PODS Spatial 6.0www.pods.org Uses APDM Core tables LRS Data Model Point and LinearEvent tables Esri Geodatabase
APDMwww.apdm.net LRS Data ModelPoint and LinearEvent tablesEsri Geodatabase
UPDMUtilities & PipelinesBrand new modelLRS Data ModelPoint and LinearEvent tables Esri Geodatabase
NPMS Uses PODS Implemented in 2011520k miles of US regulated pipelinesStandard PODS 4.02 Relational (Spatial)PODS Events are GDB Feature ClassesNPMS is Linear ReferencedSpatial History of all submissionsCustom Event tables added for NPMSUses DynSeg (Derived Layers) to distribute datawithin PHMSA
How operators prepareNPMS submissionsWhich GIS or other software packages (ESRI, CAD, anddata models such as PODS and APDM) are you usingnow? Are you using custom‐designed tools to prepare yourNPMS submission? Which would you use in the future once the InformationCollection becomes final? How much time do you spend preparing a submissionand who else is involved? Do you prepare the Annual Reports at the same time? Do you extract the data on 12/31 or do you wait until allbacklogged data has been entered?Open phones after onsite attendees speak
Proposed Information CollectionNPMS Submission Formats
Traditional Submission Format (Non‐LRS)(Appendix A) One tableSpatialNo Linear referencingHighly segmented
New LRS Submission Format(Appendix D)New optional formatOne Parent TableOne Spatial CenterlineNine event tablesLinear referencingEasier if you havean LRS model 33 attributes More tables – Lesssegmented
raft OperStandards FGDB Template.zip
How to prepare a traditionalsubmission (if you do not have LRS) Take snapshot of data Prepare as you do now, with all 33 attributes(overlay/intersect/merge) QC Review Package and Submit
How to prepare a traditionalsubmission (if you have LRS) Take snapshot of GIS Select all required attributes Combine by Dynamic Segmentation– Perform field calculations as needed– Export Spatial representation (GDB file) QC Review Package and Submit
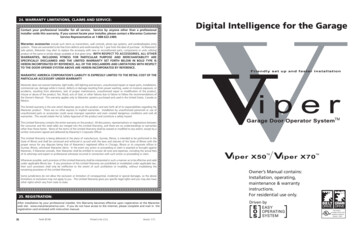
Dynamic Segmentation20”Diameter0.281”Wall ThicknessFBECoatingClass Location1Gas Last Corr. ILI Insp.20” x .281 FBE Class 2, Notin HCA, MAOP 877 LastCorrosion Insp 2012Yes877No731
Dynamic Segmentation20”Diameter0.281”Wall ThicknessFBECoatingClass Location1Gas 012Last Corr. ILI Insp.Result0.281”123420” x .281 FBE Class 2, Notin HCA, MAOP 877 LastCorrosion Insp 201256 78910
How to prepare an LRSsubmission Take snapshot of GIS Export attributes from event table views– Use Route and Measure, not Engineering Station– Perform field calculations as needed Export centerline (GDB file) QC review Package and Submit
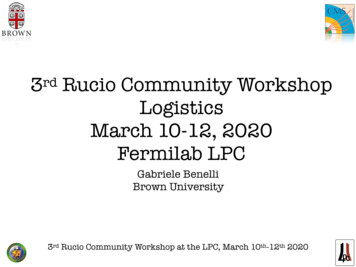
Example table mappingPODS to NPMSPODS Event TableNPMS LRS Event TablePipe SegmentPipeSegmentMAOP RatingMAOPDOT ClassGasClassHCAHCA CA BoundaryLiquidHCAILI InspectionILIExternal CoatingPipeCoatingTest PressureHydroTest
NPMS to PODS Table MappingAdditional AttributesNPMS TableNPMS FieldPhasePODS TablePODS ColumnNew positional accuracy standardCenterlineAccuracy QUALITY CD3 does not exist does not exist Diameter becomes mandatoryCommodity detailPipe material (e.g. cast iron, steel)Pipe gradeHighest percent operating SMYSMAOP or MOPSeam typeYear of installation (predominant 90%)Wall thicknessPipe joining methodPipe status codeOnshore/offshoreHazardous Liquid Low Stress ( 20%)Piggable? (Inline Inspection)Class locationGas HCA segment y/nSegment "could affect" an HCA ‐ Popluated AreaSegment "could affect" an HCA ‐ Ecologically Sensitive AreaSegment "could affect" an HCA ‐ Drinking WaterSegment "could affect" an HCA ‐ Commercially Navigable iquidHCALiquidHCAMATERIALGRADESMYSMAOPSEAM TYPECONSTR YRWALL THPIPE JOINSTATUS CDONSHORELOW STRESSILI ABLECLASSGAS HCAPA AFFECO AFFDW AFFCNW AFF11111111111111112222Pipe SegmentProduct RangePipe SegmentPipe SegmentPipe Operating HistoryMAOP RatingPipe SegmentPipe SegmentPipe Segment does not exist Status RangeExposure Calcluated ILI RangeDOT ClassHCA BoundaryHCA CA SegmentHCA CA SegmentHCA CA SegmentHCA CA SegmentOutside Diameter CLProduct Type CLMaterial CLPipe Grade CLYear of last corrosion ILI inspectionILIILI COR2ILI InspectionEnd DateEnd DateDIAMETERMAOP Rating or MOPPipe Long Seam CLDate InstalledNominal Wall Thickness CL does not exist Operating Status CLOnshore LFSmart Piggable LFRating CLType CLType CLType CLType CLType CLYear of last dent ILI inspectionILIILI DENT2ILI InspectionYear of last crack ILI inspectionILIILI CRAC2ILI InspectionEnd DateYear of last other ILI inspectionILIILI OTH2ILI InspectionEnd DateCoated/uncoated & cathodic protectionPipeCoatingCOATED2 Calcluated Type of coatingFRP control number, if applicableFRP sequence number, if applicableYear of original pressure testOriginal pressure test pressureYear of last pressure testLast pressure test ydroTestHydroTestHydroTestHydroTestCOAT TYPEFRP CONTRLFRP SEQORG HYDORG HYD PRLAST HYDLAST HYD PR2113322External Coating does not exist does not exist Test PressureTest PressureTest PressureTest PressureType SCL does not exist does not exist Test DateTest PressureTest DateTest Pressure
PODS Event Tables(15 event tables – 33 attributes) DOT ClassExposureExternal CoatingHCA BoundaryHCA CA BoundaryILI InspectionILI Range MAOP Rating Pipe OperatingHistory Pipe Segment Product Range Status Range Test Pressure 2 New
Benefits of LRS Submissions Easier– LRS to LRS format, direct data export– Easier to QC – record counts & mileage– Facilitates communication with NPMS Faster– More tables but fewer rows of data– Repeatable process – minimal data manipulation
Questions?Phone lines will be open aftertaking questions from the room
Segmentation in Geospatial DataHow the NPMS defines “pipeline segment”How segmentation negatively impacts the NPMSHow the NPMS currently handles your segmentationHow the proposed Information Collection will impactyour segmentation Operator Panel and Q&A: How do you determine segmentation?
Definition of a Pipe SegmentAccording to the NPMS, a pipeline segment is Part or all of a pipeline systemMust be uniquely identifiedSingle part, linear feature, only 2 ends, no branchesCan be straight or have multiple verticesSection of pipe with common attribute valuesThe number of pipeline segments should be kept to a minimumnecessary to represent the pipe and it’s attributesBOTTOM LINE: A pipeline system should be broken into multiplepipeline segments for only two reasons:1) to represent a branch or intersection with another pipe2) to allow for an attribute change
Segmentation hurts Impacts to: Web map viewerperformance Query performance Databaseperformance
How your segmentation impacts theNPMSImpacts of unnecessary and inconsistent operator segmentation Submission Processing Production Database Data Storage Slows the processing workflowCan increase analyst’s dependency on operatorsPotential for confusion and poor assumptionsInhibits Change Detection matching; impacts History qualityClunky and slowerEnd user products PIMMA and Public Viewer are slower to draw and return queryresultsHistory not as reliable or effective
How the NPMS currentlyhandles your segmentation Submission Processing Goal – operator segmentation retained in centerlineExceptions ‐ Spatial edits to accommodat
– Same definitions as PODS; familiar terms Linear referenced Pipe Centerline Point and Linear Events (not time‐based events) Examples – PODS Relational – PODS Spatial . LRS Data Model Point and Linear Event tables DB Transactions Widely used in US. PODS Spatial 6.0