Transcription
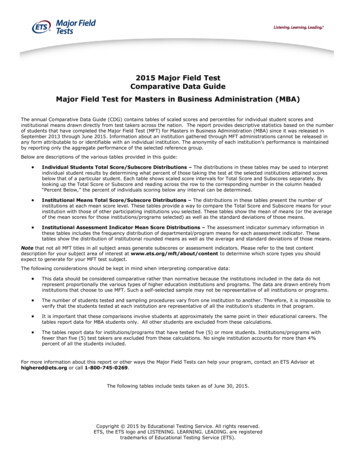
2015 Major Field TestComparative Data GuideMajor Field Test for Masters in Business Administration (MBA)The annual Comparative Data Guide (CDG) contains tables of scaled scores and percentiles for individual student scores andinstitutional means drawn directly from test takers across the nation. The report provides descriptive statistics based on the numberof students that have completed the Major Field Test (MFT) for Masters in Business Administration (MBA) since it was released inSeptember 2013 through June 2015. Information about an institution gathered through MFT administrations cannot be released inany form attributable to or identifiable with an individual institution. The anonymity of each institution’s performance is maintainedby reporting only the aggregate performance of the selected reference group.Below are descriptions of the various tables provided in this guide: Individual Students Total Score/Subscore Distributions – The distributions in these tables may be used to interpretindividual student results by determining what percent of those taking the test at the selected institutions attained scoresbelow that of a particular student. Each table shows scaled score intervals for Total Score and Subscores separately. Bylooking up the Total Score or Subscore and reading across the row to the corresponding number in the column headed“Percent Below,” the percent of individuals scoring below any interval can be determined. Institutional Means Total Score/Subscore Distributions – The distributions in these tables present the number ofinstitutions at each mean score level. These tables provide a way to compare the Total Score and Subscore means for yourinstitution with those of other participating institutions you selected. These tables show the mean of means (or the averageof the mean scores for those institutions/programs selected) as well as the standard deviations of those means. Institutional Assessment Indicator Mean Score Distributions – The assessment indicator summary information inthese tables includes the frequency distribution of departmental/program means for each assessment indicator. Thesetables show the distribution of institutional rounded means as well as the average and standard deviations of those means.Note that not all MFT titles in all subject areas generate subscores or assessment indicators. Please refer to the test contentdescription for your subject area of interest at www.ets.org/mft/about/content to determine which score types you shouldexpect to generate for your MFT test subject.The following considerations should be kept in mind when interpreting comparative data: This data should be considered comparative rather than normative because the institutions included in the data do notrepresent proportionally the various types of higher education institutions and programs. The data are drawn entirely frominstitutions that choose to use MFT. Such a self-selected sample may not be representative of all institutions or programs. The number of students tested and sampling procedures vary from one institution to another. Therefore, it is impossible toverify that the students tested at each institution are representative of all the institution’s students in that program. It is important that these comparisons involve students at approximately the same point in their educational careers. Thetables report data for MBA students only. All other students are excluded from these calculations. The tables report data for institutions/programs that have tested five (5) or more students. Institutions/programs withfewer than five (5) test takers are excluded from these calculations. No single institution accounts for more than 4%percent of all the students included.For more information about this report or other ways the Major Field Tests can help your program, contact an ETS Advisor athighered@ets.org or call 1-800-745-0269.The following tables include tests taken as of June 30, 2015.Copyright 2015 by Educational Testing Service. All rights reserved.ETS, the ETS logo and LISTENING. LEARNING. LEADING. are registeredtrademarks of Educational Testing Service (ETS).
2015 Comparative Data Guide - MFT for Masters in Business Administration (MBA)Institution ListData includes students from domestic institutions who tested between September 2013 and June 2015.AAdelphi University, NYAlabama A&M University, ALAlbany State University, GAAlcorn State University, MSAlvernia University, PAAndrews University, MIAppalachian State University, NCArcadia University, PAArkansas State University, ARAugsburg College, MNAvila University, MOAzusa Pacific University, CABellarmine University, KYBelmont University, TNBentley University, MABethel College (IN), INBiola University, CABlack Hills State University, SDBrock University, non-USCalifornia Polytechnic State University, CACalifornia State Polytechnic University - Pomona, CACalifornia State University - Bakersfield, CACalifornia State University - Dominguez Hills, CACalifornia State University - Long Beach, CACalifornia State University - Los Angeles, CACalifornia State University - Sacramento, CACameron University, OKCampbell University - Buies Creek, NCCarroll University, WIChapman University, CAChatham University, PAClaflin University, SCCleary University, MIClemson University, SCCollege of Charleston, SCColumbus State University, GADallas Baptist University, TXDelaware State University, DEDelaware Valley College, PADeVry University, ILDuquesne University, PAEastern Illinois University, ILEastern Kentucky University School of Business, KYEastern Washington University, WAElon University, NCEmbry-Riddle Aeronautical University, FLEmporia State University, KSFort Hays State University, KSFrancis Marion University, SCFranklin University, OHFreed-Hardeman University, TNGannon University, PAGeneva College, PAGeorgia College & State University, GAGeorgia Regents University, GAGeorgian Court University, NJHardin-Simmons University, TXHawaii Pacific University, HIHodges University - Fort Meyers, FLHoward Payne University, TXMFT 2015 Comparative Data GuideHoward University, DCIllinois State University, ILIndiana State University, INIndiana University - Kokomo, INIndiana University Northwest, INIndiana University Southeast, INInternational College of the Cayman Islands, non-USIPFW - Indiana University - Purdue Univ Fort Wayne, INIthaca College, NYJacksonville University, FLKentucky State University, KYKettering University, MILake Erie College, OHLamar University, TXLawrence Technological University, MILenoir-Rhyne University, NCLeTourneau University, TXLewis University, ILLimestone College, SCLindenwood University, MOLongwood University, VALouisiana State University - Baton Rouge, LALourdes University, OHLynchburg College, VAMadonna University, MIMalone University, OHMarymount University, VAMarywood University, PAMcMaster University, non-USMcNeese State University, LAMercer University, GAMeredith College, NCMerrimack College, MAMethodist University, NCMid-America Christian University, OKMidAmerica Nazarene University, KSMidland University, NEMidwestern State University, TXMilligan College, TNMillikin University, ILMilwaukee School of Engineering, WIMinnesota State University, Mankato, MNMississippi Valley State University, MSMissouri Baptist University, MOMissouri State University, MOMount St. Mary's University, MDNew Jersey Institute of Technology, NJNew York Institute of Technology (BC), non-USNew York Institute of Technology (NY), NYNiagara University, NYNorth Carolina A&T State University, NCNorth Greenville University, SCNortheastern Illinois University, ILNorthern Michigan University, MINorthwest Missouri State University, MONotre Dame de Namur University, CANyack College, NYOhio Dominican University, OHOklahoma Baptist University, OKOklahoma Christian University, OK DAK-4JMF Page 2
Oklahoma City University, OKOklahoma State University, OKOral Roberts University, OKPacific Lutheran University, WAPark University, MOPenn State IMBA, PAPenn State University - Great Valley, PAPfeiffer University, NCPittsburg State University, KSPoint Loma Nazarene University, CAPrairie View A&M University, TXProvidence College, RIQuinnipiac University, CTRadford University, VARockford College, ILRollins College, FLSacred Heart University, CTSaint Louis University, MOSaint Mary's University, non-USSan Jose State University, CASchreiner University, TXSeattle Pacific University, WAShepherd University, WVSouthern Adventist University, TNSouthern Arkansas University, ARSouthern Oregon University, ORSouthern Utah University, UTSouthern Wesleyan University, SCSpring Hill College, ALSt. Bonaventure University, NYSt. Edward's University, TXStephen F. Austin State University, TXSul Ross State University-RGC, TXSullivan University, KYSUNY at New Paltz, NYSUNY at Oswego, NYSUNY Institute of Technology, NYTennessee State University, TNTexas A&M University - Corpus Christi, TXTexas A&M University - San Antonio, TXTexas A&M University Kingsville, TXTexas A&M-Commerce, TXTexas Southern University, TXTexas Wesleyan University, TXTroy University - Troy, ALTulane University, LATusculum College, TNUnion Graduate College, NYUniversity of Akron, The, OHUniversity of Alabama in Huntsville, ALUniversity of Alaska Fairbanks, AKUniversity of Arkansas - Little Rock, ARUniversity of Bridgeport, CTUniversity of Central Missouri, MOUniversity of Central Oklahoma, OKUniversity of Detroit Mercy, MIUniversity of Houston - Downtown, TXUniversity of Illinois at Chicago, ILUniversity of Illinois at Springfield, ILUniversity of Louisiana at Monroe, LAUniversity of Maine - Orono, MEUniversity of Mary Hardin-Baylor, TXUniversity of Mary Washington, VAUniversity of Massachusetts Dartmouth, MAUniversity of Michigan - Flint, MIUniversity of Minnesota Duluth, MNUniversity of Missouri - St. Louis, MOUniversity of Mobile, ALUniversity of Montevallo, ALUniversity of Nebraska - Lincoln, NEUniversity of Nebraska - Omaha, NEUniversity of Nebraska at Kearney, NEUniversity of New Hampshire, NHUniversity of North Florida, FLUniversity of North Georgia, GAUniversity of North Texas - Denton, TXUniversity of Northern Iowa, IAUniversity of Pikeville, KYUniversity of South Alabama, ALUniversity of South Dakota, SDUniversity of South Florida - Sarasota-Manatee, FLUniversity of South Florida - St. Petersburg, FLUniversity of Southern Indiana, INUniversity of Southern Maine, MEUniversity of Southern Mississippi, MSUniversity of St. Thomas (MN), MNUniversity of St. Thomas (TX), TXUniversity of Tampa, FLUniversity of Tennessee - Chattanooga, TNUniversity of Texas - El Paso, TXUniversity of Texas - Permian Basin, TXUniversity of Texas at Arlington, TXUniversity of Texas at Brownsville, The, TXUniversity of Texas at Tyler, TXUniversity of the Cumberlands, KYUniversity of the Incarnate Word, TXUniversity of the Pacific, CAUniversity of Tulsa, OKUniversity of Wisconsin - Oshkosh, WIUtah Valley University, UTVirginia International University, VAWalsh College, MIWalsh University, OHWashburn University, KSWashington Adventist University, MDWaynesburg University, PAWeber State University, UTWestern Connecticut State University, CTWestern Illinois University, ILWestern Kentucky University, KYWestern Michigan University, MIWestminster College (UT), UTWheeling Jesuit University, WVWilkes University, PAWingate University, NCXavier University, OHYork College of Pennsylvania, PAYoungstown State University, OHCopyright 2015 by Educational Testing Service. All rights reserved.ETS, the ETS logo and LISTENING. LEARNING. LEADING. are registeredtrademarks of Educational Testing Service (ETS).MFT 2015 Comparative Data Guide DAK-4JMF Page 3
2015 Comparative Data Guide - MFT for Masters in Business Administration (MBA)Individual Students Total Score DistributionData includes students from domestic institutions who tested between September 2013 and June 2015.Number 48.016.1Individual Students Total Score DistributionTotal ScoreRange (220 - 300)284 - 51250249248247246245244243242241240239MFT 2015 Comparative Data GuidePercent 87573707067656262595656535048484542393937343131 DAK-4JMF Page 4
Total ScoreRange (220 - 23222221220Percent Below2926242220201816151311109865431Total Scores are reported as scaled scores.Percent Below based on percent below the lower limit of the score interval.Copyright 2015 by Educational Testing Service. All rights reserved.ETS, the ETS logo and LISTENING. LEARNING. LEADING. are registeredtrademarks of Educational Testing Service (ETS).MFT 2015 Comparative Data Guide DAK-4JMF Page 5
2015 Comparative Data Guide - MFT for Masters in Business Administration (MBA)Institutional Means Total Score DistributionData includes students from domestic institutions who tested between September 2013 and June 2015.Number 49.08.5Institutional Means Total Score DistributionMean Total ScoreRange (220 - 300)266 - 33232220 - 231Percent 62322181513107532221Total Scores are reported as scaled scores.Percent Below based on percent below the lower limit of the score interval.Copyright 2015 by Educational Testing Service. All rights reserved.ETS, the ETS logo and LISTENING. LEARNING. LEADING. are registeredtrademarks of Educational Testing Service (ETS).MFT 2015 Comparative Data Guide DAK-4JMF Page 6
2015 Comparative Data Guide - MFT for Masters in Business Administration (MBA)1Institutional Assessment Indicator Mean Score DistributionsData includes students from domestic institutions who tested between September 2013 and June 2015.AssessmentIndicatorNumber ofInstitutionsMeanMedianStandardDeviation1: Marketing23857.458.06.82: Management23858.559.07.13: Finance23843.944.06.24: Accounting23846.546.05.65: StrategicIntegration23851.352.06.2Institutional Assessment Indicator Mean Score DistributionsMean owA32PercentBelowA42PercentBelowA52PercentBelow84 - FT 2015 Comparative Data Guide DAK-4JMF Page 7
Mean 61134114110 - 3311111¹ Assessment Indicators for this test cannot be compared to testing years prior to 2013 due to changes inthe MBA test that were introduced in ategic IntegrationAssessment Indicators are reported as percent correct.Percent Below based on percent below the lower limit of the score interval.Copyright 2015 by Educational Testing Service. All rights reserved.ETS, the ETS logo and LISTENING. LEARNING. LEADING. are registeredtrademarks of Educational Testing Service (ETS).MFT 2015 Comparative Data Guide DAK-4JMF Page 8
Jun 30, 2015 · The tables report data for institutions/programs that have tested five (5) or more students. Institutions/programs with fewer than five (5) test takers are excluded from these calculations. No single institution accoun
