Transcription
Activitiesfor studentsSarah I. Duncan, Suzanne Lenhart, and Kelly K. SturnerJames Deboer/ThinkstockMeasuring Biodiversitywith ProbabilityMActivities for Students appears six timeseach year in Mathematics Teacher, oftenproviding in reproducible formats activity sheets that teachers can adapt for usein their own classroom. Manuscripts forthe department should be submitted viahttp://mt.msubmit.net. For more information on the department and guidelinesfor submitting a manuscript, please ?id 10440#activities.Edited by Ruth Doverdover@imsa.eduIllinois Mathematics and Science AcademyAurora, ILPatrick Harlesspdharless@gmail.comUniversity of Rochester (PhD student)Rochester, NYore and more, teachers are askedto make connections betweenthe STEM disciplines—science,technology, engineering, and mathematics—while also addressing statestandards. Mathematics is an underappreciated but important tool for the lifesciences, from mathematically modelingbiological processes to making sense ofbiological data. The activity presentedhere was designed for a Girls in Sciencecamp, held at Tremont, Tennessee, inthe Great Smoky Mountains NationalPark. The camp is designed to give localgirls entering eighth grade a chance tobecome familiar with the natural worldby doing hands-on research in the park.This particular exercise was designed toshow the value of mathematics for quantifying and interpreting biodiversity datathat the girls had collected.Biodiversity is important for ecosystem health and productivity. Greaterbiodiversity provides greater opportunities to find new organisms that can beimportant food sources or new medicinesfor people around the world. Also, highbiodiversity makes ecosystems moreresilient; with increasing threats to species from global climate change or natural catastrophes, more species can meana greater potential that some organismswill have the necessary traits to survive.But what exactly is biodiversity?How do we go about measuring whetherbiodiversity in one place is greater thanbiodiversity in another? Scientists andecologists do not simply count up all thedifferent organisms and compare thetotals. Measuring biodiversity involvesapplying probability to obtain a moremeaningful index for comparison.These two activities allow students toapply tools from mathematics to life science, raising awareness of connectionsbetween STEM disciplines. The activities were developed for grades 9–12and will take approximately one houreach, depending on the students’ level ofexperience with probability. Mathematics teachers using these activities areencouraged to communicate or workwith biology teachers to strengthen theactivity. If time allows, students couldcollect data and talk about biodiversityas part of their biology class exercise andcomplete the activity in a mathematicsunit on counting or probability. Groupwork is also appropriate for this exerciseto allow students to discuss difficult terminology and reduce the amount of classtime the activity will take.Vol. 107, No. 7 March 2014 Mathematics Teacher 547Copyright 2014 The National Council of Teachers of Mathematics, Inc. www.nctm.org. All rights reserved.This material may not be copied or distributed electronically or in any other format without written permission from NCTM.
Activity 1 serves as an introductionto quantifying biodiversity and can beused alone for students in beginning highschool mathematics courses. This activity will be most successful in a classroomin which students have a basic understanding of counting and probability. Italso provides a real-world application forthese skills. Students are introduced toSimpson’s Diversity Index, which usesprinciples of probability to determineobjectively which area has the greaterbiodiversity. After being led through aderivation of Simpson’s Diversity Index,students then apply the equation to adata set on their own. At the end, students may discuss whether their resultssupport their original hypotheses. Activity 1 provides an opportunity to learnand use knowledge connected with thefollowing Common Core State Standards:seeing structure in expressions (algebra),building functions (functions, modeling),and conditional probability and rules ofprobability (statistics and probability,modeling) (CCSSI 2010).For advanced classes (usually precalculus or higher), the module may be continued with activity 2, which requires anunderstanding of how to calculate limits.Students use mathematical practice skillsfrom the Common Core State Standards—reasoning abstractly and quantitatively,constructing viable arguments, and usingappropriate tools strategically (CCSSI2010)—to discover how species richnessand species evenness affect the index.Considering extreme cases of richness andevenness that may not occur in a biological scenario can aid students in understanding the constraints of this model.This module may serve as an introduction to measuring biodiversity andthen may be applied to a real-data setgathered by students. Students could, forexample, count insects from two different areas on the school grounds or learnto inventory tree species found in theiryards at home or in a local park.First, students will learn key vocabulary and concepts. Teachers might beginby asking students for their definitionof biodiversity. Already students mayimplicitly understand that what they aredescribing is a measurement and involvesquantification. The sample data set foundin table 1, tree species that were countedTable 1 Number of TreesSpeciesYard AYard BEastern redbud35Black oak45Post oak55White pine35Honey locust15in two yards, may be used to introduceand illustrate the key concepts of speciesrichness and species evenness. Biodiversity is a measure of the different kinds of organisms (species) in aregion or other defined area. Usuallywhen quantifying biodiversity, welook at a group of similar organisms(such as all insects), rather than allthe organisms in the ecosystem. Thisterm takes into account both speciesrichness and species evenness. Species richness is the number ofunique species in a region or specifiedarea. The data set shows five different species of trees found in the backyard (see table 1). Five is a measurement of the richness value. Species evenness is the degree of equitability in the distribution of individuals among species. Greater evennesssignifies less variation in the numbersof individuals of each species. Maximum evenness occurs when the number of individuals among all speciesis the same. In table 1, we see thatyard B has exactly the same numberof each kind of tree and, thus, hasgreater species evenness than yard A.students discuss species richness andevenness.After students are comfortable withthese concepts, ask them to imagine thisscenario: An ecologist collects information from two separate experimentalplots of the same size but with one bigdifference: Plot 1 is in the woods, andplot 2 is in a nearby field. The ecologist isinterested in the types of insects that arefound in the plots. The first data table inactivity 1 is an example of the data thatmight be collected. Before being shownthe table, students should think for aminute about what they expect to findand formulate a hypothesis.A UNIVERSAL WAY TODETERMINE BIODIVERSITYStudents might wonder which would beconsidered more biologically diverse—aplot with more richness or a plot withmore evenness. What happens if oneplot has many more species—would itbe as easy to determine which plots hadmore evenness?To answer such questions, in 1949 theBritish statistician Edward H. Simpsondevised an objective method to measurebiodiversity that is still used today. Simpson suggested that ecologists calculateoverall diversity in terms of probability.Simpson’s Diversity Index can beexplained as follows: If we randomlyselect an individual from a sample without replacement and then randomly selectanother individual from the same sample,what is the probability that the two organisms will be of different species? Thehigher the probability of different species,the higher the diversity. Simpson’s Diversity Index, D, can be represented as n n 1 n n 1 n n 1Although richness makes intuitive22SSD 1 1 1sense for measuring biodiversity, students N N 1may wonder why species evenness would n n 1 n n 1 n n 1 22SSbe important. Consider the example of aD 1 1 1 . activitysheets N N 1forest where introduction of a new species gives rise to a beetle infestation thatcauses population decline in other insect activitywhereS represents the number of spesheets n1 n1 1 n2 n2 1 nS nS 1species. One additional species, adding tocies,the number of individD 1n i represents ith species, N1the richness value of insects but reducinguals in theandNN represents n nn nS [ThenS 1 11Sthe evenness, would thus have a negativethe ntotalnumberofindividuals.122D 1 1 1nnimpact on the biodiversity.quantity1-Disalsosometimesreferredii N N 1i 1 1Simpson’s A useful next step might be to assessto asIndex,socarefulreferSN N 1students’ understanding of the conceptsenceni 1 resources is warranted. ntoi otheri 1 given here is also known as theinformally. Teachers can do so by pre- 1D assenting another table of data and havingGini-SimpsonlimNDNS , n1 . Index.—Ed.]()()()()( ( ( ))( ))lim D S, n .lim D S, n .S n ((()))() ( )( )( )( () )( ( ( )))(S 548 Mathematics Teacher Vol. 107, No. 7 March 2014())(()(()) . )
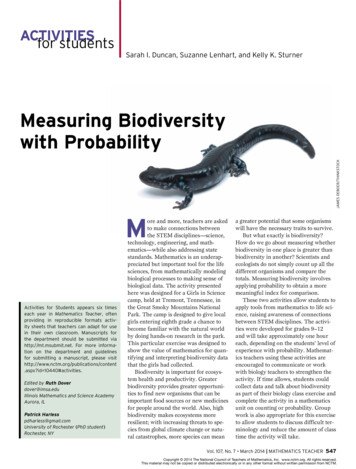
MORE TO EXPLOREMATHEMATICS AND BIOLOGYBiodiversity can be quantified in morethan one way. Consider having studentsdo research on Shannon’s Index (Shannon 1948), an alternative method ofcalculating a type of biodiversity index,and compare it with Simpson’s Diversity Index. Also, Simpson’s DiversityIndex is not as useful when representing biodiversity across trophic levels(such as predators and prey). It doesnot make ecological sense to expect thesame population sizes among predatorsand prey, if one predator needs to consume multiple prey species to survive.Ask students to think about ways toquantify total ecosystem biodiversity.There is no single right answer, butperhaps one student will publish a possible solution in a scientific journalsomeday.For a small real-data set to explore,consider table 2, showing some of thespecies of salamanders found in theGreat Smoky Mountains National Park.Thirty-one species can be found withinthe park’s boundaries (National ParksConservation Association, n.d.); thus,the Smokies are often called the salamander capital of the world.Integration of mathematics with biologycan illustrate that the concepts learnedin mathematics class are not isolatedexercises but are used in real-worldapplications that contribute to scientificknowledge. Students may realize thatquantifying biodiversity could affectconservation efforts and ecosystem management. Biology-based exercises canprovide an exciting and relevant wayto reinforce mathematical concepts andexplore the natural connections betweenmathematics and science.ACKNOWLEDGMENTSThe authors thank the Great SmokyMountains Institute in Tremont,Tennessee, for allowing them to pilotquantifying biodiversity exercises duringtheir camps for students and teachers andits citizen science program for permissionto use a subset of its data. Also, thanks toJerry Dwyer and Cathy Kessel for theirhelpful comments on an earlier draft ofthis article. This work was conducted atthe National Institute for Mathematicaland Biological Synthesis, an Institute sponsored by the National Science Foundation,the U.S. Departmentof Homeland Security,Table 2 Number of Salamanders at Selected Locations in the GreatSmoky Mountains National ParkSpeciesLower Dorsey StreamPig Pen StreamSpotted dusky salamander718Imitator salamander63Seal salamander515Black-bellied salamander711Desmognathus spp. salamander417Blue Ridge two-lined salamander131Spring salamander21Northern slimy salamander01Black-chinned red salamander00Santeetlah salamander10Southern red-backed salamander20Note: These salamanders were identified in submerged bags filled with leaf litter fromtwo different streams (Lower Dorsey and Pig Pen) in 2008. Data were collected aspart of a citizen science program at the Great Smoky Mountains Institute at Tremont.After your students explore these data, have them look for more data on the Web orask them to collect their own.and the U.S. Department of Agriculturethrough NSF grant no. EF-0832858, withadditional support from the University ofTennessee–Knoxville.REFERENCESCommon Core State Standards Initiative(CCSSI). 2010. Common Core State Standards for Mathematics. Washington, DC:National Governors Association Centerfor Best Practices and the Council of ChiefState School Officers.National Parks Conservation Association.n.d. Great Smoky Mountains NationalPark. lShannon, C. E. 1948. “A MathematicalTheory of Communication.” The BellSystem Technical Journal 27: 379–423 and623–56.Simpson, Edward H. 1949. “Measurement ofDiversity.” Nature 163: 688.SARAH I. DUNCAN,duncansarah3@gmail.com, isa PhD candidate in the Department of Biological Sciences,Ecology, Evolution, and Systematics at the University ofAlabama at Tuscaloosa.SUZANNE LENHART,lenhart@math.utk.edu, is aChancellor’s Professor in theDepartment of Mathematicsand is the associate director for education and outreach at theNational Institute for Mathematical andBiological Synthesis (NIMBioS) at the University of Tennessee–Knoxville. KELLYK. STURNER, ksturner@nimbios.org, iseducation and outreach coordinator atNIMBioS. She is also a graduate studentin science education at the University ofTennessee–Knoxville.These activity sheets areavailable to teachers asWord documents that maybe copied and edited forclassroom use; go to www.nctm.org/mt. For solutionsto the activities, download one of the freeapps for your smartphone and then scanthis tag to access www.nctm.org/mt052.Vol. 107, No. 7 March 2014 Mathematics Teacher 549
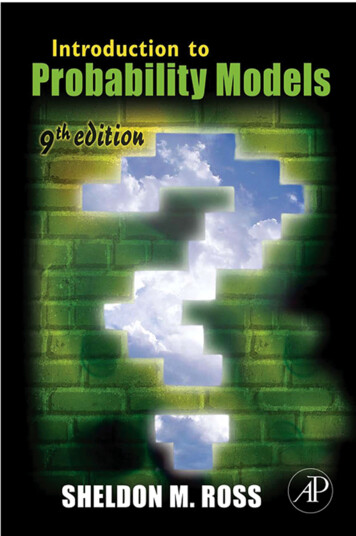
Activity 1: Behind Simpson’s Diversity IndexLook at the data below and make a hypothesis. Do you think that biodiversity will be higher in the woods or inthe field? Why? Can you suggest a way to decide by using mathematics?SpeciesPlot 1: WoodsPlot 2: FieldPillbug5010Monarch butterfly3650Seven-spotted lady beetle350Western honeybee5539Simpson’s Diversity Index was invented by a British statistician in 1949 and is based on probability. To seehow it works, you can derive the equation for the index. We will start with a very simple case:Imagine that you went into your back and front yards and counted the insects in each area. You found onlytwo species of insects—the Western honeybee and the seven-spotted lady beetle (see chart below).InsectsBack YardFront YardWestern honeybee1035Seven-spotted lady beetle5040TotalsTotalsYou have totals of 60 individuals in the back yard and 75 individuals in the front yard.1. Using the back yard data: Imagine that you put all those insects from the back yard into a bag. Suppose thatyou reach into the bag and randomly remove an individual and then randomly remove a second individualwithout replacement.(a) What is the probability that the two selected individuals are both Western honeybees?(b) What is the probability that the two selected individuals are both seven-spotted lady beetles?(c) What is the probability that the two individuals are from different species? Hint: This event is thecomplement of the union of the two events in questions 1(a) and 1(b).2. Using the front yard data: Imagine that you put all those insects from the front yard into a bag. Suppose thatyou randomly select an individual and then randomly select another individual without replacement.(a) What is the probability that the two selected individuals are both Western honeybees?(b) What is the probability that the two selected individuals are both seven-spotted lady beetles?(c) What is the probability that the two selected individuals are from different species?From the March 2014 issue of
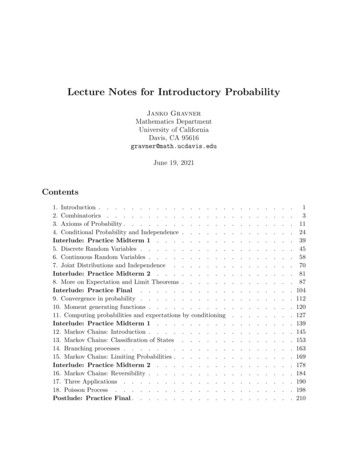
Activity 1: Behind Simpson’s Diversity Index (continued)3. Suppose that we now have n1 of one species and n2 of a second species in our area. The total number ofindividuals is now N n1 n2. See the chart below:Species TypeNumber of IndividualsSpecies 1n1Species 2n2Total IndividualsNSuppose that you randomly select an individual and then randomly select another without replacement.(a) What is the probability that the two selected individuals are both species 1?(b) What is the probability that the two selected individuals are both species 2?(c) What is the probability that the two selected individuals are from different species?4. Suppose that you have a very large data set, with many more than just 2 species. You might also have monarchbutterflies, craneflies, praying mantises, and other insects, for a total of S species (see the chart below).Species TypeNumber of IndividualsSpecies 1n1Species 2n2Species 3n3MMSpecies SnSTotal IndividualsNShow that the probability that the two selected individuals are different species would be()()() . n n 1 n n 1 n n 122SSD 1 1 1 N N 1() This is Simpson’s Diversity Index, D. Hint: Use your reasoning from question 3(c). activity sheets 5. If D is close to 1, is the area’s biodiversity high or low? Justify your answer.()()() n plotn 21(field) n2 data.n2 1Which plotnS hasnS the1 higher D value? Does this6. Calculate D for the plot 1 (woods) andD 1 1 1 calculation support your original hypothesis? N N 1 (S)() 7. Could biodiversity be quantified in otherni ways?ni 1 Justify your answer. Make suggestions about other ways toquantify biodiversity. Check the Webto find other indices that give alternative methods of calculating a 1 i 1biodiversity index.N N 1(From the) March 2014 issue of( ( ))lim D S, n .S
()()() . n n 1 n n 1 n n 122SSD 1 1 1 N N 1() Activity 2: Exploring the Effects of Species Richness activity sheets on Simpson’s DiversityIndex()()() n n 1 n n 1 n n 122SSD 1 1 1 N N 1() n (n 1)S 1 i 1ii()N N 1Simpson’s Diversity Index (D) takes into account both species evenness and species richness. Species richnessmeasures the number of unique limspeciesor specified area. Species evenness is the degree of equitabilD inS, an region.S ity in the distribution of individuals among species. But just how important is each factor in determining D?Can you get a very high index value with just one of these factors? In this activity, we will explore these questions to better understand how thislim mathematicalD S, n . model of biodiversity works. Note that the cases below withn the same number of individuals in each species would not occur in nature. We are considering only the case ofcomplete evenness.( ( ))( ( ))1. Suppose a plot has four species with100 individuals of each species (see the chartat right). Calculate D for this example.Species Type2. Repeat exercise 1 to calculate D with 200 individuals in each species. Then calculate D with n n 1 n n 1 n n1 each122How do theseSS500 individualsspecies.D 1 in with each otheranswers compareN Nand 1with theanswer from exerciseFor S 4, how does D n n 1?1 n2 n2 1 nS nS11 the totalchangeasweincreasenumber of indiD 1 activitysheets viduals but keepN theN same?1 the proportions()(()(()((()))))((Number of IndividualsSpecies 1100Species 2100Species 3100) Species1 4 . IndividualsTotal 1 . )()()1004003. Suppose that a plot has four species and n individuals in each species. Calculate D for this example. Show nsheets n 1 n2 n 1 n nS 1 the same, the values of D will decrease.2 population Sproportionsthat as activitytheDwe 1increase 1 n1 but keep (( ()N N 1)) () 4. Suppose that aSplot has S species with n individuals in each species. In this case, find D as a function of S n n 1 n n
Species evenness is the degree of equi-tability in the distribution of individ-uals among species. Greater evenness signifies less variation in the numbers of individuals of each species. Maxi-mum evenness occurs when the num-ber of individuals among all species is the same. In table 1, we see that yard B has exactly the same number