Transcription
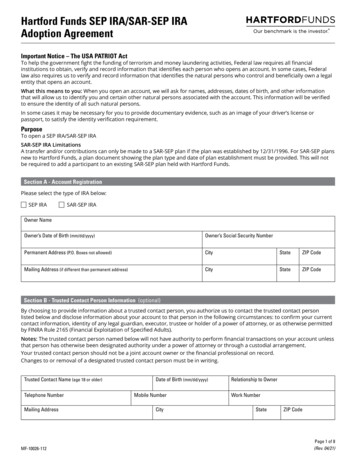
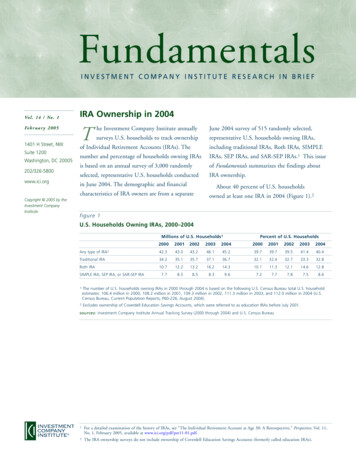
FundamentalsINVESTMENT COMPANY INSTITUTE RESEARCH IN BRIEFVo l . 1 4 / No . 1Fe b r u a r y 2 0 0 51401 H Street, NWSuite 1200Washington, DC 20005202/326-5800www.ici.orgIRA Ownership in 2004The Investment Company Institute annuallyJune 2004 survey of 515 randomly selected,surveys U.S. households to track ownershiprepresentative U.S. households owning IRAs,of Individual Retirement Accounts (IRAs). Theincluding traditional IRAs, Roth IRAs, SIMPLEnumber and percentage of households owning IRAsIRAs, SEP IRAs, and SAR-SEP IRAs.1 This issueis based on an annual survey of 3,000 randomlyof Fundamentals summarizes the findings aboutselected, representative U.S. households conductedIRA ownership.in June 2004. The demographic and financialAbout 40 percent of U.S. householdscharacteristics of IRA owners are from a separateCopyright 2005 by theInvestment CompanyInstituteowned at least one IRA in 2004 (Figure 1).2figure 1U.S. Households Owning IRAs, 2000–2004Millions of U.S. Households1Percent of U.S. Any type of ional IRA34.235.135.737.136.732.132.432.733.332.8Roth .58.39.67.27.77.87.58.6SIMPLE IRA, SEP IRA, or SAR-SEP IRA1The number of U.S. households owning IRAs in 2000 through 2004 is based on the following U.S. Census Bureau total U.S. householdestimates: 106.4 million in 2000, 108.2 million in 2001, 109.3 million in 2002, 111.3 million in 2003, and 112.0 million in 2004 (U.S.Census Bureau, Current Population Reports, P60-226, August 2004).2Excludes ownership of Coverdell Education Savings Accounts, which were referred to as education IRAs before July 2001.sources: Investment Company Institute Annual Tracking Survey (2000 through 2004) and U.S. Census BureauINVESTMENTCOMPANY INSTITUTE1For a detailed examination of the history of IRAs, see “The Individual Retirement Account at Age 30: A Retrospective,” Perspective, Vol. 11,No. 1, February 2005, available at www.ici.org/pdf/per11-01.pdf.2The IRA ownership surveys do not include ownership of Coverdell Education Savings Accounts (formerly called education IRAs).
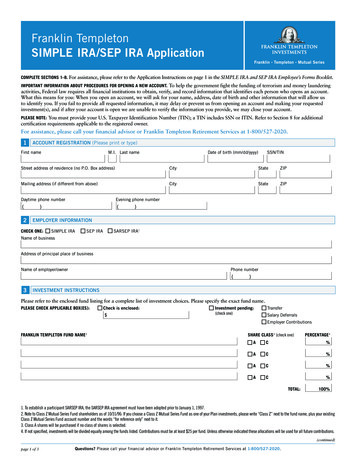
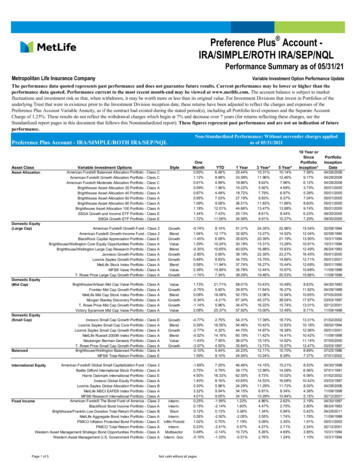
Ownership rates have remained relatively stableTraditional IRA households have a median offor traditional,3 Roth,4 and employer-sponsored 24,000 in their traditional IRAs, typically heldIRAs5 since 2000.in two accounts (Figure 3). Households withtraditional IRAs hold them through a wide arrayCharacteristics of Households OwningIRAsof financial institutions, most often using full-Households that own IRAs tend to have greaterindependent financial planning firms, or banksfinancial assets and higher incomes than householdsor savings institutions. More than four-fifthswithout IRAs (Figure 2). In addition, the typicalopened their first traditional IRA in 1998 or earlier.decisionmaker in households with IRAs is moreservice brokerages, mutual fund companies,Roth IRAs. Households owning Roth IRAs havelikely to be married, employed, and hold a collegethe greatest median incomes but the lowest medianor postgraduate degree.financial assets of all IRA households (Figure 2).Traditional IRAs. Households owning tradi-The financial decisionmakers of Roth IRA house-tional IRAs tend to have greater financial assets butholds have a median age of 44 years and are thelower incomes than households holding other typesmost likely of all IRA household decisionmakersof IRAs. The financial decisionmakers of traditionalto have college or postgraduate degrees. TheIRA households generally are older and more likelymajority of Roth IRA households own one Rothto be retired than those of Roth or employer-IRA account, with a median balance of 8,600sponsored IRA households.3Immediately prior to tax-year 2002, the traditional IRA permitted a maximum annual individual contribution of the lesser of 2,000 or 100percent of compensation for the year. The Economic Growth and Tax Relief Reconciliation Act of 2001 (EGTRRA) increased the annual limiton contributions to IRAs to 3,000 for tax-years 2002 through 2004, 4,000 in tax-years 2005 through 2007, and 5,000 in tax-year 2008.Thereafter, the limit is indexed annually for inflation in 500 increments. EGTRRA also permits individuals who have reached age 50 to makeadditional “catch-up” contributions of up to 500 in tax-years 2002 through 2005, and up to 1,000 in 2006 and thereafter. These and otherchanges made by EGTRRA discussed below will expire after December 31, 2010 unless Congress makes the law permanent. Individuals participating in certain employer-sponsored retirement plans are subject to rules that phase out and eliminate the deductibility of their traditional IRAcontributions at certain income levels. Traditional IRA earnings are tax-deferred, and distributions are taxed at withdrawal. Withdrawals fromtraditional IRAs before age 59½ are subject to a 10 percent tax penalty except under certain exceptions, such as disability, death, or payments forhigher education or to buy a first home ( 10,000 limit). Distributions from traditional IRAs must commence after individuals attain age 70½,and contributions are not permitted after that age. For reference on rules governing IRAs, see IRS Publication 590, Individual RetirementArrangements (www.irs.gov/pub/irs-pdf/p590.pdf ).4Roth IRAs were established in 1997 under the Taxpayer Relief Act, which originally permitted a maximum annual individual contribution of 2,000. EGTRRA increased the annual contribution limits to Roth IRAs in the same manner as traditional IRAs (i.e., 3,000 for tax-years2002 through 2004, etc. (see footnote 3)). Eligibility to contribute to Roth IRAs is subject to phaseout and elimination at certain income levelsand is offset by contributions made to traditional IRAs (see footnote 3). Earnings are not taxed, and distributions of earnings and principal aretax-free, provided the account is held for at least five years and the account holder is at least age 59½ at the time of withdrawal. Penalty-freeearly withdrawals can be made under certain circumstances, such as for first home purchases. There is no requirement that distributionscommence after age 70½, and contributions may be made after age 70½.5The SIMPLE IRA was created by the Small Business Job Protection Act of 1996 for employers with no more than 100 employees and permitsemployees to make annual elective contributions. EGTRRA increased the SIMPLE IRA annual contribution limit to 8,000 in tax-year 2003from 7,000 in tax-year 2002, and increases the annual limit in increments of 1,000 until it reaches 10,000 in 2005. In addition,participants age 50 or older may be eligible to make catch-up contributions of 1,000 in tax-year 2003, up from 500 in tax-year 2002.Employers must match employee elective contributions dollar-for-dollar up to 3 percent of the employee’s compensation or provide a 2 percentcontribution for all eligible employees. Distributions from SIMPLE IRAs are generally taxed under the rules applicable to traditional IRAs.Early withdrawals are usually subject to the provisions applicable to traditional IRAs, but those made within two years of the date on whichan individual first began to participate in the program are subject to a 25 percent, rather than a 10 percent, early withdrawal tax(see footnote 3).Simplified Employee Pension (SEP) IRAs, created under the Revenue Act of 1978, are arrangements established by an employer for eacheligible employee. Employees receive immediate vesting in employer contributions and generally direct the investment decisions. EGTRRAincreased the annual employer contribution limit from 15 percent to 25 percent of compensation and increased the compensation limit from 170,000 in tax-year 2001 to 200,000 in tax-year 2002. The 200,000 limit was indexed to inflation thereafter, but the limit stayed at 200,000 for tax-year 2003. The limit was adjusted to 205,000 for tax-year 2004. In addition, catch-up contributions of 2,000 in tax-year2003 (up from 1,000 in tax-year 2002) may be made with regard to individuals age 50 or older. Distributions from SEP IRAs are generallytaxed under the rules applicable to traditional IRAs. Early withdrawals are subject to the early withdrawal tax applicable to traditional IRAs(see footnote 3).A SAR-SEP IRA is a SEP IRA with a salary reduction feature. The Small Business Job Protection Act prohibited the formation of newSAR-SEPs after December 31, 1996.FUNDAMENTALS / page 2
figure 2Characteristics of U.S. Households Owning IRAs, 2004Type of IRA OwnedHouseholdsOwningIRAsTraditionalIRA49 years52 ldsNotOwningOwningIRAsIRAs44 years47 years45 yearsMedian Per HouseholdAge of household sole or co-decisionmakerfor investingHousehold income 62,500 63,800 70,000 64,500 35,000Household financial assets2 172,100 250,000 137,000 200,000 21,700Household financial assets in all types of IRAs 25,000 30,300 21,800 47,800NA21%20%9%11%NAShare of household financial assets in typeof IRA indicatedPercent of HouseholdsHousehold sole or co-decisionmaker for investing:Married6666716246College or postgraduate degree5754685328Employed full- or part-time7166828161Self-employed32324213116Retired from lifetime occupation2632111326Household owns:4Mutual funds7676847328Individual stocks (including company stock)6264645826Whole life insurance with a cash value51514755NACertificates of Deposit4852454314Fixed or variable annuities4246383913Real estate other than primary residence2932322515Individual bonds30333235NAHousehold has defined contributionretirement plan account (total)4401(k) plan accountSome other type of defined contributionretirement plan ditional IRA811006654NARoth IRA322610027NAEmployer-sponsored IRA1211418100NAHousehold has defined benefit plan coverageTypes of IRAs owned:4,5NA Not applicable or not asked1Includes SIMPLE IRAs, SEP IRAs, and SAR-SEP IRAs.2Includes assets in employer-sponsored defined contribution retirement plans but excludes primary residence.3Of household sole or co-decisionmakers who are employed.4Multiple responses included.5Data are from ICI’s 2004 Annual Tracking Survey.note: Number of respondents varies. Data for households owning IRAs are from ICI's June 2004 survey of U.S. households owning IRAs.Data for households not owning IRAs are from ICI's 2004 Annual Tracking Survey.source: Investment Company InstituteFUNDAMENTALS / page 3
figure 3figure 4Characteristics of U.S. Households OwningTraditional IRAs, 2004Characteristics of U.S. Households Owning Roth IRAs, 2004Median Per HouseholdMedian Per HouseholdAmount in traditional IRAs 24,000Amount contributed to traditional IRAs intax-year 20031Number of traditional IRAs owned 8,600Amount contributed to Roth IRAs in tax-year 20031 3,000Number of Roth IRAs owned1 2,5002Percent of HouseholdsTraditional IRA includes rollover from an employersponsored retirement planAmount in Roth IRAsPercent of HouseholdsRoth IRA was first IRA owned32Roth IRA was funded by a conversion from a traditional IRA2346Contributed to a Roth IRA in tax-year 200341Contributed to a traditional IRA in tax-year 200326Roth IRA assets include assets initially from an employer-sponsored retirement plan13Deducted a traditional IRA contribution intax-year 20031Made a withdrawal from a Roth IRA in tax-year 2003228Made a withdrawal from a traditional IRA intax-year 200315Planning to convert a traditional IRA to a Roth IRA11Own traditional IRA:2Own Roth IRA:281Spouse44Dependent children6Number of Roth IRAs owned:Respondent90Spouse46Dependent children2Number of traditional IRAs owned:48Two36Three or more17Year first traditional IRA was opened:261984 through 1993361994 through 1998191999 through 2000112001 through 200253Full-service brokerage33Mutual fund company30Independent financial planning firm28Bank or savings institution26Insurance company9Discount brokerage (total)9Discount brokerage firm with walk-in offices7Discount brokerage firm only available online21Of households that contributed to traditional IRAs in tax-year 2003.2Multiple responses included.source: Investment Company InstituteFUNDAMENTALS / page 435Three or more81998391999 through 2000292001 through 200217Where Roth IRAs areheld:2note: Number of respondents varies.57Two2003 through June 2004Before 19842003 through June 2004OneYear first Roth IRA was opened:OneWhere traditional IRAs areRespondent15held:2Independent financial planning firm31Full-service brokerage26Mutual fund company26Bank or savings institution16Insurance company10Discount brokerage (total)10Discount brokerage firm with walk-in offices7Discount brokerage firm only available online41Of households that contributed to Roth IRAs in tax-year 2003.2Multiple responses included.note: Number of respondents varies.source: Investment Company Institute
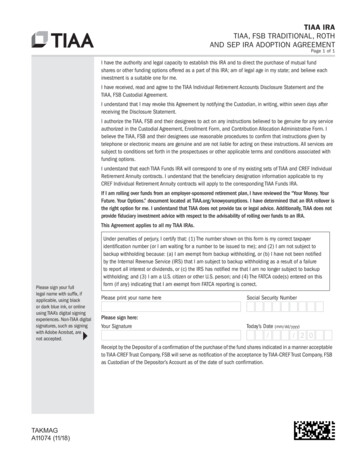
(Figure 4). Sixty-eight percent of Roth IRApercent of households with employer-sponsoredhouseholds initially opened their Roth IRAs betweenIRAs also own traditional IRAs, and 27 percent1998 and 2000; the remaining opened their firstalso own Roth IRAs. Households with employer-Roth IRA in 2001 or later. Thirty-two percentsponsored IRAs have a median of 47,800 investedof Roth IRA households opened a Roth IRA asin all types of IRAs.their first IRA account. Roth IRA households mostoften hold Roth IRAs at independent financialTypes of Investments in IRAsplanning firms, full-service brokerages, or mutualNearly two-thirds of IRA households hold mutualfund companies.funds in their IRA portfolios, usually stock mutualEmployer-Sponsored IRAs. The financialfunds (Figure 5). The next most frequently helddecisionmakers of households with employer-investment in IRAs is individual stocks, which 37sponsored IRAs have a median age of 47 yearspercent of IRA households own. Thirty-one percent(Figure 2). More than four-fifths of thesehave annuities in their IRAs, and 27 percent holddecisionmakers are employed and 31 percentbank deposits.of those working are self-employed. Fifty-fourfigure 5Investments Held in IRAs by Type of IRA Owned, 20041(percent of U.S. households owning each type of IRA)Type of IRA OwnedMutual funds (total)Stock mutual fundsOwn Any Typeof 735254545738Bond mutual funds27272122Hybrid mutual funds19211416Money market mutual funds27282022Individual stocks37393028Annuities (total)31321720Fixed annuities20241312Variable annuities18201212Bank savings accounts, money market deposit accounts,or Certificates of Deposit27281717Individual bonds16161313Other56421Multiple responses included.2Includes SIMPLE IRAs, SEP IRAs, and SAR-SEP IRAs.note: Number of respondents varies.source: Investment Company InstituteFUNDAMENTALS / page 5
Contributions to Traditional and RothIRAs in Tax-Year 2003Roth IRAs in tax-year 2003 (Figure 4). These house-Twenty-six percent of traditional IRA households—to their Roth IRAs.7 Roth IRA contributors tend toan estimated 9.5 million—contributed to theirbe younger and have fewer household financial assetstraditional IRAs in tax-year 2003, with a medianthan non-contributors (Figure 6). In addition, Rothcontribution of 2,500 per household (Figure 3).6IRA contributors have lower median total IRA assetsContributors typically have greater householdthan non-contributors. Roth IRA contributors alsoincomes, household financial assets, and IRA assetsare more likely than non-contributors to havethan non-contributors (Figure 6).college or postgraduate degrees and have definedholds contributed a median of 3,000 per householdcontribution retirement plan accounts.Forty-one percent of Roth IRA households—an estimated 5.9 million—contributed to theirfigure 6Characteristics of Households Owning Traditional or Roth IRAs by Contribution Status in Tax-Year 2003Traditional IRA HouseholdsRoth IRA HouseholdsContributedto Traditional IRAin Tax-Year 20031Did NotContributeto Traditional IRAin Tax-Year 20032Contributedto Roth IRAin Tax-Year 20033Did NotContributeto Roth IRAin Tax-Year 20034Age of household sole or co-decisionmaker for investing50 years49 years43 years51 yearsHousehold income 75,000 60,000 65,000 62,500Household financial assets5 250,000 150,000 114,600 200,000Household financial assets in all types of IRAs 31,400 23,300 15,000 30,000Married67656865College or postgraduate degree59567453Median Per HouseholdPercent of HouseholdsHousehold sole or co-decisionmaker for investing:Employed full- or part-timeHousehold has defined contribution retirement plan account123458368876767687566Twenty-six percent of households owning traditional IRAs contributed to them in tax-year 2003.Includes all households owning traditional IRAs that did not contribute to them in tax-year 2003. Some of these households may have been ineligible to make deductiblecontributions.Forty-one percent of households owning Roth IRAs contributed to them in tax-year 2003.Includes all households owning Roth IRAs that did not contribute to them in tax-year 2003. Some of these households may have been ineligible to contribute to RothIRAs in tax-year 2003.Includes assets in employer-sponsored defined contribution retirement plans but excludes primary residence.note: Number of respondents varies.source: Investment Company Institute6Among traditional IRA households that contributed and were eligible to make catch-up contributions, 33 percent did so (in all cases contributing the maximum allowed, 3,500 in 2003). Based on tabulations from a small sub-sample of the ICI 2004 IRA Survey.7Among Roth IRA households that contributed and were eligible to make catch-up contributions, 41 percent did so (in all cases contributing the maximum allowed, 3,500in 2003). Based on tabulations from a small sub-sample of the ICI 2004 IRA Survey.FUNDAMENTALS / page 6
Withdrawals from Traditional and RothIRAs in Tax-Year 2003Rollovers from Employer-SponsoredRetirement Plans to Traditional IRAsFifteen percent of traditional IRA households—Rollovers are an important source of funding foran estimated 5.5 million—made withdrawals fromtraditional IRAs. Forty-six percent of traditionaltheir traditional IRAs in tax-year 2003 (Figure3).8IRA households—an estimated 16.9 million—The median amount withdrawn in tax-year 2003have traditional IRAs that include assets “rolledwas 5,000, usually taken as a single withdrawalover” from employer-sponsored retirement plans(Figure 7). Two-thirds of these households(Figure 3). Seventy-two percent of these traditionalconsulted professional financial advisers beforeIRA households have conducted one rollover,making their withdrawals. Twenty-six percent20 percent have completed two rollovers, andconsulted written information, software, or a8 percent have undertaken three or more rolloverswebsite—usually IRS rules or publications. Taking(Figure 8). Seventy percent rolled over assets froma required minimum distribution is the mostemployer plans to traditional IRAs because of afrequently cited reason for taking a withdrawal.job change, layoff, or termination, and 27 percentEighty-three percent of the financial decision-rolled over assets due to retirement. More thanmakers of households that made withdrawalshalf conducted their most recent rollover in 1999from traditional IRAs are retired, and 20 percentor later. In nearly all instances, the most recentare widowed.rollover included reinvesting all employer-Only 2 percent of Roth IRA households madesponsored retirement plan assets into a traditionalwithdrawals from their Roth IRAs in tax-yearIRA. Households with traditional IRAs that include2003 (Figure 4).9rollover assets typically have greater IRA assets,including traditional IRA assets, than householdswhose traditional IRAs do not include rollovers.8Excludes households that closed and no longer owned traditional IRA accounts.9Excludes households that closed and no longer owned Roth IRA accounts. The sample size of households that withd
A SAR-SEP IRA is a SEP IRA with a salary reduction feature. The Small Business Job Protection Act prohibited the formation of new SAR-SEPs after December 31, 1996.