Transcription
State of Alaska2021Progress ReportonEqual Employment Opportunityand Affirmative Actionin Alaska State GovernmentMichael J. DunleavyGovernor
Table of ContentsPreface . 2Introduction . 5Report Summary . 8Current Outlook: BIPOC Employment . 9Historical Trends: BIPOC Employees 1995 to Present . 17Current Outlook: Women Employment . 20Historical Trends: Women 1995 to Present . 27Generational Workforce Data . 292021 EEO Program Staff . 31Appendix. 31Race and Ethnicity Category Definitions . 31Job Category Definitions . 32Endnotes. 35BIPOC Black, Indigenous, and People of Color2 Page2021 Progress Report on EEO and AA in Alaska State Government
PrefaceThis 2021 Progress Report is filed with the Governor and the Legislature inaccordance with Alaska Statute 39.28.020(a)(12). 1 Additional State of AlaskaExecutive Branch employee demographics may be found in the annuallypublished “Workforce Profile” by the Department of Administration, Division ofPersonnel & Labor Relations, which is available on-line at the Division’s web page.The subject of this 2021 Progress Report is the status of Equal EmploymentOpportunity (EEO) and Affirmative Action (AA) in the Executive Branch of theState of Alaska (hereafter “the State”). This Progress Report is intended to give anoverall view of women and Black, Indigenous, and People of Color (BIPOC)employee demographics in the State’s Executive Branch. The Report does notinclude workforce information on the Alaska State Legislature, the Alaska CourtSystem, the Alaska State Defense Force, or the Alaska National Guard. Nor doesthis Report cover such entities as the University of Alaska, the Alaska HousingFinance Corporation, or the Alaska Railroad Corporation. The Report capturesworkforce data for full- and part-time permanent positions in the Executive Branchincluding seasonal positions. It does not capture employee data for nonpermanent positions.Data sources for this Report (unless otherwise noted) are the U.S. Census Bureau,U.S. Bureau of Labor Statistics, the State of Alaska Department of Labor &Workforce Development, the AKPAY Inquiry (data from the former Alaska PayrollSystem), and the State’s Integrated Resource Information System for HumanResource Management (IRIS HRM). Workforce numbers were drawn from thedata as of June 30, 2020, which is consistent with the annual Workforce Profile andbiennial federal EEO-4 report. Historical data between 1995 and 2021 wasobtained from employee data downloaded from the payroll system. Somehistorical data was obtained from prior Progress Reports.Use in this Progress Report of technical terms such as underutilization, availability,and underrepresentation does not necessarily signify that the State agrees theseterms are properly applied to any particular factual situation, or that the State1AS 39.28.020(a)(12) – The director of the division of personnel shall “prepare and submit anannual report to the governor and the legislature by February 15 on the progress and problemareas in the equal employment opportunity program and the implementation of theaffirmative action plan.”3 Page2021 Progress Report on EEO and AA in Alaska State Government
agrees that it is liable under applicable laws. Instead, these terms are employedto provide leaders and managers information for effective and targeted policydecisions.This Progress Report was prepared by the Equal Employment Opportunity Programin partnership with the Employee Planning & Information Center within the Stateof Alaska, Department of Administration, Division of Personnel & Labor Relations.The EEO Program welcomes comments regarding this report. Interested partiesshould submit feedback in writing to:Kate Sheehan, State of Alaska Personnel DirectorDepartment of AdministrationDivision of Personnel & Labor RelationsEqual Employment Opportunity ProgramP.O. Box 110201Juneau, AK 99811-0201orCamille Brill, State of Alaska EEO Program ManagerDepartment of AdministrationDivision of Personnel & Labor RelationsEqual Employment Opportunity Program550 W. 7th Ave., Suite 1960Anchorage, AK 99501The State of Alaska, as an employer and service provider, complies withthe Americans with Disabilities Act and Alaska Human Rights Law.Individuals with disabilities who require this publication in an alternative formatare welcome to contact the EEO Program Manager for assistanceat the address noted above or camille.brill@alaska.gov or (907) 375-7705and for individuals with hearing impairments viaAlaska Relay at 711 or (800) 770-8973.February 20214 Page2021 Progress Report on EEO and AA in Alaska State Government
IntroductionThe size of the Executive Branch workforce in 2020 continued on its now six-yeardownward trend. This Report reflects workforce demographic data as of June 30,2020 under Governor Michael J. Dunleavy’s Administration. There are 14,376employees in our 15 departments, notably lower than the record high of 16,158employees in 2014. i Alaska’s current population, estimated at 728,903, is in itsfourth year of decline. iiKnowledge of the Executive Branch’s workforce gives us awareness of how andwhere we need to continue to change to be an employer of choice. As our stategovernment gets smaller, attracting and retaining the best workforce is vital toAlaska’s success. According to the Pew Research Center, projections show theUnited States will not have a single ethnic or racial majority by 2055. Millennials(people born between 1981 and 1996) are now the largest generation in the U.S.labor force as well as the Executive Branch workforce. Added to that fact is thatmillennials are the most racially and ethnically diverse adult generation in ournation’s history. iii Effectively managing a smaller and increasingly more diverseworkforce is essential to meeting State government’s crucial responsibilities to allAlaskans.The State’s workforce – like Alaska’s population – is diverse. Our youngestemployee is 18 years of age and our oldest is 80. The State’s racial demographicscompared to the United States as a whole, reveals a proportionally higherpercentage of racial and cultural diversity. iv Alaska has a greater percentage ofpeople who identify their race as “Alaska Native or American Indian,” “Asian,”“Native Hawaiian or Other Pacific Islander,” or “Two or More Races.” Moreover,Alaska has a lower percentage of people who identify as racially white alonecompared to the nation as a whole.The U.S. Census Bureau projects that the population of people who identify as“Two or More Races” will be the fastest growing racial group in America over thenext 40 years, followed by Asians and Hispanics. In contrast, the non-Hispanicwhite population is projected to shrink, between 2016 and 2060, from 198 millionto 179 million people by 2060. v5 Page2021 Progress Report on EEO and AA in Alaska State Government
The chart below compares Alaska’s population with that of the nation in sevenrace/ethnicity groupings. vi and 2Race/EthnicityWhite (Alone)African American or Black (Alone)Alaska Native or American Indian(Alone)Asian (Alone)Native Hawaiian or Other PacificIslander (Alone)Two or More RacesHispanic or LatinoAlaska64.2 %3.1 %15.8 %United States72.0 %12.8%0.9 %6.0 %1.4 %5.7 %0.2 %7.9 %7.2%3.4%18.4%Alaska’s school districts’ demographics give us a glimpse of our future workforce.The greater Anchorage/Matanuska Susitna area and the Southeast region of thestate, including the City and Borough of Juneau, are home to 75 percent ofExecutive Branch employees. vii The Anchorage School District (ASD), the largestin the State and one of the 100 largest districts in the United States, reports itsBIPOC student population exceeds its white student population. Students whoBIPOC Black, Indigenous, and People of Coloridentify as white are the minority. According to ASD’s current race and ethnicityreport, non-white students make up 60 percent of the student population versuswhite students who make up 40 percent. viii The ASD counts over 110 languagesspoken by its students or by the students’ families. The top five languages spoken(after English) are: Spanish, Hmong, Samoan, Filipino, and Korean. ASDdemographics over the last 10 years reveal trends with significant increases in“Asian or Pacific Islander” students and those who identify as multiracial. The Cityand Borough of Juneau School District reports its student population is 48 percentwhite. ixNote: Total percentages do not add to 100 as individuals may identify as both Hispanic/Latinoand a race category. Also, the US Census uses the category of “some other race alone.”26 Page2021 Progress Report on EEO and AA in Alaska State Government
As the nation and Alaska face racial demographic population changes, so willthe State of Alaska’s Executive Branch workforce. Accordingly, the State iscommitted to the promotion of diversity and inclusion by not only fulfilling all stateand federal EEO mandates but by promulgating workplace rules andemployment practices that value equity and fairness. In 2020, formalgubernatorial Proclamations were issued to includex: Dr. Martin Luther King, Jr. Day – January 20, 202075th Anniversary of the Liberation of the Auschwitz-Birkenau Death Camp –January 27, 2020Black History Month – February 1, 2020Cancer Awareness Day – February 4, 2020Juneteenth Day – June 19, 2020Americans with Disabilities Act Awareness Day – July 26, 2020100th Anniversary of Women’s Suffrage Day – August 18, 2020Employ Older Workers Week – September 20, 2020Alaska Employ People with Disabilities Week – October 1, 2020Alaska Native Heritage Month – November 1, 2020Women Veterans Day – November 9, 2020Veterans and Remembrance Day – November 11, 2020Noteworthy this year were three landmark United States Supreme Court federalcivil rights cases in which the Court held that Title VII of the Civil Rights Act of 1964protects employees against discrimination on the basis of sexual orientation orgender identity. xiValuing the diversity of a workforce representative of all Alaskans enriches thequality of our service to the people of Alaska. The State supports EqualEmployment Opportunity (EEO) and Affirmative Action (AA) and continues towork to recruit and retain all qualified people. A primary goal of the State’s EqualEmployment Opportunity Program is to ensure that positions in public service aregenuinely and equally accessible to all people. While recruitment is essential, aninclusive work environment is crucial to retention.The State does not condone, permit, or tolerate illegal discrimination against itsemployees or applicants for State employment on the basis of race, color,national origin, religion, sex, age, physical or mental disability, marital status,changes in marital status, pregnancy or parenthood, genetic information, orstatus as a veteran or veteran with a disability.7 Page2021 Progress Report on EEO and AA in Alaska State Government
Report SummaryOverall, the 2021 Progress Report shows steady trends from the past year’s reportbut with slightly less representation of BIPOC employees in the Executive Branch.Last year marked an all-time high percentage of BIPOC employees at 24.1percent to this year’s 24.0 percent. Asian employees remain our most prominentnon-white racial group at 7.7 percent; and Alaska Native employees remain ourmost underrepresented group at 6.7 percent of our workforce. BIPOC employeescontinued the trend up in holding higher paying positions (Pay Range18 andhigher).BIPOC Black, Indigenous, and People of ColorThe percentage of women employees remain the same at 48.2 percent. Thereare 6,923 women employees in the Executive Branch, a decrease from last year’sreport of 7,008. Women continue to have the highest concentration in“Administrative Support” positions at 77.7 percent. However, women dominate inoverall percentages in nine of our 15 departments and half of the Administration’scabinet positions are held by women.The Report focuses on two areas: current incumbency levels of BIPOC andwomen in the State workforce and historical levels. It compares the ExecutiveBranch’s workforce demographics to that of the Alaskan Civilian Labor Force, thedata for which has been updated this year. 3The Report’s results allow the State to focus resources in those areas where ourincumbency levels are significantly less than the availability of women and BIPOCin the Civilian Labor Force. It highlights areas where there may be intentional orunintentional barriers of employment to women and BIPOC. While the Reportshows modest improvement in certain areas of the Executive Branch workforce,additional change is warranted, particularly in areas of occupational segregationand the underrepresentation of Alaska Native employees.3The Civilian Labor Force (CLF) is defined as all non-institutionalized (i.e. not incarcerated)civilians (i.e. not serving in the U.S. military) aged 16 and older who are either working orseeking employment (unemployed).8 Page2021 Progress Report on EEO and AA in Alaska State Government
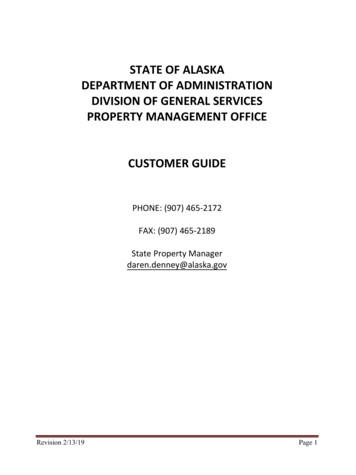
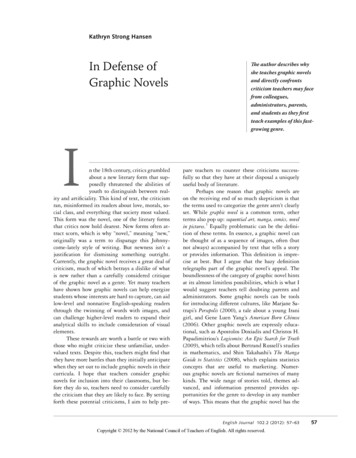
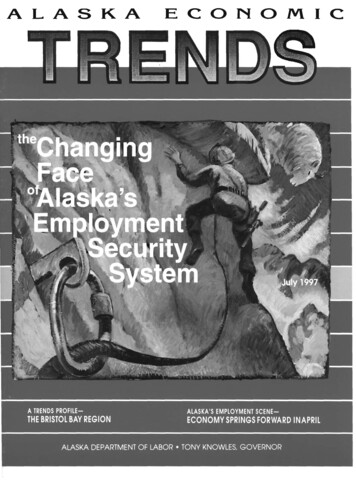
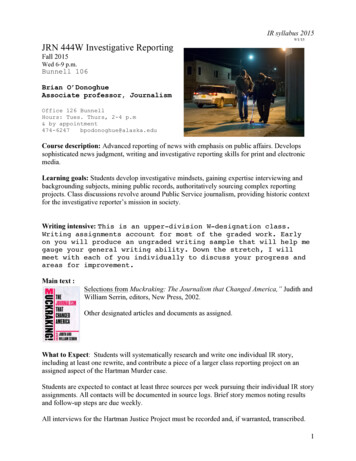
Current Outlook: BIPOC EmploymentEmployees from BIPOC groups now comprise 24 percent of the State’s ExecutiveBranch workforce. 4 This represents the second highest percentage on record(down 0.1 percentage points from last year’s report).Exhibit 1Exhibit 2EXECUTIVE BRANCHWORKFORCEBIPOC24%ALASKAN CIVILIANLABOR FORCEBIPOC31.6%WHITE68.4%WHITE76%While our workforce is made up of 24 percent BIPOC groups, the latest data fromU.S. Census reports the Alaskan Civilian Labor Force (CLF) is comprised of 31.6percent racial minorities. xii (See Exhibits 1 and 2).BIPOC Black, Indigenous, and People of ColorThis Progress Report relies on information from the federal U.S. Census Bureau,which uses American Community Survey data. This allows us to make generalcomparisons of the Executive Branch workforce to the Alaskan labor force, but itis important to note that data collection is based on similar but differentmethodologies and different collection times.Exhibit 3 shows the Executive Branch workforce broken down by sevenrace/ethnicity groups. In 2017, the federal U.S. Equal Employment Opportunity4Employee workforce data as of June 30, 20209 Page2021 Progress Report on EEO and AA in Alaska State Government
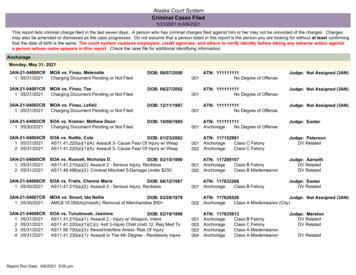
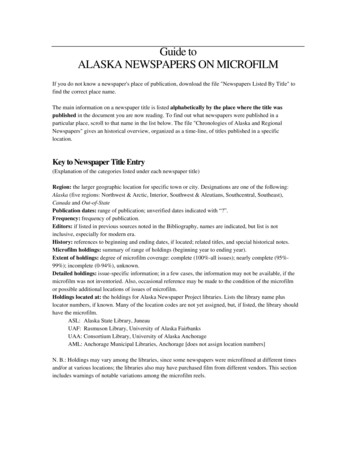
Commission changed its data collection requirements by expanding from fiverace / ethnicity categories to seven. 5 The current seven categories are:1) Alaska Native or Native American (Not Hispanic or Latino);2) Asian (Not Hispanic or Latino);3) Native Hawaiian or Pacific Islander (Not Hispanic or Latino);4) Black or African American (Not Hispanic or Latino);5) White (Not Hispanic or Latino);6) Two or More Races (Not Hispanic or Latino); and7) Hispanic or Latino.Exhibit 3EXECUTIVE BRANCH WORKFORCEBY RACE/ETHNICITYWhite76.0%African-American3.6%Alaska Native orAmerican Indian6.7%Two or MoreRaces1.5%Hispanic3.9%Asian7.7%Pacific Islander orHawaiian0.6%This year’s Progress Report reflects updated and the most current demographicdata available for Alaska’s Civilian Labor Force. As previously stated,race/ethnicity categories have changed over the years and this affects directcomparability of data from different sources, therefore, only general comparisoncan be made. Current data indicates that the Executive Branch is notunderrepresented in employees who identity as African-American or Black.5For definitions of the current race and ethnic categories, please see Page 31 in the Appendix.10 Page2021 Progress Report on EEO and AA in Alaska State Government
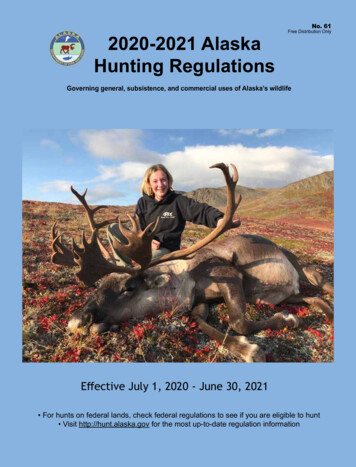
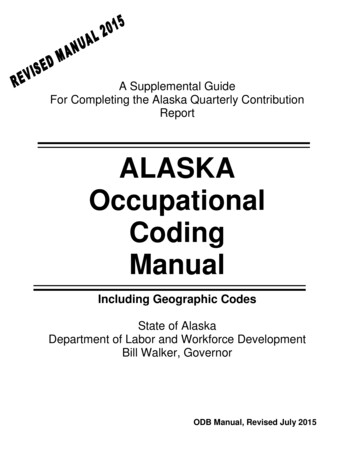
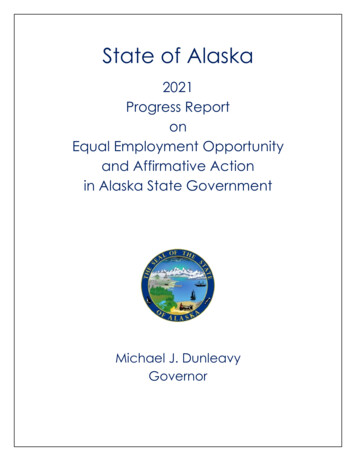
Alaska Native and Native American peoples (data captured in a singlecombined group) continue to be the most under-represented group in theExecutive Branch workforce by 5.3 percentage points. (See Exhibits 3 and 4)Exhibit 4ALASKAN CIVILIAN LABOR FORCEBY RACE/ETHNICITYPacific Islander1.2%Other1.7%Two or MoreRaces6.3%Hispanic6.5%Asian7.0%Alaska Nativeor 8.4%Alaska Native peoples are made up of many distinct cultures. The U.S. CensusBureau reported the largest is Yup’ik, followed by Iñupiaq, Athabascan, TlingitHaida, Aleut, and Tsimshian. xiii Most Alaska Native peoples live in rural Alaskaalthough the urban Native population has grown. xiv While more than half ofAlaska’s indigenous people live in villages or regional hubs, over 85 percent ofExecutive Branch employees work in urban Alaska.Did you know?Indigenous peoples of Alaska include Iñupiat, Yup’ik, Aleut, Eyak, Tlingit,Haida, Tsimshian, and Athabaskan cultures. Alaska is home to some 20distinct indigenous languages, reflecting the diverse cultural heritages ofAlaska’s first peoples. Approximately 25,000 people speak Central Yup’ik andAlaska Native peoples make up the largest race/ethnicity group in the state.Source: University of Alaska Fairbank, Alaska Native Language Center and US Census.11 Page2021 Progress Report on EEO and AA in Alaska State Government
To get a true picture of the status of BIPOC in State government, it is important tolook at the distribution within the workforce. The most current data revealsimprovement of non-white employees in higher level positions as shown in theEEOC’s eight job categories: Officials and AdministratorsProfessionalsTechniciansProtective Service WorkersParaprofessionalsAdministrative SupportSkilled Craft WorkersService Maintenance Exhibit 5 shows the current percentage of minorities in each of the job category. 6These job categories reflect different levels of job opportunity and are used bythe U.S. Equal Employment Opportunity Commission (EEOC) in conjunction withother labor force data to identify possible patterns of exclusion and discriminatorypractices. The EEOC requires state and local governments to submit biennialreports (EEO-4 Survey) showing the representation of men and women in eachracial/ethnic group in these eight job categories.Exhibit 5BIPOC EMPLOYEESBY EEO-4 JOB CATEGORYOfficials and 7%Protective Service Workers23.3%Paraprofessionals23.4%Administrative SupportSkilled Craft Workers34.3%20.3%Service-Maintenance648.6%For definitions of each job category, see Appendix Pages 32 and 33.12 Page2021 Progress Report on EEO and AA in Alaska State Government
Service-Maintenance Workers continue to comprise the largest concentration ofBIPOC employees at 48.6 percent. While minorities make up 24 percent of ourworkforce and approximately 31.6 percent of the Alaskan Civilian Labor Force(CLF), they hold 13 percent of the jobs held by “Officials and Administrators” and18.3 percent of jobs classified as “Professional.”Exhibit 6 shows the percentages of minorities in each of the 15 departments in theExecutive Branch as o
Alaska’s current pulationpo, estimated at 728,903, is in its fourth year of decline. ii. Knowledge of the Executive Branch’s workforce gives us awareness of how and where we need to continue to change to be an employer of choice. As our state government gets smaller, attracting and retaining the best workforce is vital to Alaska’s success.