Transcription
REEDLEY COLLEGEECONOMICOVERVIEW &PROGRAM GAPANALYSISPREPARED BY EMSIOCTOBER 2015
CONTENTS1EXECUTIVE SUMMARY1Overview of Regional Economy1Program Gap Analysis3INTRODUCTION4CHAPTER 1: OVERVIEW OF THE ECONOMY5Jobs by Industry6Jobs by Occupation8Commuting Patterns9Unemployment12 Educational Attainment16CHAPTER 2: PROGRAM GAP ANALYSIS16 Interpreting Gap/Surplus Analysis Results17 Postsecondary Certificate Level Gap Analysis19 Associate’s Level Gap Analysis19 Transfer Track (Liberal Arts) Students21 Potential New Programs22 Conclusion23APPENDIX 1: ABOUT EMSI DATA24APPENDIX 2: PROGRAM-TO-OCCUPATION MAPPING32APPENDIX 3: PROGRAM GAP ANALYSIS METHODOLOGY32 Supply and Demand Model32 Occupation Demand34 Education Output36APPENDIX 4: ALTERNATIVE GAP ANALYSIS CALCULATIONS36 Alternative Gap Analysis Tables39APPENDIX 5: DETAILED EMPLOYMENT PROJECTIONS
EXECUTIVE SUMMARYReedley College (RC) is located in the city of Reedley andthe RC Economic Region workers reside outside theserves four counties in central California. This report out-area, indicating that there are economic links betweenlines the economy of this four-county region (Fresno, Kings,the RC Economic Region and the surrounding com-Madera, and Tulare Counties) and provides a “gap” analysismunities for both out-commuters and in-commuters.to determine how well the college’s program offerings aresatisfying regional workforce demand. The report also The educational composition of the adult populationin the RC Economic Region (people age 25 and older)offers recommendations for new program development.has seen a small shift in recent years. Between 2009The following are some of the key findings of the analysis:and 2014, the proportion of adults with less than a highschool diploma increased by 2.7 percentage points andthe proportion with a high school diploma decreasedOVERVIEW OF REGIONAL ECONOMYby 1.3 percentage points. Meanwhile, the proportion ofadults with other levels of education decreased slightly The economy of the region served by RC (“the RC Eco-in the past five years; notably those with some collegenomic Region”) is primarily driven by the Government;and bachelor’s degree levels (decreased by 0.6 and 0.4Agriculture, Forestry, Fishing, & Hunting; and Healthpercentage points, respectively).Care & Social Assistance industries. The Agriculture,Forestry, Fishing, & Hunting and Health Care & SocialAssistance sectors added new jobs between 2009 andPROGRAM GAP ANALYSIS2014, but of the top three industries only the HealthCare & Social Assistance and Government sectors areprojected to grow through 2024. Management of Com- associate’s degree, there are a total of 12 programspanies & Enterprises and Agriculture, Forestry, Fishing,associated with significant workforce gaps.& Hunting are projected to lose jobs over the nextdecade. Overall the regional job growth is expected to be 13% over the next decade. pensation from related occupations is relatively lowSome high-skill occupational categories are projected(median hourly earnings 13.89). Accounting has thesecond largest certificate level gap (gap of 110; medianing healthcare practitioners & technical occupationshourly wage 16.67). Child Development/Early Care &(21% job growth), computer & mathematical occupa-Education, the third largest certificate level gap, has ations (20% job growth), and architecture & engineeringsignificant gap but is mapped to lower paying occupa-occupations (12% job growth).Between 2014 and 2024, the highest number of averageannual job openings for workers with postsecondarycertificates and above are projected to occur withinoffice & administrative support occupations; sales &related occupations; and education, training, & libraryoccupations. Around 21% of residents in the area commute outsideGeneral Office Occupations & Clerical Services hasthe largest certificate level gap (gap of 645), but com-to see high job growth over the next ten years, includ- Between both levels of postsecondary certificate andtions (gap of 90; median hourly earnings 9.90). The three largest associate’s degree level gaps are: General Office Occupations & Clerical Services (gap of 669;median hourly earnings 13.89), Child Development(gap of 72; median hourly earnings 9.90), and EarlyCare & Education (gap of 32; median hourly earnings 19.58). Some of these same programs have gaps at thecertificate level and associate’s degree level.the RC Economic Region for work and roughly 18% ofECONOMIC OVERVIEW AND PROGRAM GAP ANALYSIS 1
Licensed Vocational Nursing (surplus 182), Dental Assis-cultural animals to a high of 39.62 for electrical power-tant (surplus 182), and Child Development/Early Careline installers & repairers.& Education (surplus 114) are the three programs associated with the largest surpluses of completers at the tunity were for blue collar occupations like heavy &certificate level. tractor-trailer truck drivers, general maintenance &Nursing (surplus of 511), General Social Sciences (sur-repair workers, and industrial truck & tractor operatorsplus of 244), and Administration of Justice (surplus ofappear to be undersupplied in the RC Economic Region.176) are top three associate’s degree level surpluses.Some skilled trades are also among the top areas ofopportunity: electricians and carpenters.For some of the programs, RC is producing a moderate number of new completers, but additional supply The largest gaps in the programmatic areas of oppor- An additional four areas of opportunity are at the asso-from other regional institutions leads to the surplus.ciate’s degree level. Medical & clinical laboratory tech-It is possible that some of the completers are seekingnicians have the largest gap (gap of 10), but pay onlyemployment outside the RC Economic Region. 16.93 an hour. Other healthcare related occupations,There are 17 postsecondary certificate level areasof opportunity identified. Wage rates are in a rangebetween 12.27 for farmworkers, farm, ranch, & aqua-2 REEDLEY COLLEGEdiagnostic medical sonographers and medical equipment repairers, have small gaps but high wages (gapof 8 each; median hourly earnings over 20 an hour).
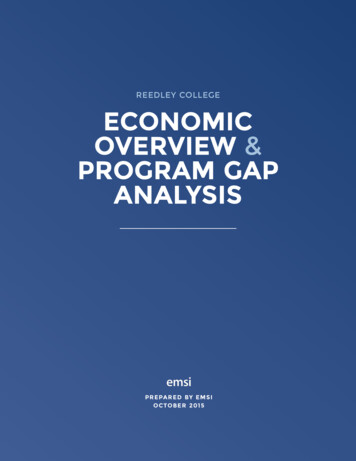
INTRODUCTIONColleges face many challenges in their efforts to identifyoversupply or an undersupply of skilled workers exists.the training needs of their Economic Regions. They mustThe goal of the analysis is to provide RC with relevant dataaccount for regional economic trends and the changingand information that it can use when solving problemsquality of the workforce. Furthermore, as technology pro-and making decisions about current and future programgresses, colleges need to address the increasingly complexdevelopment.and specialized skills required by employers. In light ofThe regional backdrop used in this report is defined bythese dynamics, an understanding of the regional economyFresno, Kings, Madera, and Tulare Counties. This regionaland the demand for skilled labor is vital to the planningbackdrop will be referred to as “the RC Economic Region”.efforts of colleges seeking to adapt their program offeringsRC is located in Fresno, CA.1 See Figure 1.1 for a map ofto the requirements of an ever-changing workforce.the region.To gain better insight into economic conditions andThe report is broken into two chapters. Chapter 1 pro-workforce trends, Reedley College (RC) partnered withvides an overview of employment in the RC EconomicEconomic Modeling Specialists Intl. (EMSI) to conductRegion economy with high-level information about currentan economic overview of the college’s Economic Regionand projected job trends, resident commuting patterns, andand a workforce “gap” analysis of the college’s programunemployment. Chapter 1 also provides further informa-offerings. Gap analysis is a technique used to assess thetion specifically related to the educational characteris-supply and demand of skilled workers and identify thetics of the population by gender and ethnicity. Chapter 2educational programs that need to be adapted in ordersummarizes the results of the program gap analysis andto fill any existing or future gaps. The analysis weighsprovides recommendations for possible future programthe educational output of RC and other regional institu-needs. After a brief conclusion, detailed information andtions against the number of job openings related to thedata are provided in the appendices.institutions’ program offerings to determine whether an1The industry and occupation data presented in this report reflect thenumber of jobs by place of work, not by place of residence. However, thereport does assess the commuting patterns of residents to determinewhere they live and work both within and outside of the region.ECONOMIC OVERVIEW AND PROGRAM GAP ANALYSIS 3
C HAPTER 1:OVERVIEW OF THE ECONOMYFIGURE 1.1: MAP OF RC ECONOMIC REGIONThis chapter provides a high-level overview of employmentand demographics in the economy of the RC EconomicRegion, defined by Fresno, Kings, Madera, and Tulare Counties (see Figure 1.1). The goal of the chapter is to providedata on the economic and workforce employment trendsthat either already exist or are developing in the region.Such information is crucial in building awareness of theregion’s labor force – both now and in the future – andidentifying priority areas where educators can focus theirattention. The chapter examines employment and demographics in the RC Economic Region according to the following five indicators: jobs by industry, jobs by occupation,commuting patterns, unemployment, and educationalattainment.FIGURE 1.2: JOBS AND JOB CHANGE BY INDUSTRY SECTOR IN RC ECONOMIC REGION, 2014 TO 20242014 Jobs2014–2024 ChangeNumber of 00140,000840 2213 3316519 340111 61430 309626416 50336223 971 0 0 0 0Agriculture, Forestry, Fishing and HuntingMining, Quarrying, and Oil and Gas ale TradeRetail TradeTransportation and WarehousingInformationFinance and InsuranceReal Estate and Rental and LeasingProfessional, Scientific, and Technical ServicesManagement of Companies and EnterprisesAdmin. & Support and Waste Mgmt. & Remediation ServicesEducational ServicesHealth Care and Social AssistanceArts, Entertainment, and RecreationAccommodation and Food ServicesOther Services (except Public Administration)GovernmentSource: EMSI Complete Data 2014.34 REEDLEY COLLEGE
JOBS BY INDUSTRYTogether these sectors made up 319,508 jobs or approximately 48% of total regional employment in 2014. TheEvaluating current and future employment by industryAgriculture, Forestry, Fishing, & Hunting and Health Careprovides information on the economic diversification of& Social Assistance sectors added new jobs between 2009a given region. Industries consist of groups of companiesand 2014 but the Health Care & Social Assistance andthat are primarily engaged in producing the same productGovernment sectors are projected to grow through 2024.or service. The North American Industry ClassificationOther industry sectors with notable projected growth areSystem (NAICS) is the structure used by the U.S. CensusAdministrative & Support & Waste Management & Reme-Bureau to classify establishments into industries baseddiation Services ( 12,064 jobs), Retail Trade ( 11,348 jobs),on their production process (although the final product orand Accommodation & Food Services ( 8,366 jobs). Theservice is usually similar for the firms in a given industry).industry sectors that are expected to contract between 2014NAICS applies a six-digit hierarchical coding system toand 2024 are Management of Companies & Enterprisesorganize more than 1,100 detailed industries into twenty(-1,469 jobs) and Agriculture, Forestry, Fishing, & Huntinglarger industry sectors. The breakdown of current and(-488 jobs).future employment by major industry sector in the RCTable 1.2 on the next page shows the employmentEconomic Region appears in Table 1.1 and Figure 1.2 onconcentration of the industry sectors in the RC Economicthe previous page.Region, measured in terms of location quotients (LQs). LQsAs shown, the three largest industry sectors in the RCare used to assess national competitiveness by compar-Economic Region are Government; Agriculture, Forestry,ing the concentration of employment in a given industryFishing, & Hunting; and Health Care & Social Assistance.against the concentration of employment for that sameTABLE 1.1: CURRENT AND PROJECTED JOBS AND JOB CHANGE BY INDUSTRY SECTOR, 2014 TO 2024NAICSCODEDESCRIPTION11Agriculture, Forestry, Fishing and Hunting21Mining, Quarrying, and Oil and Gas Extraction22Utilities232014 JOBS2024 JOBSCHANGE% ing42,57245,5522,9807%42Wholesale Trade20,23424,0703,83619%44Retail Trade65,77677,12411,34817%48Transportation and ,9543897%52Finance and Insurance13,96314,9389757%53Real Estate and Rental and Leasing54Professional, Scientific, and Technical Services55Management of Companies and Enterprises56Admin. & Support and Waste Mgmt. & Remediation Services61Educational Services62Health Care and Social Assistance71Arts, Entertainment, and mmodation and Food Services42,63951,0058,36620%81Other Services (except Public ce: EMSI Complete Data 2014.3ECONOMIC OVERVIEW AND PROGRAM GAP ANALYSIS 5
TABLE 1.2: EMPLOYMENT CONCENTRATION BY INDUSTRY SECTOR IN RC ECONOMIC REGION, 2014 AND2024NAICSCODEDESCRIPTION2014 LOCATIONQUOTIENT2024 LOCATIONQUOTIENT11Agriculture, Forestry, Fishing and Hunting13.2813.3921Mining, Quarrying, and Oil and Gas n0.770.7931Manufacturing0.790.8342Wholesale Trade0.760.8144Retail Trade0.931.0048Transportation and Warehousing0.950.9851Information0.450.4652Finance and Insurance0.510.5053Real Estate and Rental and Leasing0.750.7654Professional, Scientific, and Technical Services0.430.4255Management of Companies and Enterprises0.360.1856Administrative and Support and Waste Management and Remediation Services0.921.0161Educational Services0.460.4962Health Care and Social Assistance1.001.0271Arts, Entertainment, and Recreation0.560.5272Accommodation and Food Services0.760.8081Other Services (except Public Administration)0.890.8990Government1.191.18Source: EMSI Complete Data 2014.3industry across the nation. An LQ equal to 1 means thatlocation quotients in the RC Economic Region: Agriculture,the percentage of total employment comprised by anForestry, Fishing, & Hunting (13.28); Utilities (1.22); andindustry in the region exactly matches the percentage ofGovernment (1.19). The Agriculture, Forestry, Fishing, &total employment comprised by that industry in the nation.Hunting and Utilities industry sectors are considered toAn LQ greater than 1 means that the industry comprises ahave a comparative advantage. The relative concentra-greater proportion of total employment in the region thantions are expected to undergo some changes over the nextit does in the nation.decade, yet the same industry sectors are expected to beHigh LQs (usually anything greater than 1.2) are anabove the 1.2 cutoff.2indication that the region has a comparative advantageor specialization in certain industries relative to the restof the nation, or potentially to other competing regions.JOBS BY OCCUPATIONWhen evaluated jointly with job counts and expected jobgrowth, high LQs give a sense of the industry sectors thatResearchers often refer to industry data to get a sense ofhave the greatest potential for workforce investment andregional economic trends, but in order to better understandwhere regional economic development professionals arethe quality of the jobs contained within that region, somelikely to be focusing their efforts. This information is ofknowledge of occupations is needed. This is because theparticular importance to educators seeking to engage inlarger conversations with other organizations about aligning program offerings with workforce needs.The following three industry sectors have the highest6 REEDLEY COLLEGE2Note that because LQs represent regional employment relative tonational employment, a decreasing LQ does not necessarily meandecreasing employment, and likewise an increasing LQ does not necessarily mean increasing employment.
earning levels and education requirements of workersmajor group, with information on current and projectedbear more of a relationship to their occupation than to thejobs, job change, average annual openings, and wage rates.industry in which they work. For example, the Manufactur-Office & administrative support occupations compriseing industry – while employing a number of assemblersthe largest occupation group in the RC Economic Regionand machine operators – also employs people in manage-at 89,685 jobs, followed by farming, fishing, & forestryment occupations and in professional occupations suchoccupations at 84,209 jobs. Neither of these occupationas engineering. All of these occupations have different paygroups ranks among the highest paid, however. Healthcarescales and require varying levels of education and training.practitioners & technical occupations have median earn-Federal agencies use the Standard Occupational Classi-ings of 39.22 an hour, the highest on the regional payfication (SOC) system to classify workers into occupationalscale. Legal occupations – while the smallest occupationcategories based on work performed. The 2010 SOC systemgroup – have median earnings of 37.16 an hour, rankingcontains more than 800 detailed occupations organizedsecond highest on the regional pay scale. Several of theaccording to a five-digit hierarchical coding structure.higher-paying occupation groups are also projected toDetailed occupations with similar job duties are furtherexperience job growth over the next ten years, such ascombined to form 23 major groups. Table 1.3 shows thehealthcare practitioners & technical services occupationsbreakdown of employment in the RC Economic Region by(21%) and computer & mathematical occupations (20%).TABLE 1.3: CURRENT AND PROJECTED JOBS, JOB CHANGE, AND MEDIAN HOURLY EARNINGS BY MAJOROCCUPATION GROUP IN RC ECONOMIC REGION, 2014 TO 2024SOCCODEDESCRIPTION2014JOBS2024 JOBSCHANGE% 0000Management34,03335,5091,4794% 33.4480513-0000Business and Financial Operations21,12223,5362,41211% 27.5065715-0000Computer and Mathematical5,4056,5061,10220% 31.1719617-0000Architecture and Engineering5,0345,66062912% 37.1317519-0000Life, Physical, and Social Science5,3725,99560211% 29.2921621-0000Community and Social Service14,17216,3762,20016% 21.0551823-0000Legal25-0000Education, Training, and Library27-00003,6054,07246813% 37.1610744,17649,5965,42412% 23.841,399Arts, Design, Entertainment, Sports, andMedia6,6477,39675011% 16.9121629-0000Healthcare Practitioners and Technical31,82438,5476,72321% 39.221,28031-0000Healthcare Support16,01020,0374,03225% 12.9944633-0000Protective Service18,69820,7522,04211% 28.4751235-0000Food Preparation and Serving Related45,78554,4068,62119% 9.701,01437-0000Building and Grounds Cleaning and Maintenance24,96728,7003,73315% 11.1526339-0000Personal Care and Service24,50129,3424,85620% 9.7357241-0000Sales and Related60,82870,1489,31915% 13.881,84143-0000Office and Administrative Support89,685100,22910,55212% 15.532,03745-0000Farming, Fishing, and Forestry84,20985,0888811% 9.3249147-0000Construction and Extraction21,89624,8692,97714% 18.9926249-0000Installation, Maintenance, and Repair24,00228,2054,20218% 19.6649051-0000Production32,36436,6914,33813% 14.1741053-0000Transportation and Material Moving50,81759,1688,34716% 13.
summarizes the results of the program gap analysis and provides recommendations for possible future program needs. After a brief conclusion, detailed information and data are provided in the appendices. 1 The industry and occupation data presented in this report reflect the number of jobs by place of work, not by place of residence. However, the