Transcription
Moving to the Cloud:Estimating the Internet Connection BandwidthLuís Ferreira da Silva1, Fernando Brito e Abreu1,21) QUASAR, CITI, FCT/UNL, 2829-516 Caparica, Portugalluis.silva@di.fct.unl.pt2) DCTI, ISCTE-IUL, 1649-026 Lisboa, Portugalfba@iscte.ptAbstractIT Infrastructures (ITIs) have long been understood in terms of people and resources suchas servers, routers, firewalls and operating systems, among other components, running andproviding services inside the organization. The need to reduce the cost of ITI ownership, byoffloading its capacity to third parties, has motivated organizations to consider the CloudComputing alternative. The main drawback they face when opting for the cloud is thedependency on and requirements of the internet connection, since it must be fast andreliable. This paper addresses this concern by providing guidelines for estimating internetconnection bandwidth requirements for a prototypical cloud-based organization representedby means of an IT infrastructure pattern. ITI patterns are reusable and proven solutions tosupport the ITI design process and to facilitate the communication among stakeholders.Keywords: Information Technology, IT Infrastructure, Design Patterns1 IntroductionCloud Computing is an attractive offer because it can provide several capabilities toorganizations. Among those capabilities are (i) the unlimited computing power, (ii) broadnetwork access from anywhere and from multiple devices (e.g. tablets, computers, mobilephones, etc.) and (iii) reduction of IT costs due to automation and elasticity that alloworganizations to pay only for what they consume. There is little consensus on how to define theterm Cloud Computing [Geelan 2008]. The US National Institute of Standards and Technology(NIST) defines Cloud Computing as “The model for enabling convenient, on-demand networkaccess to a shared pool of configurable computing resources (e.g., networks, servers, storage,applications, and services) that can be rapidly provisioned and released with minimalmanagement effort or service provider interaction.” [Mell, Grance et al. 2009]. Cloud-basedsolutions existing today, include communications solutions (e.g. email, online meetings,telephony), collaboration solutions (intranet and extranets, document storage, workflows),business applications, storage, ITI management software and other ITI solutions. There are threemain delivery models in Cloud Computing, which are Software as a Service (SaaS), Platform asa Service (PaaS) or Infrastructure as a service (IaaS). In the SaaS delivery model an applicationis offered to a user as a service. The user consumes the application through an interface such aweb browser or plug-ins and not a “locally-installed” application. Examples of SaaSapplications include E-mail, Customer Relationship Management (CRM) and Web and Videoconferencing software. The PaaS delivery model consists in an application platform to build
applications and services completely from the internet, without the need to download and installsoftware. Like any application platform, a PaaS environment includes design, development,testing, deployment and hosting. The PaaS provides also the supporting infrastructurecapabilities, such as authentication, authorization, session management, transaction integrity,reliability, availability, and scalability. The IaaS is a delivery model in which an organizationoutsources the equipment used to support operations, including storage, hardware, servers andnetworking components. These three cloud delivery models provide several cloud-basedsolutions that virtually replace all services currently provided by installed ITIs within theorganization.Cloud Computing is more a computing model than a technology. This computing modelassumes that services are delivered over the internet (with the exception of private clouds whereservices are provided inside the ITI). Cloud Computing uses technologies like virtualization(farms of physical servers with multiple virtual machines), automatically provisioning (serversinstalled unattended and automated) and internet connections.The use Cloud Computing solutions is becoming simple, since all that is really needed is anITI LAN with an internet connection with enough bandwidth and a credit card or other paymentmethod to subscribe the service. Large organizations often have more than one internetconnection (for redundancy) with enough bandwidth, they use several appliances to providetraffic optimization, traffic shaping and in most cases connection are symmetrical (sending andreceiving data at the same rate). Small and medium organization however frequently have asingle internet provider through a single port on a router and all systems connecting through theLAN share the Internet bandwidth equally. Independently of the organization size moving fromservices provided by local ITIs to online services provided by cloud vendors presents severalnetworking challenges [Zhang, Cheng et al. 2010].The main focus of the paper is to present an ITI cloud pattern, to simplify the challenge taskof estimating the amount of bandwidth required when organizations decide to provide servicesin public clouds.2 Related Work2.1Network PerformanceThe network performance effectiveness often depends directly on the efficiency with which anetwork delivers data [Peterson and Davie 2000]. The most common terms used to refer theoverall network performance are the speed, bandwidth, throughput and latency. These terms areoften presented as synonyms but they are different. The term speed is generic and often refers tothe nominal speed of a networking technology (e.g. Fast Ethernet has a nominal speed of 100megabits per second). Bandwidth represents the maximum amount of data that can be movedover a given link or connection in a unit of time. The throughput is the actual speed over a linkor connection (e.g. an organization may have a network with 100 Mbps Ethernet and athroughput of 75 Mbps for instance). The throughput of a network is measured in bits persecond and is the average data rate over a specific communications link. Latency or delay is thetime (usually measured in ms) required to transfer a single empty message from one source tothe destination (the higher the latency the longer it takes to transfer data) and can be measuredas round-trip time (also known as the ping time). Research has been conducted to minimize theimpact of latency and maximize network capacity through effectively manage networkcommunications to deliver data using the most efficient path with the highest availablebandwidth to provide higher quality. The quality is measured by the data flow consistency interms of performance and is considered good when is above 90%. If there is congestion (toomuch traffic) or regulation (intentional ISP delays) and the data flow at different speeds thepercentage will drop. Notice that even a slow connection can have 99% quality. A fast
connection speed with inconsistent throughput can present more application problems (e.g.VoIP), than a slower connection with consistent throughput. Other common used metrics thatshould be assessed when evaluating a change to a public cloud are Transfer Time, TransferRate, Quality and TCP Window Size. The Transfer Time is the time that individual messagestake to be transferred between two interconnected computers. Transfer Rate represents thespeed at which data can be transferred (usually measured in bps) from one place to another.With the Latency and Transfer Rate it is possible to calculate the time to transfer a message witha specific number of bits (message size). The TCP Window Size is the maximum amount ofreceived data, in bytes, which specifies the number of bytes that can be buffered at one time onthe receiving side of a connection. The sending host can send only that amount of data beforewaiting for an acknowledgment. The window size can be defined in servers, however specialcare must be taken since changing this setting will affect the amount of memory (for buffering)needed. Another option is to use WAN accelerators at each end, which will use a larger TCPwindow without requiring tuning on servers.2.2Bandwidth estimationBandwidth estimation has been an active area of research for several years. There are three mainbandwidth related metrics which are (i) capacity that represents the maximum link transmissionrate, (ii) available bandwidth which is the unused or spare capacity during a certain time period,and (iii) bulk transfer capacity that can be defined as the maximum throughput achievable by asingle TCP connection. Obtaining bandwidth indications like those, provides valuableinformation to assess existing network ITIs and to support the definition of a cloud strategyplan. Several techniques and tools for predicting bandwidth across network paths have beenproposed to obtain more efficient end-to-end communications, such as Available BandwidthEstimation Techniques and Tools (ABETTs) [Prasad, Dovrolis et al. 2003]. These techniquesand tools can be useful to improve the speed of services provided by performing actions such asmonitoring and verifying SLAs, determine the best network topology to maximize efficiency,among other aspects. The main limitation with ABETTs is that not all tools are suited toestimate bandwidth across internet access technologies [Guerrero and Labrador 2010].Most of these tools work by injecting specially designed streams of probe packets and thenobserve the end-to-end delays to estimate the available bandwidth. The techniques used withthese tools vary and can be classified in direct probing and interactive probing. In direct probingit is assumed that the tight-link1 capacity is known and each probing stream results in a sampleof the available bandwidth. Examples of these techniques are Delphi [Ribeiro, Coates et al.2000], IGI [Ningning and Steenkiste 2003] and Spruce [Strauss, Katabi et al. 2003]. Interactiveprobing does not assume any knowledge about the tight-link capacity and is based in selfinduced congestion which consists of sending streams of packets whose input rate iterativelyincreases. The available bandwidth is the lowest input rate overloading the network. Examplesof these techniques are Train of Packet Pairs (TOPP) that uses trains of packet pairs in eachprobe stream [Melander, Bjorkman et al. 2000], Self-Loading Periodic Streams (SLoPS)[Suman Banerjee 2000; Jain and Dovrolis 2003] and ”chirps” which are streams ofexponentially spaced packets [Ribeiro, Riedi et al. 2003].There are numerous network measurement tools, mainly focusing on performanceevaluation. There are two network measurement techniques which are passive and activemeasurement. The passive measurement relies on monitoring existing traffic between end-hoststo extract estimates. Tools for passive measurement do not generate extra traffic. Examples ofthese types of tools include Nettimer (for bandwidth estimation), Viznet (for throughput tests),Sting (for latency tests) among others. These measurement tools are less applicable due to thefact that existing traffic is not always suitable to produce an indicative estimate [Saroiu,1- link with the minimum available bandwidth of a path
Gummadi et al. 2002]. Active measurement encompasses sending streams of probing packets toexplore the entire network. Example of active measurement tools include bing, b c probe, clink,iperf, netperf, pathload, pathrate, PathView, pchar, SProbe, TReno, ttcp, nttcp, Nettimer andpathchar, among others, as described in the performance measurement tools taxonomymaintained by CAIDA [CAIDA 2011].3 CloudTraffic Estimator PatternThe concept of ITI conveys the use of various components of information technology(hardware, software and network infrastructure) upon which IT services are provided [Sirkemaa2002]. To be aligned with the business ITIs must be quickly adapted to support newtechnologies or paradigms (e.g. Cloud computing, Grid services, Web services, internetapplications, and application integration) and new types of services (e.g. wireless, broadbandmedia, and voice services), while enforcing stronger access control and auditing policies andkeeping high degrees of flexibility and agility.In such a scenario, one of the major problems faced by ITIs is their increasing size andcomplexity, that may jeopardize the delivery of real business value [Sessions 2008]. The sizeand complexity are often the result of ITIs created, designed or adapted by non ITI experts suchas business decision makers, consultants, administrators, developers, software engineers,solution architects and other individuals (sometimes conflicting due to their own point of view)without ITI design guidelines, the migration of a simple application to the cloud may affect allthe services provided. Designing or changing ITIs is a challenge task mainly because it requiresknowledge of existing organization processes, the views of different players, and thecoordination of technical expertise in three ITI domains (hardware, networking andinfrastructure software) that rarely reside in a single individual.The design of solutions is achieved in most engineering fields by using appropriateabstractions. Although often the devil is on the details, raising the level of abstraction allowspractitioners to find, share and apply standardized solutions to recurrent phenomena, by onlyretaining the information which is relevant for a particular purpose.In the area of IT infrastructures the application solutions to recurrent problems was caught asa business opportunity by several companies to standardize typical ITI building blocks based ontheir commercial components. Some of those companies developed methodological approachesto ITI pattern-based design, by proposing design “blueprints” embodying vendor-specificcomponents [Trowbridge, Mancini et al. 2003; Lofstrand and Carolan 2005].The use of ITI design patterns can be seen as a process to simplify the ITI design process,while reducing its risk and cost through the use of well-known solutions for recurrent problems.The solutions addressed by design patterns are not intended to be static and final. In fact, theyare templates that can be customized and extended. Design patterns help breaking ITIcomplexity into smaller modules, thus allowing architectural decisions to be taken at a higherabstraction level. Design of infrastructures using this approach makes them more robust,scalable, reliable, and maintainable.This following section presents one of several ITI design pattern for cloud computing withthe name “CLOUDTRAFIC ESTIMATOR”. From the several ways to organize patterns[Gamma, Helm et al. 1995; Buschmann, Meunier et al. 1996; Fowler 2006] we decided to use astructure similar to GoF, since it is one of the most structured and well-known forms.
CLOUDTRAFFIC ESTIMATOR3.1ContextThe level of connectivity to access a public cloud is crucial to make the cloud deliver the bestservices. Different organizations have different sizes, require different services and havedifferent needs. Depending on the bandwidth of the internet connection and the amount of dataexchanged with the cloud provider, the experience for end users may vary. Most organizationssimple assume they need a broadband IP VPN, whether or not the latter delivers theperformance, reliability, availability and security required to access the public cloud.3.2ExampleAn organization has several applications hosted in internal ITI and an internet connection toprovide employees access to the internet and to some internal applications such as corporate email that needs to exchange messages with other corporations via internet and “customerfacing” applications. There is also some applications developed in-house which are businesscritical and heavy utilized during some periods. Mainly to reduce computing costs, achieve amore flexible computing environment and ensure capacity is there when needed, thisorganization decided to embrace Cloud Computing and evaluate the impact on internetconnection bandwidth of moving some of these applications to a public cloud.3.3ProblemHow to estimate the required internet bandwidth when moving applications to a public cloud?3.4ForcesThe following forces influence the solution: Traffic Pattern: The internet traffic produced by users, applications or network devices,may vary according to a period of the day, week, and month, what influences therequired bandwidth. Multiple Purposes: The internet connection is shared between users and applicationsand network devices. The available bandwidth has impact in the user’s experience. Capacity: The number of users, applications and network devices influence the internetbandwidth requirements. More applications in cloud tend to require more internetconnection bandwidth. Operations: The internet bandwidth requirements are influenced by the type ofoperations performed. Different users, applications or network devices performdifferent operations and may require different bandwidth requirements.3.5SolutionEvaluate network performance by using traffic generators, network analyzers and activemeasurement tools and create a network capacity plan.The network capacity plan is an important instrument to define what services and applicationscan be migrated to the cloud and what will be the impact on existing infrastructure. The networkcapacity plan should be integrated with cloud adoption strategy, which has detailed informationregarding business objectives, effort, business impact and cost analysis, risks, among otheraspects. The general objectives of the network capacity plan are: Understand current services and applications network capacity requirements. Document assumptions regarding requirements and workload forecasts. Define the required network capacity forecast for services and applications.
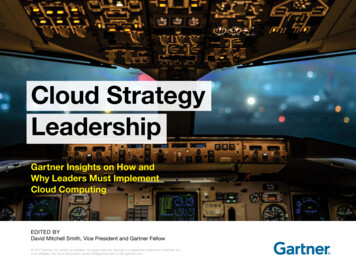
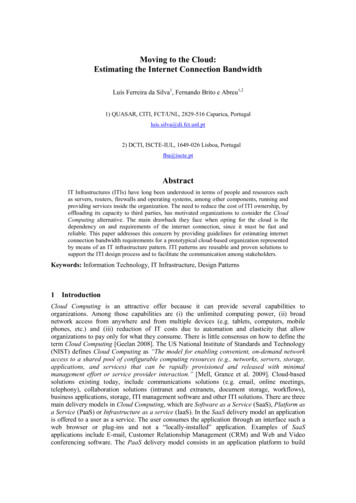
Provide network recommendations to ensure that there is sufficient network capacity tosupport the forecasted workload.It is important that the network capacity plan includes the (i) Definition of Service LevelRequirements that should categorize services and applications, quantify user’s expectations,define workloads and identify service levels for each workload, the (ii) Analysis of CurrentCapacity to understand services and applications requirements on internet connectionbandwidth, and the (iii) Planning for Future Capacity to forecasts future needs and systemrequirements by determining future processing requirements to maintain the service levels.To evaluate network performance there are two types of tools that can help to analyze currentcapacity and plan future capacity which are (i) Traffic Generators and (ii) Network Analyzers.The Traffic Generators also called load generators are used to generate dummy packets andkeep track of the packet delivery in the network and useful to view and analyze the performanceand capacity of existing devices, network topologies and internet connections. NetworkAnalyzers are important to provide more information regarding ITI internal applications anddetermine connection requirements needed to support users through a network traffic analysis.This analysis must capture incoming and outgoing traffic data to and from each application. Atypical system to perform these analyses has three components: (i) sensor (or sensors), (ii)collector and (iii) reporting system. The sensor is also known as a probe, and is an agent thatlistens to the network and captures traffic data. The sensor may capture traffic from switches,routers and firewalls, among other devices. The collector is a server that receives and stores datafrom sensors. The reporting system is responsible for analyzing stored data and producingnetwork traffic reports (Figure 1).Figure 1 – Incoming and Outgoing traffic captured using network analyzers.Multiple networking factors can have impact and affect the delivery of data between theorganization and the cloud. The network capacity plan should include details regarding lat
connection speed with inconsistent throughput can present more application problems (e.g. VoIP), than a slower connection with consistent throughput.Other common used metrics that should be assessed when evaluating a change to a public cloud are Transfer Time, Transfer Rate, Quality and TCP Window Si