Transcription
Aging in BostonPreparing today for a growing tomorrowSPRING 2014A research report from the City of Boston’sCommission on Affairs of the Elderly andthe Gerontology Institute at UMass Boston
About the AuthorsThis report was prepared by the Center for Social and Demographic Research on Aging, in consultation withstaff from the City of Boston Commission on Affairs of the Elderly. Individuals responsible for the report includeJan E. Mutchler, Bernard A. Steinman, Caitlin Coyle, Hayley Gleason, Jiyoung Lyu, and Ceara Somerville.CENTER FOR SOCIAL AND DEMOGRAPHIC RESEARCH ON AGINGGERONTOLOGY INSTITUTEJOHN W. M c cORMACK GRADUATE SCHOOL OF POLICY AND GLOBAL STUDIESUNIVERSITY OF MASSACHUSETTS BOSTONAcknowledgmentsThe authors are grateful to Emily Shea, Commissioner on Affairs of the Elderly, for her leadership as the report wasconceptualized and developed. We thank Melissa Carlson, Deputy Commissioner for Advocacy and Planning, and Tula Mahl,Deputy Commissioner for Communication and Policy, for their insight and advice throughout the creation of this report.Ellen Bruce, Director of the Gerontology Institute at UMass Boston, provided valued advice and support. We also appreciatethe assistance of staff at the Boston Redevelopment Authority who provided guidance on developing neighborhood data.Recommended Citation:Mutchler, Jan, Bernard Steinman, Caitlin Coyle, Hayley Gleason, Jiyoung Lyu, and Ceara Somerville. “Aging in Boston: Preparing today for a growingtomorrow” (2014). Gerontology Institute Publications. http://www.umb.edu/demographyofaging
A Message from the MayorBoston’s senior citizens are responsible for forming and building thisCity. They have shaped our values as a community and have raised thebar ethically. As Mayor of Boston, it is a priority to me as well as myentire administration to recognize, support and learn from them.Our seniors deserve nothing less.For these reasons, I am proud to release “Aging in Boston.”The data collected for this report will help us understand the full rangeof challenges our seniors face, so that we can provide the right solutionsto meet their needs. This data will also show that our population ofelders is growing, and we need to do a better job of connecting them – not only with each other,but with essential services.According to a 2010 census, 88,000 older adults resided in the City of Boston. Projections show thatby 2030, the number of older adults in Boston will grow considerably, comprising about one fifthof the City’s population. This type of increase will place demands on our resources and services.Thankfully, because of the collected data, we now have the knowledge we need to plan for this growthand better serve our elders, today and in the future.The goal and mission of my Administration and the City of Boston’s Elderly Commission is toenhance the quality of life for Boston’s older adults. The only way to achieve this is to understandwho they are: their age, gender, race, education, income, housing situation, level of mobility,health and disabilities. By sharing our collected data with providers, funders and planners, andencouraging organizations to use this report, they will be able to identify gaps, plan programsand services, and leverage funding.I am committed to addressing all of the challenges our seniors face and to making the changesrequired to support our aging population. By working together, we can find solutions that bestserve all our residents.Martin J. WalshMayor of Boston
A Message from the ChancellorAt the University of Massachusetts Boston, we take pride in being part of agreat city that is rich in history, talent, and diversity. Working with and onbehalf of Boston and the Commonwealth is part of our institutional DNA—a valued and central component of our mission. The Gerontology Instituteand Department at UMass Boston have a long tradition of contributingto this mission through research, service, and teaching. Our gerontologyeducational programs and the research conducted by our faculty, students,and staff on aging issues, policies, and populations serve as a model forwhat it means to be part of a great urban public research university.This report on aging in the City of Boston sheds light on the opportunities and challenges posed by ourgrowing senior population. Our older residents are a link to Boston’s history, a city they built, raisedtheir families in, and made great. Our seniors are also a bridge to Boston’s future, a future in which theolder population will be larger and more diverse than ever before. Ensuring that our older family members, friends, and neighbors are provided with opportunities to participate in and contribute to thecommunity is key to addressing the challenges that Boston faces on a daily basis. Safeguarding seniors’access to economic security, health care, and quality of life is our responsibility as members of a civilsociety. These values are shared by the City of Boston Commission on Affairs of the Elderly and by theGerontology Institute and Department at UMass Boston.As Chancellor of UMass Boston, I am proud that the city turned to us to help identify and address thegrowing needs of our senior population, and I look forward to our continued role in this conversation.Chancellor J. Keith Motley, PhD
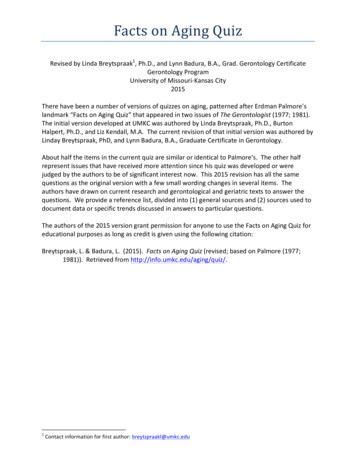
Aging in BostonPreparing today for a growing tomorrowIntroductionBoston’s population is becoming older than ever before. The oldest Baby Boomer isapproaching 70 and reinventing what it means to be a “senior citizen.” Waves ofBoomers will forge a new path into later life, creating a population of seniors1 that islarger and more long-lived than previous cohorts, and diverse in new ways. In 2010,more than 14% of Boston’s residents were 60 years or older, representing 88,000 olderpeople. By 2030, projected increases in the older population will result in as many as130,000 seniors residing in Boston2. How will Boston accommodate its growing olderpopulation? What steps may promote livability for Boston residents of all ages; whereresidents will want to, and can expect to, age in place with security, dignity, andwell-being?This report was produced in collaboration between the Boston Commission on Affairsof the Elderly and the Center for Social and Demographic Research on Aging at theGerontology Institute of the University of Massachusetts Boston. Its aim is to offer aglimpse into important issues relating to aging in Boston. The demographic profilepresented here highlights the city’s cultural, racial and ethnic diversity as a centralcontext for the changing needs and concerns of older Bostonians. Potential challengesrelating to health and caregiving, social engagement, income security, and housing areidentified; as well, the opportunities presented by an older population are recognized.3ResultsPast and future growth of the senior population in BostonAn escalating number of Boston residents are becoming “seniors” on a daily basis.According to the 2010 Census, roughly 88,000 Boston residents were age 60 or older,reflecting an increase of 11% between 2000 and 2010 in the number of Boston seniorsand far outpacing growth in the size of the all-age population of Boston, which increasedConsistent with language in the Older Americans Act, individuals age 60 and over are referred to as“seniors” in this report.2 See sources on Figure 1 below.3 For additional data on the older and Baby Boomer populations in Boston, seewww.umb.edu/demographyofaging51
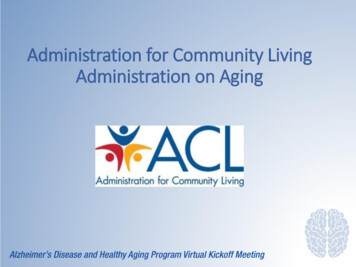
by just 5% during the decade. In coming years, the number of seniors is expected tocontinue to grow at a rapid pace (see Figure 1). Three sets of projections are presented inFigure 1, all suggesting that the number of Boston residents age 60 or older will increasesubstantially in coming years. Projections suggest that by 2030, between 120,000 and130,000 seniors will reside in Boston. These projections indicate that the share ofBoston residents who are seniors will be approaching 20% within just a few years, upfrom 14% based on the 2010 U.S. Census. Throughout this time period, a majority ofseniors will continue to be women. Nearly 6 out of 10 Boston residents age 60 and olderare women, as are two-thirds of seniors age 80 and older. The high representation ofwomen in the older population is largely a result of women surviving to older ages thando men.Figure 1: Number of Boston residents age 60 ,1990-2010, and projections to 2030130,000Number of proj.)Source: Donahue projections are prepared by the UMass Donahue Institute(http://pep.donahue-institute.org/) MAPC projections are prepared by the Metropolitan AreaPlanning Council (MAPC), an organization based in Boston. MAPC-high projections assumestronger population growth and are recommended by MAPC for use by municipalities.Growing diversity in the senior populationRace and ethnicityBostonÕ s status as a Ò majority-minorityÓ city was established in 2000, when the share ofresidents who identified as Hispanic, African American, Asian, or other nonwhite races6
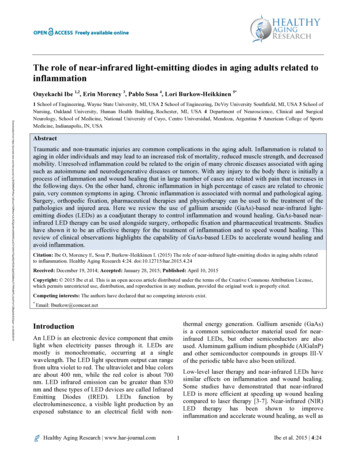
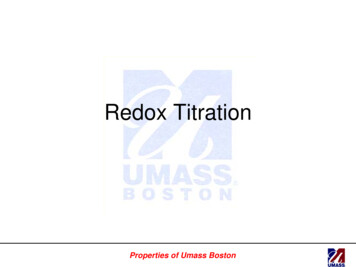
increased above 50% for the first time4. Boston’s senior population is quicklyapproaching that same designation: in 2010, 45% of seniors were persons of color.Changes in the diversity of the older population are notable over the last decade. Asillustrated in Figure 2, the number of seniors who are White declined by 3% between2000 and 2010. In contrast, the nonwhite population age 60 and over grewconsiderably. The number of Black seniors increased by 37%; the number of older adultswho are Asian, Native Hawaiian or Pacific Islander increased by 52%; and seniorsreporting some other race or a combination of races grew by 35%. In addition, thenumber of Latinos age 60 and over in Boston increased by 85% during that time period,nearly doubling in number.Figure 2: Change in number of Boston residents age60 , by race and ethnicity, 2000-2010100%85%80%60%52%37%40%35%20%0%-3%White alone Black or African Asian or NHPIAmerican alonealoneSome otherrace*Hispanic orLatino**-20%Source: 2000, 2010 Census, Summary File 2, Table QT-P1.*Includes individuals listing more than one race.**Hispanics may be of any race.Projections are not available by ethnicity and race for older age groups, yet trends inrecent years suggest that the diversity of the older population will continue to evolve.A comparison of today’s seniors with slightly younger age groups also supports thisconclusion. Data from the 2010 Census show that one-quarter of Boston seniors areBlack or African American, while 9% are Asian, Native Hawaiian or Pacific Islander andUnless otherwise indicated, all data in this report are from the U.S. Census Bureau decennial censusprogram or American Community Survey program.74
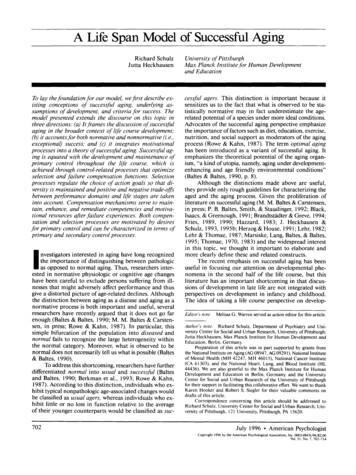
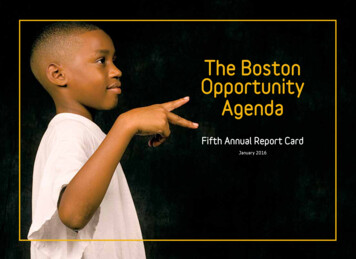
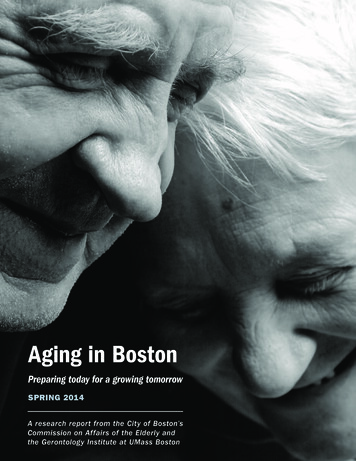
7% are some other race, or report more than one race (see Figure 3). Among those whoare age 45-59, larger shares report nonwhite race. Year by year, as midlife individualsage into their 60s and beyond, racial diversity within the senior population will increase.The percentage of seniors who are Hispanic or Latino will also expand in coming years.The share of adults age 45-59 who are Hispanic, at 16%, is considerably higher than theshare of today’s seniors who are Hispanic (10%). Boston seniors in coming years willinclude considerably more Hispanics as these individuals move into later life.Figure 3: Percentage by race, ethnicity, and age group,Boston residents, 201070%60%59%51%50%40%30%Age 60 29%25%Age 45-5920%9% 8%10%7%12%16%10%0%White alone Black aloneAsian or Some other Hispanic orNHPI aloneraceLatinoSource: 2010 Census, Summary File 2, Table QT-P1.Language, English proficiency, and citizenshipGrowing racial and ethnic diversity has implications for the mix of languages used inhomes and neighborhoods throughout the city. In Boston, as in most U.S. communities,an individual benefits from proficiency in English as he or she seeks to effectivelycommunicate with medical providers, service providers, and employers. Although manyorganizations in Boston take measures to meet the needs of individuals who havelimited English proficiency, not speaking English well can pose a barrier to accessamong older adults. Taking all residents age 60 and over into account, 67% speak onlyEnglish, and 13% speak English well or very well, though not exclusively (see Figure 4).The remaining 20% have limited English proficiency: 12% speak English poorly and 8%do not speak English at all. Moreover, nearly one in five Boston residents age 60 and8
over, or approximately 18,000 seniors, live in “linguistically isolated” households inwhich all members age 14 and older have limited English proficiency. These individualsand their families may need interpreter services if they are to take advantage of servicesand supports available through the community.Figure 4: English proficiency among Boston residentsage 60 19%20%18%16%14%12%12%10%8%6%8%7%6%4%2%0%Speaks English Speaks English Limited Englishvery wellwellproficiencyNo EnglishproficiencyLinguisticallyisolatedSource: American Community Survey IPUMS data, 5 year file, 2007-2011.Note. 67% of Boston seniors speak English only.Many different languages are spoken by Boston seniors, but important shifts in thelanguage profile are evident. As noted, one-third of Boston residents age 60 and olderspeak a non-English primary language. Nine percent speak Spanish as their primarylanguage, 5% speak Chinese, 3% speak French Creole, 3% speak Russian, and 13% speaksome other language. As shown in Figure 5, a shift in the common languages spoken byBoston seniors can be anticipated in the near future. Most significantly, Spanish is farmore commonly spoken by adults age 45 to 59 than among adults age 60 and over (16%,compared to 9%), while Russian is less common among this younger cohort. Servicesand supports accessible to Spanish-speaking seniors will increasingly be needed inBoston.9
Figure 5: Non-English primary language spoken byBoston residents, by age group18%16%16%14%13%12%10%11%9%Age 45-598%6%5% 5%4%Age 60 Source: American Community Survey IPUMS data, 5 year file, 2007-2011.Note. 67% speak English onlyNearly two-thirds of Boston residentsage 60 and over were born in the UnitedStates, a U.S. territory, or abroad of U.S.parents (see Figure 6).5 Among theone-third who immigrated to the U.S.,most have become citizens throughnaturalization. Yet 11% of all Bostonseniors are not citizens of the UnitedStates. This represents a sizable share ofseniors who may have limited eligibilityfor important services and supports,especially those provided to citizens atthe federal level.Figure 6: Immigrant statusand citizenship among Bostonresidents age 60 25%NaturalizedcitizenNot a citizen64%11%U.S. bornSource: American Community Survey IPUMSdata, 5 year file, 2007-2011.Individuals born in the United States, in a U.S.territory, or abroad of U.S. parents are all U.S.citizens by birth.510
Social and economic characteristics of Boston seniorsAll of Boston’s residents, regardless of age, need safe and affordable housing,opportunities to participate in the community and maintain valued social relationships,resources to promote their physical and mental health, and access to services andsupports when their own capacities fall short. Some seniors need more help achieving ahigh quality of life than they did at younger ages, and some individuals and families maybenefit from the coordination of formal services and supports. Many older peopleexperience physical and social changes that could threaten their independence andwell-being, if not addressed by specialized and targeted services. Moreover, thecharacteristics of appropriate services and supports can be different for older adultsthan for younger residents. Available transportation options, medical services, andhousing features may be mismatched with older residents’ needs, for example.Housing and living arrangements among seniors in BostonSeniors are well represented within Boston households. Nearly one in four (23%)occupied housing units in Boston are headed by an individual who is age 60 or older(see Figure 7). Seniors are overrepresented as homeowners, with approximatelyone-third (32%) of owner-occupied units being headed by seniors, whereas 19%of renter-occupied units are rented by seniors.Figure 7: Percent of housing headed by seniors inBoston19%Renter-occupied32%Owner-occupiedAll occupiedhousing23%0%5%10%15%20%25%Source: 2010 Census, Summary File 1, Table H17.1130%35%
Relative to many other urban housing markets, Boston housing includes a large share ofmulti-family housing, older housing, and rental housing. Seven out of ten seniors live ina building with two or more families, and half of seniors live in housing units that werebuilt before 1940. Living in multi-family housing may pose a challenge for seniors wholive on upper floors if the building lacks an elevator. Older homes may presentchallenges to older adults who have difficulties with home maintenance, or who live inhomes with design features that are not appropriate for their needs. Nearly half ofBoston seniors (48%) live in a rented home, while 28% own a mortgaged home and 24%own a home free and clear (see Figure 8). Although homeownership constitutes animportant source of wealth for many seniors, expenses associated with owning andmaintaining a home can be prohibitive, especially when the home is mortgaged.Additional information on the expense burden of housing is offered later in this report.Figure 8: Percent of Boston residents age 60 living inowned or rented homes*24%Rented home48%Mortgaged homeHome owned free andclear28%Source: American Community Survey IPUMS data, 5 year file, 2007-2011.*Categories indicate the ownership status of the home in which the olderadult lives; someone within the household other than the older adult may bethe owner.Living arrangements. Living arrangements of older Boston residents (where and withwhom one lives) have implications for the types of support one may need, and the levelof interpersonal engagement that is available within the household. Most Boston seniorsappear to have ready access to one or more individuals who may provide support. Thevast majority of Boston seniors live in the community, with only 4% living in nursinghomes; however, nursing home residence is considerably more common amongresidents age 80 and older (12%).12
Among seniors who live in noninstitutional settings—in houses,condos, or apartments throughoutBoston— the majority live with others,including 26% who live with only aspouse and another 36% who live withadult children, grandchildren, otherfamily members, friends, or roommates(along with a spouse in some cases; seeFigure 9). However, more than onethird of seniors live alone, and thelikelihood of living in a one-personhousehold increases with age. Amongadults age 80 and older, about half livealone. Many seniors who live alonereceive support and are socially engagedthrough frequent interactions withfriends, family members, and neighbors.Nevertheless, many seniors who livealone may be at greater risk forexperiencing social isolation andassociated negative health outcomes.6Figure 9: Living arrangements ofBoston residents age 60 36%38%AloneSpouse onlyOthers*26%Source: American Community Survey IPUMS data, 5 yearfile, 2007-2011.*Others may or may not include a spouse. Communitydwelling residents only.Kharicha K, Iliffe S, Harari D, Swift C,Gillmann G, & Stuck AE. 2007. Health riskappraisal in older people: Are older people livingalone an ‘at risk’ group? British Journal ofGeneral Practice 57: 271-6.613
Veteran status among seniors in BostonMany older Boston residents have served in the armed forces during their lifetimes.Thirty percent of men age 60 and older are military veterans, and 13% of all seniors(men and woman) have served in the military (see Figure 10). The proportion of thepopulatio
Jan E. Mutchler, Bernard A. Steinman, Caitlin Coyle, Hayley Gleason, Jiyoung Lyu, and Ceara Somerville. Acknowledgments The authors are grateful to Emily Shea, Commissioner on Affairs of the Elderly, for her l