Transcription
The BostonOpportunityAgendaiFifth Annual Report CardJanuary 2016
A Historic PartnershipConvening Partnersand InvestorsBarr FoundationThe Beal Companies, LLPThe Boston FoundationBoston Public SchoolsCatholic Charities Archdioceseof BostonCity of BostonCombined JewishPhilanthropies of BostonRobert & Myra Kraft FamilyFoundationNellie Mae EducationFoundationNew Profit Inc.United Way of MassachusettsBay and Merrimack ValleyUniversity of MassachusettsBoston
Table of ContentsIntroduction 2A Strong Educational Foundation 4On Track for High School Graduation 8High School Graduation 10Postsecondary Attainment 14Adult Learners 18Thrive in Five 20Summer Learning Project 22High School Redesign 24Boston Opportunity Youth Collaborative 26Success Boston: A College Completion Initiative 28About Us 30Additional Funders 32
IntroductionDear Friends,2We are proud to present the fifth annual Boston Opportunitythis year we have included the number of actual studentsAgenda Report Card. There have been numerous changes inrepresented by the percentages for each measure in eachBoston’s educational landscape over the last two years. Both thechart. We hope this will allow for a deeper and more accurateArchdiocese of Boston and the Boston Public Schools are underunderstanding of the measures, aid in interpreting rapid shiftsthe leadership of new superintendents. The Commonwealthin the percentages, whether positive or negative, and temperof Massachusetts has been piloting new assessments thatcomparisons across systems until we have better methods forbetter align with Common Core education standards—andcomparing measures with significantly different sample sizes.Boston’s Catholic Schools have been implementing a new setThe Archdiocese of Boston uses the Northwest Evaluationof assessments across all grades. These changes are having aAssociation Measures of Academic Progress (NWEA).profound impact on students, teachers, administrators and all ofThis report card also marks the final update on our initial goalsus who track and report on the health of our education pipeline.As a result, this report card reflects a system that is evolving—aseducational institutions at all levels strive to serve their studentsin the best possible way.for the Boston Public Schools in high school completion anddropout reduction. While short of our initial five-year goal of 80%for high school completion, the current 66.7% is higher thanthe national average for urban school systems and representsHere you will find the most up-to-date information available ona jump of five percentage points from the baseline set in 2008.Boston’s education pipeline, from kindergarten through collegeMeanwhile the annual dropout rate narrowly missed the five-yeargraduation, including measures for school readiness, 3rd-gradegoal of less than 3%, coming in at 3.8%. Having started at 7.3%,reading proficiency, 10th-grade academic proficiency, high schoolthis is a tremendous achievement. It reflects the hard work ofcompletion, dropout rates, college enrollment and completionmany partners and it represents a promising start for hundreds ofrates for youth and adults.young people annually.The measures for the public systems—the Boston Public SchoolsOver the coming year, we will be working with representativesand Boston’s Charter public schools—use the state assessments.of the Boston Public Schools, the Archdiocese of Boston andThe data is gathered from the Boston Public Schools, theBoston’s Charter public schools in partnership with the BostonCommonwealth of Massachusetts Department of ElementaryCompact to set new five-year goals for each of the currentlyand Secondary Education and the Archdiocese of Boston. Givenidentified measures and collectively agree on common measuresthe different sizes of the student populations in these systems,of progress. We will also work to identify a common measure
for middle school, a critical time in the life of a young personthat currently has no measure. These changes will enableall stakeholders—students, families, nonprofit partners andeducators at all levels—to have a better understanding of thehealth of Boston’s education pipeline and identify areas where wemust redouble our efforts to ensure excellence in education forall Boston’s students at all levels and in every system dedicatedto serving them.More than 77,000 school-age children live in the City of Boston.The vast majority, 93%, attend a school in the Boston PublicSchools system, a Boston Charter public school, or a BostonCatholic school. Our goal with this report card is to identify pointsat which we are meeting our obligations to the children of our cityand areas in which we are falling short. In this city, where publiceducation was invented, it is imperative that all of our childrencan have access to a world-class education, graduate from highschool college and career-ready and contribute to our highlycompetitive economy and our way of life.Thank you for your partnership in the past and for your commitment to joining us. There is a great deal of work ahead of us aswe strive to meet these goals. Together we can make it happen.Reverend Ray HammondChairKristin McSwainExecutive Director3
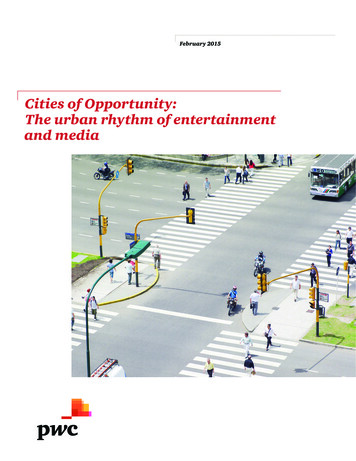
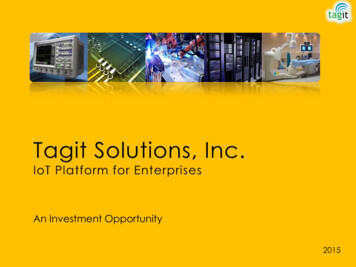
A Strong Educational FoundationEarly Literacy: Percentage of Kindergarteners Achieving the DIBELS* BenchmarkWhat’s Under the Hood: DIBELS NEXT* in KindergartenBoston Public Schools Students OnlyHow is the Boston Public Schools doing?The DIBELS NEXT assessment is given when children enter(% at Benchmark)kindergarten and when they leave. In 2014-2015, 63% of100%incoming kindergarteners were assessed as having the necessaryearly learning skills—an increase of one percentage point from80%the prior year. Kindergarten achievement continues to be strong,60%with 70% of students finishing the year at benchmark. In orderto maximize the time students spend in kindergarten, the Boston40%4Public Schools has continued to refine the K-2 curriculum,which was rolled out across the district over the last several20%0years. The refinements are based on feedback from teacherswho have participated in professional development and sBlack Hispanic HispanicFemales Males FemalesBeginning of Year SY2014-15WhiteMalesWhiteFemalesEnd of Year SY2014-15throughout the implementation.A strong kindergarten experience is helping our youngestlearners prepare for the demands of elementary school, butmore must be done in the birth to age five period in orderto increase school readiness. To start, it is critical to have abetter understanding of the developmental progress of youngchildren during the first five years. Thrive in 5 and the United*The Dynamic Indicators of Basic Early Literacy Skills (DIBELS) are a set ofprocedures and measures for assessing the acquisition of early literacy skillsfrom kindergarten through sixth grade.Way are working with partners across the early education andcare community to build a measurement system that capturesthis information. Using the Ages and Stages Questionnaire“Why does it Matter” source: Strategies for Children, “A Report on the Cost ofUniversal, High Quality Early Education in Massachusetts.”(ASQ) and the Ages and Stages Social Emotional (ASQSE), 20organizational partners have completed almost 3,000 screens.
Percentage of Entering Kindergarteners Achieving the DIBELS* BenchmarkBase2013 / 2014Current2014 / 2015Number of Students62%63%(70% at end of year)2120(2371 end of year)Boston Public SchoolsThe information captured through the screening process willAnnualChangeHow are Boston Charter public schools doing?help providers and parents understand children’s developmentalBoston Charter public schools do not have a uniformprogress—individually and citywide—and create opportunitiesassessment administered across schools. Many schools,for prevention and intervention in the critical “brain-building”but not all, utilize Strategic Evaluation of Progress (STEP) tophase of a child’s life when services are more effective and lessmeasure literacy growth for students. We will be working tocostly. It also adds additional information to our understandingidentify potential common measures moving forward.of our children’s development since DIBELS is focused solelyon basic early literacy. As the Screen to Succeed pilot grows, wehope to add additional measures to this report card to track theprogress children are making as well as the knowledge base weare building in the early childhood arena.How are Boston Catholic schools doing?Why does it matter?A child’s brain develops more during the first five years of lifethan at any other time. Infants and preschoolers experienceenormous social, emotional, physical and cognitive growthduring this period. This is also the time when a child’s ability toself-regulate begins to emerge. A high-quality early educationIndividual Catholic elementary schools in the city of Bostonprogram provides preschoolers with the opportunities theymeasure kindergarten readiness, but no one assessment isneed to grow and thrive, and those who participate in theseused across the Archdiocese of Boston. Instead, schools utilizeprograms are 40% less likely to repeat a grade, 30% more likelya variety of early literacy instruments, including DIBELS NEXTto graduate from high school and all are more than twice as likelyand the Bracken School Readiness Assessment. They areto go to college. They develop better language skills, score higherworking on a multi-year, grant-funded early childhood initiativeon school readiness tests and have fewer behavioral problemsto establish high-quality classrooms and benchmarks for studentonce they enter school. Finally, as adults, they have higherlearning.annual earnings and are more likely to be homeowners.A strongkindergartenexperience ishelping ouryoungest learnersprepare forthe demandsof elementaryschool 5
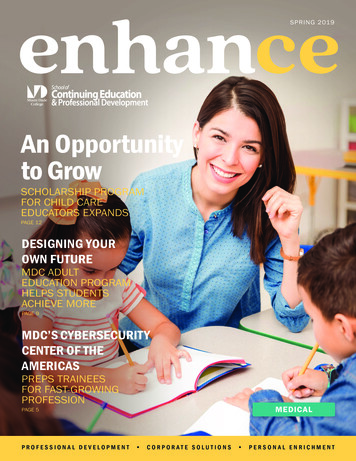
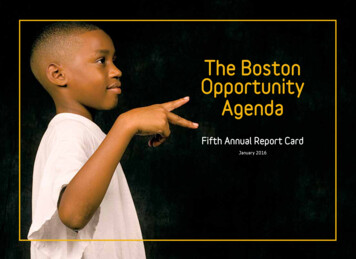
A Strong Educational Foundation3rd-Grade Reading ProficiencyHow is the Boston Public Schools doing?The Boston Public Schools has been strengthening curriculumand instruction over the past several years to align with the newCommon Core standards and updated Massachusetts CurriculumFrameworks. These changes are designed to prepare all studentsfor college and career success in the 21st century economy. As apart of this process, BPS participated in the Commonwealth ofMassachusetts two-year pilot of a new assessment in 2014—thePartnership for Assessment of Readiness for College and Careers(PARCC)—which is aligned to more rigorous curriculum standards.6MCAS and PARCC as well as new items developed for theMassachusetts test. Given this change, the Boston OpportunityAgenda intends to set goals for 3rd-grade reading proficiencyonce the ability to compare results on the assessments or a newbaseline using the revised MCAS is established. In the interim,we will continue to report student progress using the mostcurrently available assessment and its results, including studentgrowth data.How are Boston Catholic schools doing?In lieu of the MCAS and PARCC, Boston Catholic schoolsStatewide, PARCC results showed that in most grades andadminister the NWEA Measures of Academic Progress (MAP)subjects, students who took PARCC were less likely to scoreReading assessment. This nationally normed, adaptivein the “meeting expectations” range than they were to scoreassessment measures student progress and growth for each“proficient or above” in MCAS results. Last year, 36% of Bostonindividual learner. Based on the Fall 2015 MAP administration,students scored “proficient or above” on the English Language75% of 3rd-graders scored in “proficient” and “advanced”Arts (ELA) MCAS. This year, 33% of Boston 3rd-graders scoredcategories. This data represents students’ projected performance“Met or Exceeds Expectations” on the ELA PARCC. Four schoolson the state assessment, the MCAS, and is based on NWEAsaw strong Student Growth Percentiles, which demonstrate gainsalignment and linking studies for Massachusetts.in student knowledge during the school year. They are MildredAvenue K-8 in Mattapan, Rafael Hernandez K-8 in Roxbury,How are Boston Charter public schools doing?Nathan Hale Elementary in Roxbury and the Samuel AdamsMore than 50% of Massachusetts school districts piloted theElementary School in East Boston.PARCC assessment in 2015, and Boston’s Charter publicOn November 17, 2015, the State Board of Elementary andschools were among them. In the aggregate, students inSecondary Education voted to transition to a next-generationCharter public schools performed better than their BPS peersMCAS in 2017. This version of MCAS will combine items fromat 61% “Met or Exceed Epectations,” compared to 61.2% in
Percentage of 3rd-Graders Reading ProficientlyBase 2013/2014Current 2014/2015Number of StudentsAnnualChangeBoston Public Schools (MCAS)36% MCAS33% (PARCC)1243n/aBoston Catholic schools (Stanford 10)52% Stanford 1075% (MAP)n/an/aBoston Charter public schools (MCAS)61.2% MCAS61% (PARCC)285n/a*data from Archdiocese of Boston and DESEWhat’s Under the Hood:the aggregate on last year’s MCAS. Individual charter schoolMeeting Expectations for PARCCscores on PARCC ranged from a high of 88% to a low of 35%.Boston Public Schools Students Only(% at Benchmark)This similarly resembles their MCAS results, which rangedfrom 90% to 37%. The aggregate figure reported here includes80%data from all of Boston’s Charter public schools with grade 3:Boston Renaissance, Bridge Boston, Brooke Charter School East60%Boston, Brooke Charter School Mattapan, Brooke Charter SchoolRoslindale, Conservatory Lab, MATCH Community Day and40%Neighborhood House.20%Why does it matter?0ntstudeAll Slylyicalicalnom ednom gedEco dvanta on-Eco vantagN isadDisaDELLerlyFormELLents iesentsStudisabilit Studthout siDiewbilitwithDisaSY2014-15**data from Massachusetts Department of Elementary and Secondary Education (DESE)In the first three grades, students are learning to read and from4th gra
Bay and Merrimack Valley University of Massachusetts Boston A Historic Partnership. Introduction 2 A Strong Educational Foundation 4 . (ASQ) and the Ages and Stages Social Emotional (ASQSE), 20 organizational partners have completed almost 3,000 screens. 5 Base 2013 / 2014 Current 2014 / 2015 Number of Students Annual Change Boston Public Schools 62% 63% (70% at end of year) 2120