Transcription
Lecture 1: Basic Descriptive Statistics1. Types of Biological Data2. Summary Descriptive Statistics Measures of Central TendencyMeasures of Dispersion3. Assignments
1. Types of Biological DataScales of Measurement: General Comments Any observation or experiment in biology involves thecollection of information (observe plants)Empirical observations become statistical data once theyare cast as some type of measurement (plant height)Measurement is the assignment of numbers to objects orevents according to rules (measure plant 1, plant 2, )Different rules lead to different kinds of scales ofmeasurementA dataset can thus be classified according to the type ofscale by which it is measured –Different scales admit different permissible statistics (see tablesummary)
1. Types of Biological DataScales of Measurement: General CommentsObservationMeasurementRule 1MeasurementRule 2MeasurementRule 3MeasurementRule 4MeasurementScale 1MeasurementScale 2MeasurementScale 3MeasurementScale 4Data Type 1Data Type 2Data Type 3Data Type 4
1. Types of Biological DataScales of Measurement: NOIR Data on a Nominal Scale––– A nominal scale assigns numbers as mere labels or types- words orletters would work just as wellExample: numbers on jerseys that serve to identify athleticparticipantsExample: rocks can be classified as igneous, sedimentary, andmetamorphicData on an Ordinal Scale––An ordinal scale assigns numbers according to some rank orderingExample: order in which participant’s finish a race (1st, 2nd, )
1. Types of Biological DataScales of Measurement: NOIR Data on an Interval Scale–An interval scale assigns numbers according to some rank orderingand assigns the size of intervals in between data (but has no truezero point)Example: The temperature scales of degrees Celsius and degreesFahrenheit are interval scales– The amount of temperature change from 27 C to 32 C is the same as thetemperature change from 104 C to 109 CThe choices for 0 C and 0 F are arbitrary; that is, it makes no sense to say that98 F is twice as hot as 49 FData on a Ratio Scale––A ratio scale is an interval scale with a true zero point.Example: A participant’s finish time for a race –A finish time of 25 seconds is better than 50 seconds (order) and is, indeed,twice as fast (true zero)Example: The Kelvin temperature scale (has an absolute zero)
1. Types of Biological DataDiscrete vs. ContinuousMeasurements may take on discrete or continuous values: A set of values is discrete if it is countable––– Set of possible number of arms on a starfishSet of possible number of leaves on a plantSet of possible number of granules of sand on a beachA set of values is continuous if it is uncountable–––Set of possible weights of starfishSet of possible surface areas for leavesSet of possible amounts of time spent counting sand granules
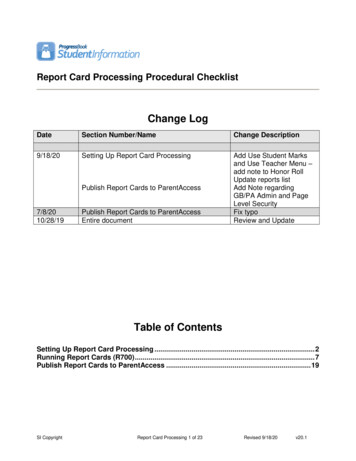
1. Types of Biological DataSummary: Organizational ChartData screteContinuous
2. Summary Descriptive Statistics of DatasetsOverview When a dataset is summarized by its statistical information,there is a loss of information. That is, given the summarystatistics, there is no way to recover the original data. Basic summary statistics may be grouped as:1.2.measures of central tendency (giving in some sense the centralvalue of a data set)measures of dispersion (giving a measure of how spread out thatdata set is)
2. Summary Descriptive Statistics of DatasetsMeasures of Central Tendency Arithmetic MeanDataset: xAverage: Example: 1x , x 2,K , x n 1nn xi x1i 1 2 ,12 , 3 x x2 L xn n2 12 33 17 5 .73This statistic doesn’t make sense for data on nominal orordinal scales: jersey numbers, top ten list
2. Summary Descriptive Statistics of DatasetsMeasures of Central Tendency Median: half the dataset fall below this value; half aboveDataset:Median: 30 , 40 , 50 , 100000040 45, 40 , 45 42 . 52This statistic doesn’t make sense for data on nominalscales:jersey numbers The median is less effected by outliers than the mean; inthis case the mean is approximately 167,000
2. Summary Descriptive Statistics of DatasetsMeasures of Central Tendency Mode: The mode is the most frequently occurring value (orvalues - there may be more than one) in a data setDataset:Mode: 30 , 40 , 50 , 1000000, 40 , 45 40This statistic is meaningful for all scales
2. Summary Descriptive Statistics of DatasetsMeasures of Central Tendency Midrange: The midrange is the value halfway between thelargest and smallest values in the data setDataset:Midrange: x 1 , x 2 , K , x max , K , x min , K xmid xmin xmax2This statistic doesn’t make sense for data on nominal orordinal scales: jersey numbers, top ten list
2. Summary Descriptive Statistics of DatasetsMeasures of Central Tendency Geometric Mean: The geometric mean of a set of n data isthe nth root of the product of the n data values,Dataset: x1, x 2, K , x n Geometric Mean: xgeomn1 n x i i 1 nx1 x1LxnThe geometric mean arises as an appropriate estimate ofgrowth rates of a population when the growth rates varythrough time or spaceIt is always less than or equal to the arithmetic mean
2. Summary Descriptive Statistics of DatasetsMeasures of Dispersion RangeDataset: x 1 , x 2 , K , x max , K , x min , K Range: x xminVariance: the mean sum of the squares of the deviations ofthe data from the arithmetic mean– The “best” estimate of this (take a good statistics class to find outhow “best” is defined) is the sample variance:s max2 Standard Deviation: 1n 1s n x i xi 1var 2
2. Summary Descriptive Statistics of DatasetsTable lIntervalRatioMode Median Addition,Mean,Variance Multiplication,Ratio
3. AssignmentsHomework, MATLAB1.2.Homework: Chapter 1 Exercises 1.2 - 1.5.Download MATLAB as soon as possible. We will beginworking with MATLAB in class next Thursday.
Homework1.1Exercise capacity (in seconds) was determined for each of 11patients who were being treated for chronic heart failure:906, 1320, 711, 1170, 684, 1200, 837, 1056, 897, 882, 1008(a) Determine the mean and the median of the data.Solution:mean 906 1320 L11 1008 970 . 09To find the median, we first order the data:684, 711, 837, 882, 897, 906, 1008, 1056, 1170, 1200, 1320Since there are eleven (an odd number) data points, the medianwill be the 6th data point. That is, the median is 906.
Homework1.2Daily crude oil output (in millions of barrels) is shown below forthe years 1971 to 1990.9.45 9.40 9.25 8.75 8.30 8.10 8.25 8.70 8.55 8.608.55 8.65 8.70 8.70 8.91 8.60 8.20 7.70 7.20 6.75Compute the mean, median, and mode for the data.Solution: Let’s use MATLAB to solve this problem.
Homework1.2
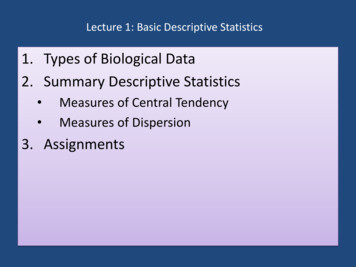
Homework1.4Ten hospital employees on a standard American diet agreed toadopt a vegetarian diet for one month. Below is the changein the serum cholesterol level (before - after).49, 10, 27, 13, 36, 19, 48, 21, 8, 16(a) Compute the median and mean change in cholesterol.(b) Compute the range, variance and standard deviation of thedata. Is the data fairly spread out or close together?Solution: Again we use MATLAB.
Homework1.4
Homework1.4In order to study for the quiz, we now do these by hand. First werewrite the dataset in numerical order:-10, 8, 13, 16, 19, 21, 27, 36, 48, 49Since there are ten (an even number) data points, the medianwill be halfway between 19 and 21. That is, the median is20. Finding the variance is more work:s2 1n 11n x i i 1 10 9 22 . 7 329 . 7889 x22 std110 1 8n x i2i 1 22 . 7 s 22 . 7 2 L329 . 7889 49 22 . 7 18 . 16012
Homework1.5Twelve sheep were fed pingue as a part of an experiment anddied as a result. The time of death in hours after theadministering of pingue for each sheep follows:44 27 24 24 36 36 44 120 29 36 36 36Compute the range, variance and standard deviation of thesample.Answer:range: 96variance: 663.8182std: 25.7647
Types of Biological Data . Summary: Organizational Chart Data Types Non-Metric Nominal Ordinal Metric Interval Ratio Discrete Continuous 1. Types of Biological Data . Overview When a dataset is summarized by its statistical information, there is a loss of information. That is, given the summary