Transcription
waterArticleNitrogen and Phosphorous Retention in Tropical EutrophicReservoirs with Water Level Fluctuations: A Case Study UsingMass Balances on a Long-Term SeriesMariel Barjau-Aguilar 1 , Martín Merino-Ibarra 2, * , Jorge A. Ramírez-Zierold 3 , Sergio F. Castillo-Sandoval 2 ,Gloria Vilaclara-Fatjó 4 , Andrea P. Guzmán-Arias 1 , Miroslav Macek 4 , Rocío J. Alcántara-Hernández 5 ,Salvador Sánchez-Carrillo 6 , Patricia M. Valdespino-Castillo 7 , Arantxa Sacristán-Ramírez 8 ,José G. Quintanilla-Terminel 1 , Emiliano Monroy-Ríos 1 , Julio Díaz-Valenzuela 1 , Julio A. Lestayo-González 1 ,Oscar A. Gerardo-Nieto 2 and Roberto González-De Zayas 91234Citation: Barjau-Aguilar, M.;Merino-Ibarra, M.; Ramírez-Zierold,5J.A.; Castillo-Sandoval, S.F.;Vilaclara-Fatjó, G.; Guzmán-Arias, A.P.;6Macek, M.; Alcántara-Hernández, R.J.;Sánchez-Carrillo, S.;Valdespino-Castillo, P.M.; et al.78Nitrogen and Phosphorous Retentionin Tropical Eutrophic Reservoirs with9Water Level Fluctuations: A CaseStudy Using Mass Balances on a*Posgrado de Ciencias del Mar y Limnología, Universidad Nacional Autónoma de México,Mexico City 04510, Mexico; abmariel322@ciencias.unam.mx (M.B.-A.);andreaguzman07@gmail.com (A.P.G.-A.); josegqt@gmail.com (J.G.Q.-T.);emiliano.monroy.rios@gmail.com (E.M.-R.); jdiazv1@gmail.com (J.D.-V.); jalestayo@gmail.com (J.A.L.-G.)Unidad Académica de Ecología y Biodiversidad Acuática, Instituto de Ciencias del Mar y Limnología,Universidad Nacional Autónoma de México, Mexico City 04510, Mexico; castillo@cmarl.unam.mx (S.F.C.-S.);oagerardon@gmail.com (O.A.G.-N.)Patronato Pro-Valle de Bravo A.C., Mexico City 51200, Mexico; jramirezzierold@yahoo.com.mxFES Iztacala, Universidad Nacional Autónoma de México, Tlalnepantla 54090, Mexico;vilaclara.gloria@iztacala.unam.mx (G.V.-F.); mmacek@live.co.uk (M.M.)Instituto de Geología, Universidad Nacional Autónoma de México, Mexico City 04510, Mexico;ralcantarah@geologia.unam.mxDepartamento de Biogeoquímica y Ecología Microbiana, Museo Nacional de Ciencias Naturales, ConsejoSuperior de Investigaciones Científicas (MNCN-CSIC), 28006 Madrid, Spain; sanchez.carrillo@mncn.csic.esMolecular Biophysics and Integrated Bioimaging Division, Lawrence Berkeley National Laboratory,Berkeley, CA 94720, USA; pmvaldespino@lbl.govDepartment of Oceanography, College of Geosciences, Texas A&M University,College Station, TX 77843, USA; arantxa@tamu.eduDepartamento de Ingeniería Hidráulica, Universidad de Ciego de Ávila, Ciego de Ávila 65100, Cuba;cuba.robe@gmail.comCorrespondence: mmerino@cmarl.unam.mxLong-Term Series. Water 2022, 14,2144. https://doi.org/10.3390/w14142144Academic Editor: Per-Erik MellanderReceived: 13 May 2022Accepted: 1 July 2022Published: 6 July 2022Publisher’s Note: MDPI stays neutralwith regard to jurisdictional claims inpublished maps and institutional affiliations.Copyright: 2022 by the authors.Licensee MDPI, Basel, Switzerland.This article is an open access articledistributed under the terms andAbstract: Nitrogen and phosphorous loading drives eutrophication of aquatic systems. Lakes andreservoirs are often effective N and P sinks, but the variability of their biogeochemical dynamicsis still poorly documented, particularly in tropical systems. To contribute to the extending ofinformation on tropical reservoirs and to increase the insight on the factors affecting N and Pcycling in aquatic ecosystems, we here report on a long-term N and P mass balance (2003–2018) inValle de Bravo, Mexico, which showed that this tropical eutrophic reservoir lake acts as a net sinkof N ( 41.7 g N m 2 y 1 ) and P ( 2.7 g P m 2 y 1 ), mainly occurring through net sedimentation,equivalent to 181% and 68% of their respective loading (23.0 g N m 2 y 1 and 4.2 g P m 2 y 1 ). TheN mass balance also showed that the Valle de Bravo reservoir has a high net N atmospheric influx(31.6 g N m 2 y 1 ), which was 1.3 times the external load and likely dominated by N2 fixation. Pflux was driven mainly by external load, while in the case of N, net fixation also contributed. Duringa period of high water level fluctuations, the net N atmospheric flux decreased by 50% compared tohigh level years. Our results outlining water regulation can be used as a useful management tool ofwater bodies, by decreasing anoxic conditions and net atmospheric fluxes, either through decreasingnitrogen fixation and/or promoting denitrification and other microbial processes that alleviate the Nload. These findings also sustain the usefulness of long-term mass balances to assess biogeochemicaldynamics and its variability.conditions of the Creative CommonsAttribution (CC BY) license er 2022, 14, 2144. com/journal/water
Water 2022, 14, 21442 of 18Keywords: nitrogen sink; sedimentation; nitrogen fixation; denitrification; nitrogen removal;management1. IntroductionIndustrial and agricultural activities have been disturbing the global biogeochemicalcycles of N, P and C, threatening both ecosystems and the present and future safety andfeasibility of humanity [1–3]. The increasing availability of P and biologically reactiveN in aquatic ecosystems has led to their ecological deterioration globally [4,5] and hascompromised their water quality [6,7]. Anoxic conditions are among the most criticaleffects of cultural eutrophication because they can affect the budgets of N, P and C, and inparticular, they can further significantly modify the N transformations and dynamics [8].Nevertheless, lakes and reservoirs also have the potential to act as N, P and C removers [9], by burying nutrients and organic matter into the sediments [5,10] or bypermanently eliminating it through the production of gaseous species such as N2 andN2 O [9,11] via denitrification [12], anammox and denitrifying anaerobic methane oxidation(DAMO) [13,14]. It has been estimated that 19.7 109 kg N y 1 are removed every yearglobally from watersheds by lentic systems [15]; an important fraction of which (33%)is thought to take place in small reservoirs (surface area between 0.001–50 km2 ; [15,16]despite that they represent only 6% of the global lentic surface area [17]. This is attributedto their: (1) long residence times compared to rivers and streams, (2) high ratio of surfacecatchment area lake surface area, (3) high apparent setting velocities for N and (4) elevatedaverage N loads [15,18]. This removal is enhanced in systems with conditions favorable fordenitrification, such as hypoxic or anoxic bottom water and/or sediments, and with a highcontent of organic carbon and nitrate [18,19].The importance of reservoirs in N cycling has been increasing globally over the last60 years [20], not only at the local scale, but also at the regional and global scales [15].Furthermore, reservoirs and lakes exhibit important spatial variations of the N removal potential [19] and the regulation mechanisms need to be further explored in detail. The needto document N removal variations and the mechanisms that affect them is paramount intropical latitudes where aquatic systems are highly pressured by anthropic activities [21–23].Because of the higher loads they receive, understanding the N dynamics of tropical reservoirs has become a priority.Additionally, many reservoirs are also important water sources for densely populatedareas and as a result, important water level fluctuations (WLF) take place in these systems.Water depth has been identified as a key factor that underpins the relative roles and fatesof N and P in lakes [24]. It has also been suggested that WLF might significantly affect theconditions that regulate N cycling and, therefore, also its removal [18,19]. Such is the caseof Valle de Bravo (VB) lake, which supplies Mexico City and other metropolitan areas inthe Mexican highlands. Because of this, the basic limnological aspects of VB are reasonablywell known [25–32], so it is a convenient system for the exploration of N dynamics. In aninitial (2002–2005) time-series mass balance assessment in VB during which high WLF didnot occur, Ramírez-Zierold et al. [29] estimated that N2 fixation exceeded denitrificationand doubled the N loading that the reservoir received from rivers and sewage at the time.Nevertheless, important WLF have occurred since then in VB and their significant effect onvertical mixing has been outlined [33].In the present study we extend and improve the N and P mass balances along a longterm series (16 years) from 2003 to 2018, during which important WLF of up to 12 m tookplace in the VB reservoir. Our goal is to assess N and P retention, N and P net sedimentationand N net atmospheric fluxes at an ecosystem scale and document their variability as afunction of the forcing factors involved, including external N and P loading, limnologicalconditions and water level fluctuations. We expect that our analysis of this long-termmonitoring and mass balances will shed light on the relative relevance of external load
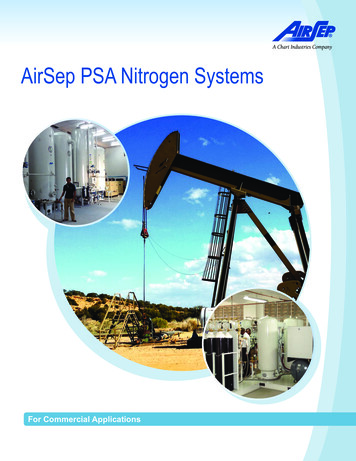
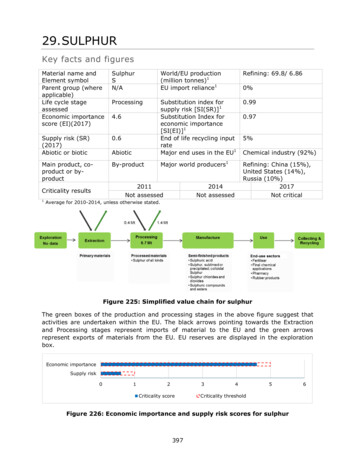
Water 2022, 14, x FOR PEER REVIEWWater 2022, 14, 21443 of 193 of 18monitoring and mass balances will shed light on the relative relevance of external loadvariationsandwaterlevelfluctuationson thesefluxesonmainthe mainN cyclingprovariations andwaterlevelfluctuationson thesefluxesand andon theN formationontropicalreservoirsandtoincreasetheto contribute to extending the information on tropical reservoirs and to increase the quaticecosystems.on the factors affecting N and P cycling in aquatic ecosystems.MaterialsandMethods2. rea:VallededeBravoBravo 210 3000 N, 110 0000 W)VallededeBravo(VB)lake(19(19 21′30′′ValleBravo(VB)lakeN,100100 11′00′′W)isisthethebiggestbiggest reservoirreservoir ofof ocatedinindifferentdifferentbasinsbasins (Figure(Figure 5.5 10 310, a oir has a maximumm33,ma 3meansur2 and a mean depth of 21.1 m. However, when intense levelsurfaceareaofof18.5518.55 face area10610m62manda mean depth of 21.1 m. However, when intense level flucfluctuations(1817.51830.0m a.s.l)place,its surfacecan decreasetuations (1817.5to to1830.0m a.s.l)taketakeplace,its surfacearea areacan decreasedowndownto 13.2to 2. 6When13.2m2 . Whenit is required,be pumpedbackVBthefromthe reservoirs106 m10it is required,waterwatercan becanpumpedback toVB tofromreservoirson theonwesternthe westernpartthe CutzamalaSystem(seefor[29]for details).part oftheofCutzamalaSystem(see [29]details).Figure 1. The Cutzamala System. Outline and distribution of the reservoirs (top). Altitude profileFigure 1. The Cutzamala System. Outline and distribution of the reservoirs (top). Altitude profile(bottom) showing the location of the reservoirs on the Pacific slope, east of the Central Mexican(bottom) showing the location of the reservoirs on the Pacific slope, east of the Central Mexican ValleyValley where Mexico City is located. Modified from Ramírez-Zierold et al. (2010).where Mexico City is located. Modified from Ramírez-Zierold et al. (2010).
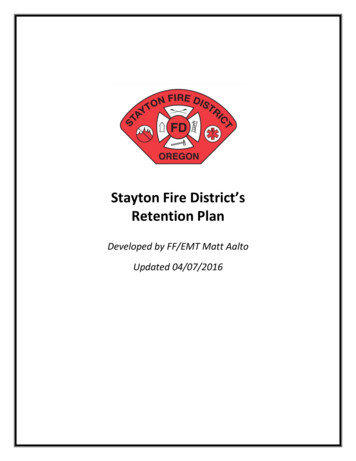
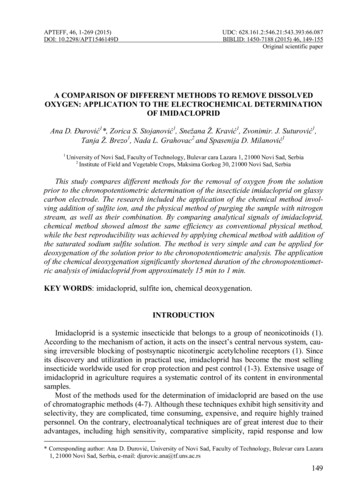
FOR PEER REVIEW4 of 19Water 2022, 14, 21444 of 18Like many other reservoirs in Mexico, Valle de Bravo (VB) shows a detriment in water quality mainly due to its eutrophication since 1992 [35] and health risks due to thepresence of cyanotoxinslikemicrocystinand anatoxin-a[31,36–38].thesereasons,in- in waterLikemanyother reservoirsin Mexico, Vallede BravoFor(VB)showsa detrimentformation on becomeapriorityquality mainly due to its eutrophication since 1992 [35] and health risks due to the presencein recent years. of cyanotoxins like microcystin and anatoxin-a [31,36–38]. For these reasons, information onN andP cycling)in thissystembecome a sewagepriority indisrecent years.Water arrivesnutrientsto VB (particularlythrough gecharges (Figure 2), among which the Amanalco river is the main source [29]. Agriculturedischarges(Figure 2), among which the Amanalco river is the main source [29]. Agriculture in thein the Amanalco watersheddrives increased N and P loads derived from the overuse ofAmanalco watershed drives increased N and P loads derived from the overuse of fertilizers.fertilizers. UpstreamfromtheAmanalco river, 94 trout aquaculture facilities operate andUpstream from the Amanalco river, 94 trout aquaculture facilities operate and only 30%only 30% of themofdisposeof theirwastewaterunderMexican[39].AllAllofofthem disposeof theirwastewaterunderMexicanlegislationlegislation [39].thetheabove haveabove have been identifiedas causesof theeutrophicationbeen identifiedas causesof theeutrophicationofof VBVB [26,29].[26,29].Figure 2. Bathymetric map of Valle de Bravo (VB) reservoir showing the main water inputs (riversFigure 2. Bathymetric map of Valle de Bravo (VB) reservoir showing the main water inputs (riversand sewages) and the water withdrawal through pump-out at the dam. Circles indicate all the evenand sewages) and the water withdrawal through pump-out at the dam. Circles indicate all thetually sampled sites and the black diamond indicates the central station sampled throughout theeventually sampled sites and the black diamond indicates the central station sampled throughout thelong-term period here reported. Depth contours are reported in meters below the maximum levellong-term period here reported. Depth contours are reported in meters below the maximum level ofof the lake. The arrows indicate the diurnal wind pathways along both arms of the lake. Modeledthe lake. The arrows indicate the diurnal wind pathways along both arms of the lake. Modeled afterafter Merino-Ibarra et al. (2021).Merino-Ibarra et al. (2021).VB is a warm monomythicwaterbody withstrongto watermanagementVB is a warmmonomythicwaterbodyWLFwithlinkedstrong WLFlinkedto water managementfor supplypurposes[33]. VBin a mountainousregion wherediurnal windfor supply purposes[33]. VBis locatedin isa locatedmountainousregion windflowsimpactdiverselimnologicalandwind flows [26]. Both WLF and strong wind flows impact diverse limnological and eco-ecologicalaspects such as stability of stratification, nutrient exchange between the epilimnion andlogical aspects suchas stability of stratification, nutrient exchange between the epilimnionthe hypolimnion [33], composition of the phytoplankton and zooplankton community andand the hypolimnion[33], composition of the phytoplankton and zooplankton commuecosystem metabolism [31,32,40].nity and ecosystem metabolism[31,32,40]. mass balance assessment for the 2002–2005 period,In their preliminaryIn their preliminarymass �rez-Zieroldet al. [29]found thatforN2 thefixationexceededdenitrificationof VB and thaterold et al. [29] foundthat N2 fixationexceededdenitrificationVB andfromthatthetheriversreserthe reservoir’snet N2 fixationdoubledthe N loading ofit receivedand sewagetogether.However,in thefollowingyears, importantWLFoccurredVB. Fortunately,thevoir’s net N2 fixationdoubledthe Nloadingit receivedfrom theriversand insewagetogether. However, in the following years, important WLF occurred in VB. Fortunately, thecontinuous monitoring of the reservoir maintained since then makes possible the
Water 2022, 14, 21445 of 18continuous monitoring of the reservoir maintained since then makes possible the assessment of the effects of WLF on N and P fluxes, as was previously done for vertical waterfluxes [33].2.2. Samples and DataThe database was comprised of monthly samplings from January 2003 to December2018, during which the VB reservoir, five rivers (Amanalco, Molino, González, Carrizal andSanta Monica) and three sewage discharges (Tizates, embarcadero I and embarcadero II)were monitored every 30 1 days (N 200). Flow was measured at rivers and dischargesusing a drifting buoy and cross-section determinations (cf. [29] for details). For the reservoir,a single central station was monitored after 2006, as [31,32,41] found it to be representativeof the reservoir because of its horizontal homogeneity.Water samples were collected with a 1.5 L Uwitec sampling bottle at all rivers andsewage discharges as well as at the central station of VB at depths of 0, 1, 2, 4, 8, 12, 16,20, 24 m and the bottom. Samples for total nitrogen (TN) and total phosphorous (TP)determinations were collected in duplicate in 30 mL polypropylene bottles. Using GF/FWhatman filters, 60 mL of water were filtered and the filters were stored for particulateorganic nitrogen (PON) and particulate organic phosphorous (POP) determinations. Allsamples were maintained at 4 C in the dark until the analysis. Additionally, at the centralstation, vertical profiles of temperature and dissolved oxygen (DO) were done using aHydrolab DS4/SVR4 field probe from 2003 to 2009 and a multiparametric sonde YSI 6600from 2009 to 2018.2.3. Nutrient AnalysisWater samples for the determination of TN and TP, as well as filters for PON andPOP, were subjected to high temperature persulfate oxidation to oxidize all the P and Nspecies to nitrate and soluble reactive phosphorous (SRP), following [42]. Nutrient (SRP,ammonia, nitrite and nitrate) concentrations were determined using a Skalar San-Plussegmented-flow analyzer [43,44]. Dissolved inorganic nitrogen (DIN) was calculated asammonia nitrite nitrate.2.4. Mass Balance ApproachThe water mass balance (Equation (1)) considered the reservoir as a single box andassumed that groundwater seepage was negligible [31]. V/ t ΣRi Pi W Σ( E P) A(1)where V/ t is the volume change of the reservoir, Ri is the sum of all the river and sewageinflow rates, Pi is the pump-back inflow, W is the water withdrawal rate, E is evaporation,P is precipitation (m3 d 1 in all cases) and A is the lake surface area (m2 ).While the volume change of the reservoir was available on a daily basis (provided byCONAGUA, National Water Commission), the rivers and sewage inflows could only bemeasured once a month since no government monitoring of the rivers was done at thistime. Therefore, to improve the representativeness of our river discharge assessment, wecalculated the water residuals (Wres, Equation (2)), found using our monthly measurementsand assuming a closed water mass balance (with no other significant inputs or outputs).These residuals were then used to correct the inflows Ri by iteration (3), redistributingthe Wres water flow among the rivers according to each river’s contribution fraction (xi ,ranging between 0 and 1) to the total river input, which were assessed using the river saverage contribution fraction during the years for which the minimal deviations (Wres)were observed for the annual mass balances.Wres V / t (ΣRi Pi W Σ( E P) A)(2)Ri Ri xi (Wres)(3) V/ t ΣRi Pi W Σ( E P) A(4)
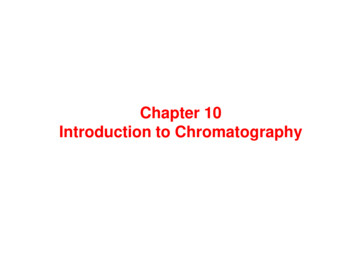
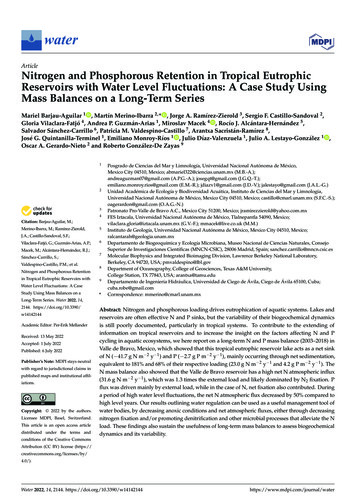
Water 2022, 14, 21446 of 182.5. Estimation of N and P Net Internal FluxesThe phosphorous and nitrogen mass balances were represented by Equation (5), asproposed by Ramírez-Zierold et al. [29]: M( P,N ) / t ΣI( P,N ) O( P,N ) N IP( P,N )(5)where M( P,N ) / t is the mass change of N or P in the reservoir between consecutivesampling surveys. P and N inputs (I( P,N ) ) were calculated using the mean concentrationsof TP and TN determined on each source during both samplings multiplied by the correctedinflow Ri . Output (O( P,N ) ), was calculated using the TP and TN mean concentration nearthe bottom of the reservoir lake (from where the water is withdrawn, [29]) multiplied bythe water withdrawal rate.N IP( P,N ) represents the net element flux due to all the biogeochemical processes thattake place internally within the reservoir. Because there are no processes that drive anexchange with the atmosphere, in the case of P, N IP( P) is the net exchange between thewater column and the sediments. For N, nevertheless, N IP( N ) includes the net N exchangewith the sediments and also the exchange between the water column and the atmosphere(Equation (6)) due to the input of N2 fixation and the N emissions resulting from multipleprocesses such as denitrification, anammox and DAMO. To estimate the N net flux between the water column and the sediments N IP( N )Sed ,we used the P net sedimentation (N IP( P) ) and multiplied it by the particle N:P ratio(PON:POP) found in the hypolimnion of VB, as this is the lake’s layer from which both sed imentation and exchange directly take place. This meant a refinement of the N IP( N )Sedestimation, as compared to that of [29], where the full water column N:P ratio was used.The net N flux between the atmosphere and the water column was the assessed fromthe N IP( N ) after subtracting N IP( N )Sed from it in Equation (6):N IP( N ) N IP( N ) Atm N IP( N )Sed(6)2.6. Data Statistical Analysis and Data VisualizationPearson’s correlations were used to find significant relationships between net N fluxesand water level, environmental parameters and vertical fluxes of DIN [33]. Data rearrangement and their subsequent analyses were done using Microsoft Excel (King County,WA, USA), Ggplot2 [45] and Tidyverse [46] packages for R software [47]. To visualize andassess interannual and long-term variations, the data were integrated on a yearly basis.To help visualize the seasonal variations, the N IP( N ) Atm data series was smoothed with athree-phase moving average until a clear seasonal pattern variation was revealed. Then,the data were averaged on a monthly scale to obtain a mean annual cycle of N IP( N ) Atm onwhich the relative importance of the different N processes could be assessed.3. Results3.1. Water BudgetThroughout the whole 2003–2018 period, the main water inflow to VB came from therivers, mainly Amanalco and Molino, and the outflow was due to withdrawal (Figure 3).During the dry seasons (from November to May), the rivers decreased their inflows whilewithdrawal increased to provide water to Mexico and other cities. During the rainy season,the rivers’ input increased, and the water withdrawal decreased. This caused a discreteseasonal oscillation of the reservoir’s water level, in the range of 4–6 m. However, asdiscussed by [35], during some years, the water imbalance was higher, causing higher WLFof up to 12 m below the reservoir’s capacity.Two statistically different (t(9) 4.75, p 0.001) water level patterns were identifiedfor 2003–2018: (1) low water level fluctuation (L-WLF) periods when water level remainedwithin 4 to 6 m of the capacity level (1830.0 m a.s.l), which occurred from 2003 to 2005(L-WLF-1) and from 2014 to 2018 (L-WLF-2) (M 1827.4, SD 0.81) and (2) a high waterlevel fluctuation (H-WLF) period that occurred from 2006 to 2013 when the reservoir lake’s
Water 2022, 14, 21447 of 18water level decreased farther below the historic mean (M 1824.0, SD 1.88). Water budgetmeans for each of the periods can be found in Table S1 (Supplementary Material). Duringthe H-WLF period, the input of rivers and sewages decreased 16% overall compared toinWater 2022, 14, x FOR PEER REVIEW the L-WLF periods and the water level reached extraordinary minima ( 1820 m a.s.l)7 of 192006, 2009 and 2013 (Figure 3). Water management during this period implied a decrease(by 21%) of withdrawal and an increase in pump-back from other reservoirs (from 4%to 10% of the inputs) in order to recover the water level. As a result, a recovery of thediscussed by [35], during some years, the water imbalance was higher, causing higherreservoir water level to its average level was achieved in 5 months, particularly betweenWLF of up to 12 m below the reservoir s capacity.2009 and 2013.3 3 2 d 1 ofFigurede Bravoand itsandwaterlevel variationsfrom 2003– Valle1 ) of m(mmm 2) dde Bravoits waterlevel variationsfrom2018. Purple shading outlines the higher water level fluctuation (H-WLF) period.2003–2018. Purple shading outlines the higher water level fluctuation (H-WLF) period.Twodifferent (t(9) 4.75, p 0.001) water level patterns were identified3.2. NandstatisticallyP Mass Budgetsfor 2003–2018:(1)lowwaterbylevelfluctuation (L-WLF)periodswhenwaterremainedAs previously foundRamírez-Zieroldet al. [29],boththe NandlevelP budgetsandwithin4 to 6 mNIPsof thecapacitylevel (1830.0m monthlya.s.l), whichoccurredfromto2003to 2005the resultingvariedsignificantlyat thescale.Therefore,smoothout (LtheWLF-1)andvariabilityfrom 2014 to2018(L-WLF-2) 1827.4, SDof 0.81)and (2) a highwaterlevelshort-termandto facilitatethe(Mvisualizationthe long-termtrendsas to2013whenthereservoirlake’swathe net differences among years and among different WLF periods (Table 1), we M 5).1824.0,SD 1.88).WaterbudgetthelevelN andP budgetson thebelowannual(Figures4 andThe H-WLFperiodis 1(SupplementaryMaterial).Duringpurple (as in Table 1 and Table S1, Supplementary Material) to aid in the identification oftheperiod, the input of rivers and sewages decreased 16% overall compared totheH-WLFhigh WLF.3 kg 1the L-WLFperiodsand4)thewaterlevelminima( 1820a.s.l)P budget(FigureshowsthatVB reachedreceived extraordinaryan average P loadof 68.6 10mP yin2006,2009and 2013Most(Figure3). PWaterthis perioda decreaseduring2003–2018.of theinputmanagementto VB (73% ofduringthe overallmean) impliedarrived throughthe(by21%)withdrawalandan increasein pump-backfromotherreservoirs(from 4% toriversbutoftheinput fromsewagesand pump-backfromotherreservoirsof theCutzamala 10%of thein order to Therecoverthe wateroflevel.Asfroma result,a recoveryremovedof the resSystemwasinputs)also significant.withdrawalwaterthe reservoiran3 1ervoirwaterlevelto itslevel wasachievedin 5months,betweenaverageof 19.6 10kgaverageP y duringthe sameperiod,onlyabout particularlyone third (29%of theoverall2009andmean)2013. of the P arriving to VB, so the rest of the P load (68% of the overall mean),would have been incorporated into the sediments as a result of the net P sedimentation3.2.BudgetsfluxNNandIP( PP) Mass(Figure4), which averaged 46.9 103 kg P y 1 for the whole sampling period.As previously found by Ramírez-Zierold et al. [29], both the N and P budgets and theresulting NIPs varied significantly at the monthly scale. Therefore, to smooth out theshort-term variability and to facilitate the visualization of the long-term trends as well asthe net differences among years and among different WLF periods (Table 1), we integrated the N and P budgets on the annual scale (Figures 4 and 5). The H-WLF period isshaded in purple (as in Tables 1 and S1, Supplementary Material) to aid in the identification of the high WLF.P budget (Figure 4) shows that VB received an average P load of 68.6 103 kg P y 1during 2003–2018. Most of the P input to VB (73% of the overall mean) arrived through
Water 2022, 14, 21448 of 18Table 1. Phosphorous and nitrogen budgets for Valle de Bravo during 2003–2018. Mean annualphosphorous (TP) and nitrogen (TN) budget components of Valle de Bravo are shown for: the lowwater level fluctuation-1 (L-WLF-1) period (2003–2005), the high water level fluctuation (H-WLF)period (2006–2013) (shaded in purple for better visualization), the water level fluctuation-2 (L-WLF-2)period (2014–2018), the overall means for the full study period (2003–2018) as well as the percentageof each flux relative to the total input. The net internal fluxes of P and N are shaded in orange, the netsedimentation fluxes are shaded in yellow, and the atmosphere water fluxes of N are shaded in blue.TPMean mass reservoir (103 kg P) mass (103 kg P y 1 )Fluxes (103 kg P y 1 )RiversSewagePump-backTotal inputOutputInput OutputNet internal fluxNet sedimentationTNMean mass reservoir (103 kg N) mass (103 kg N y 1 )Fluxes (103 kg N y 1 )RiversSewagePump-backTotal inputOutputInput OutputNet internal fluxNOP: POPhipoNet sedimentationAtmosphere water 2018)28.62.160.723.21.185.0 21.064.0 62.7 62.756.415.94.777.1 20.556.6 53.9 53.934.07.53.745.2 17.427.8 26.1 26.150.214.73.768.6 19.649.0 46.9 46.9382.665.1289.0 22.7288.6 0.3306.40.8354.651.78.0414.3 286.4127.9 62.836 1049.9987.2293.358.527.7379.5 194.0185.4 208.226 662.4454.2281.046.026.0353.0 194.7158.3 158.533 497.4338.8300.953.323.5377.7 211.6166.2 165.429.9 683.5518.1% Input73%21%5%100% 29%71% 68% 68%% Input80%14%6%100% 56%44% 44%8% 181%137%Overall, P inputs to VB decreased throughout 2003–2018 at an average rate of 3.4 103 kg P y 1 . As a result, and because the amount removed from the lake bywater withdrawal remained nearly constant, the amount of P removed into the sedimentsalso decreased throughout the period at a mean rate of 2.8 103 kg P y 1 . The yearlyvariations observed in the inputs were reflected in the net P sedimentation, with 2010having the maximum P input and sedimentation annual rates and 2018 having the lowestrates, when the P budget even yielded a net P efflux of P from the sediments to the watercolumn on an annual basis. The H-WLF period did not show a pronounced differencewhen compared to the L-WLF periods and the mean annual fluxes were within 10% of themean values for the previous L-WLF-1 (Table 1). Nevertheless, after the H-WLF period,the P net sedimentation flux was on average 26.1 103 kg P y 1 , less than half of thoseoccurring during the two previous periods, either under low WLF (62.7 103
To contribute to the extending of information on tropical reservoirs and to increase the insight on the factors affecting N and P cycling in aquatic ecosystems, we here report on a long-term N and P mass balance (2003 2018) in Valle de Bravo, Mexico, which showed that this tropical eutrophic reservoir lake acts as a net sink of N (-41.7 g N m-2 .