Transcription
DOE/SC-ARM-TR-196Aerosol Chemical Speciation Monitor (ACSM)Instrument HandbookTB WatsonAugust 2017
DISCLAIMERThis report was prepared as an account of work sponsored by the U.S.Government. Neither the United States nor any agency thereof, nor any oftheir employees, makes any warranty, express or implied, or assumes anylegal liability or responsibility for the accuracy, completeness, orusefulness of any information, apparatus, product, or process disclosed, orrepresents that its use would not infringe privately owned rights. Referenceherein to any specific commercial product, process, or service by tradename, trademark, manufacturer, or otherwise, does not necessarilyconstitute or imply its endorsement, recommendation, or favoring by theU.S. Government or any agency thereof. The views and opinions ofauthors expressed herein do not necessarily state or reflect those of theU.S. Government or any agency thereof.
DOE/SC-ARM-TR-196Aerosol Chemical Speciation Monitor(ACSM) Instrument HandbookTB Watson, Brookhaven National LaboratoryAugust 2017Work supported by the U.S. Department of Energy,Office of Science, Office of Biological and Environmental Research
TB Watson, August 2017, DOE/SC-ARM-TR-196Acronyms and AbbreviationsASCIIAmerican Standard Code for Information InterchangeACSMAerosol Chemical Speciation MonitorAOSAerosol Observing SystemARMAtmospheric Radiation MeasurementCCelsiuscccubic centimeterscmcentimetersDAQdata acquisition controlDMAdifferential mobility analyzerENAEastern North AtlanticggramsHR-ToF-AMSHigh-Resolution Time-of-Flight Aerosol Mass liters per minuteMAOSMobile Aerosol Observing SystemminminutesnmnanometerODoutside diameterOPCOpenness, Productivity, CollaborationPILSparticle-into-liquid samplerPMFpositive matrix factorizationRFresponse factorRGAresidual gas analyzerRIErelative ionization efficiencysecsecondsSEMsecondary electron multiplierSGPSouthern Great PlainsSMPSscanning mobility particle sizerSPASulfate Particulate AnalyzerVACvolts of alternating currentWwattsiii
TB Watson, August 2017, DOE/SC-ARM-TR-196ContentsAcronyms and Abbreviations . iii1.0 General Overview . 12.0 Mentor Contact Information . 13.0 Vendor/Developer Contact Information . 14.0 Measurements Taken . 25.0 Definitions and Relevant Information . 25.1 Data Object Description . 25.2 Data Ordering . 36.0 Technical Specification . 36.1 Units . 36.2 Range. 36.3 Accuracy . 36.4 Precision . 46.5 Sensitivity . 67.0 Instrument System Functional Diagram . 68.0 Instrument/Measurement Theory. 69.0 Operation . 710.0 Calibration . 710.1 Sample Flow Rate Calibration . 710.2 NO3 Response Factor (RF) Calibration and NH4 and SO4 Relative IonizationEfficiencies (RIE) . 810.3 Calibration Frequency . 911.0 Inlet System . 912.0 Software . 1112.1 ACSM Data Acquisition Software (DAQ) . 1113.0 Maintenance. 1213.1 Critical Orifice Replacement . 1213.2 Turbo Pump Failure . 1313.3 Switch Ionizer Element . 1313.4 Prisma Computer Lockup. 1314.0 Safety . 1415.0 Shipping . 1416.0 Citable References . 14iv
TB Watson, August 2017, DOE/SC-ARM-TR-196Figures1The bench top configuration of the ACSM. . 12Plot of error in concentration for synthetic data ranging from 0.1 to 100 µgm-3. 53ACSM schematic. . 64Results of calibration using NH4NO3 and (NH4)2SO4. . 85Schematic of inlet system. . 106Aerosol Observing System (AOS) instrument enclosure with 10 m sampling stack. . 117“Vaporizer and Ionizer Control” panel. The “Filament 1” and “Filament 2” selection buttons areindicated. . 13Tables1ASCII file structure. . 22Slope and correlation coefficient for plots of ACSM data versus data from HR-ToF-AMS duringQueens College Air Quality Study. . 43Slope and correlation coefficient for plots of ACSM data versus sulfate data from PILS and SPAduring the Queens College Air Quality Study. . 4v
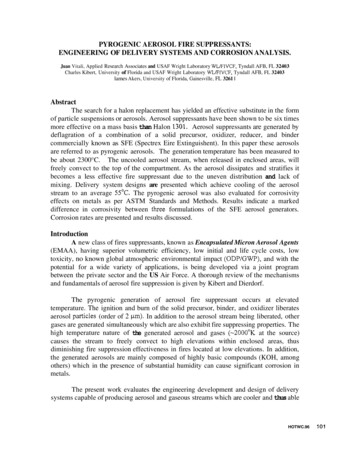
TB Watson, August 2017, DOE/SC-ARM-TR-1961.0General OverviewThe Aerodyne Aerosol Chemical Speciation Monitor (ACSM) measures particle mass loading andchemical composition in real time for non-refractory sub-micron aerosol particles. The ACSM is designedfor long-term unattended deployment and routine monitoring applications.Figure 1.2.0The bench top configuration of the ACSM.Mentor Contact InformationThomas B. WatsonBrookhaven National LaboratoryEnvironmental and Climate Sciences DepartmentBldg. 815EUpton, NY 11973voice: (631) 344-4517fax: (631) 344-2887twatson@bnl.gov3.0Vendor/Developer Contact InformationAerodyne Research45 Manning RoadBillerica, MA 01821-3976(978) 663-9500www.aerodyne.com1
TB Watson, August 2017, DOE/SC-ARM-TR-1964.0Measurements TakenThe Aerosol Chemical Speciation Monitor (ACSM) routinely characterizes and monitors the mass andchemical composition of non-refractory submicron particulate matter in real time. Under ambientconditions, mass concentrations of particulate organics, sulfate, nitrate, ammonium, and chloride areobtained with a detection limit 0.2 µg/m3 for 30 min of signal averaging. The ACSM is capable ofroutine stable unattended operation for months with minimal maintenance or calibration.5.0Definitions and Relevant InformationNon-refractory, in the context of the ACSM, is any particulate material that cannot be vaporized at 600oC.5.1 Data Object DescriptionThe ACSM generates two types of raw data files. These are designated a1 in the Atmospheric RadiationMeasurement (ARM) Climate Research Facility Data Archive. They both contain data in differentformats.The first format is specific to Igor. They are known as Igor text files and are named with the formyyyymmdd hh mm ss.itx. For example: 20140916 00 24 07.itx. These are generated after completionof the number of scans in each averaging period and are the average over these scans. This is usually 30minutes, which results from 28 scans of aerosol sample and 28 scans of filtered background. These filesare used with the Igor-based data analysis software supplied by Aerodyne to reprocess the data.The second format is ASCII. These files are named with the conventionXXXacsmC1.a0 bnl.yyyymmdd.hhmmss.asc. For example: sgpacsmC1.a0 bnl.20140916.121150.asc.These files contain the following columns:Table 1.ASCII file structure.OrgNH4SO4NO3Chlacsm local timeacsm utc timeVaporizer T CEmission Current mAnominally 1mAFlow Rate ccstotal organicammoniumsulfatenitratechlorideSeconds since January 1, 1904Seconds since January 1, 1904nominally 600 oCnominally 1.4 cc sec-1 (calculated fromcalibration and inlet pressure)nominally 0.03 torrnominally 1.3 torrInlet P Closed TorrInlet P Open Torr2
TB Watson, August 2017, DOE/SC-ARM-TR-1965.2 Data Orderinghttp://www.arm.gov/xdc6.0Technical SpecificationData Rate:30 minutes averagingSample Flow:85 cc min-1 (volumetric flow)Operating Pressure:AmbientData Acquisition (DAQ) Control:Ethernet basedSize/Weight:Bench top, 21” x 19.5” x 34”, 140 lbs[53.34 cm x 49.53 cm x 86.36 cm , 64 kg]Electric Power:300 W; 85-264 VAC, 47-63 HzSoftware:Custom acquisition and analysis routines.Specialized routines for positive matrix factorization (PMF) analysis of the organic fraction.6.1 Unitsμg m-36.2 RangeAerosol Size range:40 nm to 1 μm (vacuum aerodynamic diameter)Mass range (m/z):10 to 200 amu6.3 AccuracyAccuracy of the ACSM has been determined from intercomparison with other instruments measuringsimilar parameters such as the High-Resolution Time-of-Flight Aerosol Mass Spectrometer (HR-ToFAMS), the Particle-into-Liquid Sampler (PILS), and the Sulfate Particulate Analyzer (SPA). Correlationplots of ACSM results versus HR-ToF-AMS for all measured species and for Sulfate versus the PILS andSPA from data taken during the Queens College Air Quality Study are given in Tables 2 and 3 (Ng, et al.2011). Data from this and other studies place the accuracy of the ACSM measurements at 30%.3
TB Watson, August 2017, DOE/SC-ARM-TR-196Table 2.Slope and correlation coefficient for plots of ACSM data versus data from HR-ToF-AMSduring Queens College Air Quality Study.SpeciesOrganicSulfateNitrateNH4ChlorideTable lope and correlation coefficient for plots of ACSM data versus sulfate data from PILS andSPA during the Queens College Air Quality Study.InstrumentPILSslope0.69r20.77SPA0.690.856.4 PrecisionError in the mass spectra is a function of averaging time and is related to the number of counts recorded ateach mass value.𝑒𝑒𝑐𝑐 𝑎𝑎 𝑆𝑆where:𝑒𝑒𝑐𝑐 the error in the mass signal in counts𝑎𝑎 is a constant determined empirically, 1.2 in this case𝑆𝑆 the number of counts at a particular m/zSince the ACSM data are the result of the subtraction of the background signal from the sample signal,the error is given by the sum in quadrature of the two errors:𝑒𝑒𝑑𝑑 (𝑒𝑒𝑜𝑜 )2 (𝑒𝑒𝑐𝑐 )2where:𝑒𝑒𝑑𝑑 the error in the difference of the open and closed signals𝑒𝑒𝑜𝑜 the error in the open signal𝑒𝑒𝑐𝑐 the error in the closed signalor22𝑒𝑒𝑑𝑑 𝑎𝑎 𝑆𝑆𝑜𝑜 𝑎𝑎 𝑆𝑆𝑐𝑐 where:𝑆𝑆𝑜𝑜 is the number or counts when the sample is collected𝑆𝑆𝑐𝑐 is the number or counts when the background is measured4
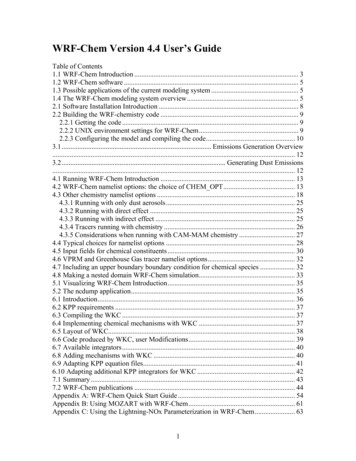
TB Watson, August 2017, DOE/SC-ARM-TR-196However, The ACSM signal is a measurement of current at the secondary electron multiplier (SEM), notion counts. Application of the ion counting statistics requires that the signal in amperes be converted tocounts. This is accomplished by estimating the number of electrons measured at each m/z scanned by thequadrupole and assuming that the number of ions at each m/z is equal to the number of electronsmeasured at that mass value.𝐴𝐴 𝐷𝐷𝑆𝑆 𝜀𝜀 𝐺𝐺Where:𝐴𝐴 the signal in amperes (Coulombs per second)𝜀𝜀 the charge of the electron in Coulombs 1.60 x 10 19 C𝐷𝐷 the dwell time on each m/z value used to determine the signal𝐺𝐺 the SEM gain, nominally 20,000The dwell time is the time over which data is averaged to calculate the mass spectrum and is the productof the size of the integration window at each m/z, the scan rate of the quadrapole, and the number ofpoints collected per amu.The error in amperes can be expressed as:𝐺𝐺𝐴𝐴𝑜𝑜 𝐴𝐴𝑐𝑐 𝛿𝛿𝐴𝐴 𝑎𝑎 186.24 𝑥𝑥 10𝐷𝐷And this can be converted to µgm-3 using the measured NO3 calibration. This value is typically 1-10 x 1011(amps/ µgm-3).A plot of synthetic data for signals of 0.1 to 100 µgm-3 is given in Error! Reference source not found.Figure 2.Plot of error in concentration for synthetic data ranging from 0.1 to 100 µgm-3.5
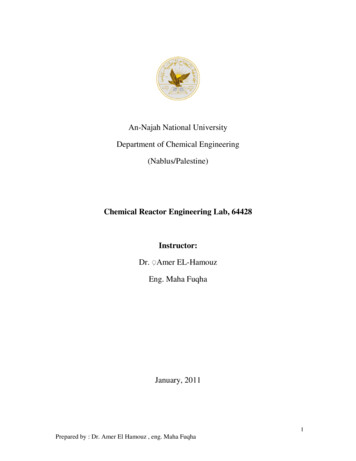
TB Watson, August 2017, DOE/SC-ARM-TR-1966.5 Sensitivity(μg m-3, 30 minute, 3σ ):Organic: 0.3Sulfate: 0.4Nitrate: 0.2NH4: 0.5Chloride: 0.27.0Instrument System Functional DiagramFigure 3.8.0ACSM schematic.Instrument/Measurement TheoryA schematic of the ACSM is shown in Error! Reference source not found. The vacuum chambercouples the particle aerodynamic lens with the thermal particle vaporization source and the massspectrometer. The aerodynamic lens creates a beam, approximately 1 mm in diameter, of particles that isdirected at the resistively heated particle vaporization source typically operated at 600 C. The vaporizeris mounted inside the electron impact ionization source, which ionizes any vaporized particulate material.The ions formed are then analyzed, with the quadrupole mass spectrometer providing compositioninformation. Three turbo molecular pumps provide differential pumping to efficiently separate the gasfrom the particle beam. A small oil-free diaphragm pump is used to back the turbo pumps. An aerosolinlet system couples the particle lens flow to a larger sample flow. The flow into the ACSM through theparticle lens is 0.1 LPM fixed by a 100 um-diameter critical aperture. This rather small flow is sub6
TB Watson, August 2017, DOE/SC-ARM-TR-196sampled from the main aerosol inlet system flow that is designed to be 3 LPM for near isokineticsampling conditions. Since the ion source operates continuously, there is always a background massspectra (present in the absence of any particles) which must be measured and subtract from the particlemass spectra. This is done routinely during data acquisition by drawing the sample thru an aerosol inletsystem that combines a 3-way valve and a particle filter. The position of the 3-way valve is alternatelyswitched between filter position and sample position at the completion of each full mass scan.This results in a “particle” mass spectrum and a “particle-free” mass spectrum. The difference betweenthese two spectra contains the particle composition information. The frequent zero measurement adds tothe long-term stability on the ACSM data sets. The ACSM also incorporates a small effusive source ofnaphthalene that is mounted in the detection region. This source provides a reference for calibrations suchas mass-to-charge for the amu scale, instrument stability and ion transmission through the quadrupolemass filter.The ACSM is designed around the Pfeiffer Vacuum Prisma Residual Gas Analyzer (RGA), whichoperates with the Prisma Plus electronics. The RGA is a 6-mm-diameter quadrupole rod system with athermal particle vaporization and electron impact ionization source that allows universal ionization ofnon-refractory aerosol components. The mass analyzer covers a scan range of 0-200 amu. The Prismaelectronics supports Ethernet connectivity with an OPC interface. OPC is a standard software interfacethat enables data communication between applications of different manufacturers. OPC stands forOpenness, Productivity, Collaboration (formerly Windows OLE for Process Control). The Prisma Pluscontains an embedded computer with a Windows CE Operating system that runs a Pfeiffer applicationcalled QMStart.exe, which executes at power on. The Pfeiffer electronics and QMStart applicationsupports digital and analog input/output (I/O) which is used to control various aspects of the ACSM. Allof the features and operation of the Prisma RGA are controlled via OPC commands.9.0OperationThere are currently three ACSM systems operating in ARM installations. One is located at the SouthernGreat Plains (SGP) ARM site in Oklahoma, one in the Mobile Aerosol Observing System (MAOS), andthe third in the mobile facility currently located at the Eastern North Atlantic (ENA) site, Graciosa Island,Azores, Portugal.10.0 Calibration10.1 Sample Flow Rate CalibrationThe sample flow rate calibration is used to determine the sample flow rate into the instrument based onthe pressure at the inlet. The Igor data processing software uses the pressure measurement to calculate thesample flow rate based on this calibration and to calculate the mass concentrations. This calibration isperformed by measuring the sample flow rate versus inlet pressure for a range of flow rates using aGilibrator, or other flow measurement device, and the inlet pressure measured by the instrument. Theslope and intercept of a linear fit to the data are entered in the software and the program uses themeasured pressure to determine the sample flow rate. The sample flow rate is used to calculate theconcentrations.7
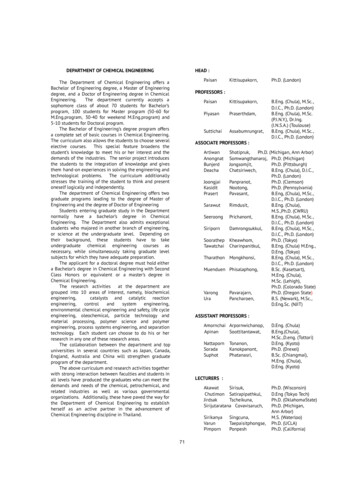
TB Watson, August 2017, DOE/SC-ARM-TR-19610.2 NO3 Response Factor (RF) Calibration and NH4 and SO4 RelativeIonization Efficiencies (RIE)This calibration determines the instrument response to nitrate (NO3) and the relative ionizationefficiencies of sulfate (SO4) and ammonium (NH4). These values are used in the conversion of massspectrometer response to mass loadings. The NH4NO3 data are used to calculate the NO3 Response Factorand the NH4 Relative Ionization Efficiency. The response at m/z 28, 32, and 128 are also measured toobtain reference values for N2, O2, and naphthalene, which are used to correct the data for changes inresponse factor. The (NH4)2SO4 data are used to calculate the SO4 apparent response factor (RFapp) and theNH4/SO4 Relative Ionization efficiency (RIE). The SO4 RIE is calculated based on the NH4/NO3 RIE andthe NH4/SO4 RIE values.The calibration is performed by using an aerosol generator and a Scanning Mobility Particle Sizer(SMPS), and a dilution system generate a 300 nm aerosol at a range of concentrations from approximately100 to 1000 particles per cc. The Differential Mobility analyzer of the SMPS (DMA) is set to select 300nm particles because this diameter particle is passed with 100% efficiency by the particle lens in theACSM. Calibration points are collected over a range of approximately 100 to 1000 particles cm3, asindicated on the CPC. The calibration software converts the particle concentration to µgm-3. An exampleof calibration curves is given in Error! Reference source not found.Figure 4.Results of calibration using NH4NO3 and (NH4)2SO4.8
TB Watson, August 2017, DOE/SC-ARM-TR-19610.3 Calibration FrequencyThe manufacturer has indicated in recent discussions that the ideal calibration frequency is once a month.The SMPS is a cumbersome and expensive instrument that requires a sealed radioactive source or an xray generator to reduce static charge on the aerosol. This instrument is not available at all locations wherethe ACSM is deployed. A dedicated calibration SMPS has been procured by ARM, but this instrumentmust service ACSM in three locations as well as other particle measurement instruments. These locationsare distributed across the globe in locations that have included Finland and Antarctica. Monthlycalibrations are not practical. We are developing a calibration schedule to maximize frequency ofcalibration for all instruments. We are also developing procedures to evaluate instrument performance bymonitoring the air beam signal present in all measurement because of the constant presence of peaks atm/z 28 resulting from nitrogen. This peak is used to adjust the mass concentrations for changes in detectorsensitivity caused by aging. It has been suggested that recalibration should be performed when the airpeak decreases by 10%. This as well as other diagnostics will be evaluated going forward.11.0 Inlet SystemAmbient aerosol-laden air is brought to the instruments through an 8"-diameter external stack nominally10 m above the roof (Error! Reference source not found.) of the enclosure at 800 lpm. Inside the stack,sample air flows through a 2"-diameter stainless steel pipe in the center of this larger flow at 120 lpm.This flow is split inside the enclosure into four 30-lpm sample lines, one of which supplies the ACSM.The ACSM is connected to this line with a “T” and pulls sample through insulated 3/8-inch OD coppertubing connected to a separate vacuum system (Error! Reference source not found.). This line isinsulated to prevent condensation in the line in the air-conditioned interior of the instrument enclosure. Acritical orifice connected to the vacuum line maintains a flow of approximately 3 lpm past the instrumentinlet. A water trap is installed at the point where the line is exposed to remove any liquid water that maycondense as the line is cooled. The sample stream is dried with a Nafion dryer immediately after the trap.The sample entering the ACSM for analysis is pulled from the dry sample stream at 0.1 lpm controlled bya 100 µm critical orifice.9
TB Watson, August 2017, DOE/SC-ARM-TR-196 7 m x 8" o.d. Al outer tube(length not to scale) 1.8 m x 2" i.d. ss inner sampling tubewith optional heating for RH control(length not to scale)Critical Orificefrom sheath 3 L/min1/4" o.d. CuACSMInletNafion1/2" BrassSwagelokTeeCritical Orificeto sheath 6 L/minACSMCritical Orifice @3 LPMRoof LineCarbon-Vane Pump Manifoldexhaust in Pump Box 9 L/min totalInstrumentExhaust toCabin3/4" o.d., 1/2" i.d.Tygon TubingRotameterExhaustManifoldNorgrenWater Trapwi drainRotameter #427 LPMAtmospheric Sciences DivisionEnvironmental Sciences DepartmentInlet Schematic for MAOS A, Inlet Port 4 (Detail)Figure 5.SR Springston Drawn: 11-10-22Revised:11-10-25No. 1 of 1Material:File: MAOS A Inlet 4 111022.wpgSchematic of inlet system.10Rev: 1
TB Watson, August 2017, DOE/SC-ARM-TR-196Figure 6.Aerosol Observing System (AOS) instrument enclosure with 10 m sampling stack.12.0 Software12.1 ACSM Data Acquisition Software (DAQ)Two software applications are used with the ACSM system: A Visual Basic (.NET) application that handles the communications with the Prisma electronics,instrument configuration, and saving of raw mass spec files An Igor procedure provides a user interface for real-time viewing and processing of the recorded data.The Igor procedure uses routines to convert the mass spectra to chemical species by applyingfragmentation table calculations and generating time series. The Igor procedure also prepares datamatrices for positive matrix factorization (PMF) analysis. The primary role of the .NET application is toconfigure the mass analyzer, write raw data to the hard drive, and push data to Igor. Within the Igorinterface the user can manipulate and transform the data without having any impact on the coreacquisition activity that runs in the background. As data are loaded into Igor, the Igor procedure files11
TB Watson, August 2017, DOE/SC-ARM-TR-196process the mass spectra for aerosol mass loading and prepare them for PMF analysis. The ACSM Igorapplication can be run at any time to process new or existing data sets.Acquisition Computer Directory StructureThe ACSM DAQ program should be installed under the root director of drive C atC:\ACSM\ACSM DAQ. There are several subdirectories that are accessed and usedby ACSM DAQ; these are: C:\ACSM\ACSMData– The directory where the ACSM raw data files are written. C:\ACSM\ACSMSettings– This directory contains files that store program variables or configuration information. ACSMDAQ will automatically create these files if they do not exist. Files would include: ACSM Ionizer.dat (stores ionizer settings) ACSM Param.dat (stores scan and save settings) ACSM IPConfig.dat (stores information for connecting to Prisma) ACSM eMail.dat (stores SMTP settings for email notifications) ACSM LensAlign.dat (stores lens alignment data) DAQVal Descriptor.itx (stores text values that describe DAQVals contained in the raw datafiles) Under the program root directory, C:\ACSM, three log files are created automatically which recordvarious instrument events.– ErrorLog.dat (contains a history of error messages flagged by ACSM DQ)– PwrFailLog.txt (contains history of instrument power failures.– OPCErrorLog.txt (contains a history of OPC errors flagged by ACSM DAQ) To operate the Igor data analysis routines, the following Igor procedure files are required whichare located at C:\ACSM\ACSM Igor\ :– ACSM Local.ipf: performs data loading and processing for display.– GlobalUtilities.ipf :A set of helper functions used by ACSM Local.ipf To export ASCII files as well as the *.itx Igor data files, the fileC:\ACSM\ACSM Igor\acsm local 1530 w exporf.ipf is also necessary. In addition, ACSM Local.ipf requires some auxiliary data to process the mass spectra tochemical species. These files must be located at:– C:\ACSM\FragmentDataDirectory\frag\– This directory contains many files necessary for calculating the mass concentration from the massspec signal.13.0 Maintenance13.1 Critical Orifice ReplacementThe critical orifice at the inlet can become clogged with particulate material, sespecially if a 10µ cycloneimpactor is not used in the inlet stream. The inlet pressure, displayed in the “ACSM Configuration andControl” window, “Analogue and Digital IO”, will drop from the nominal value of 1.3 torr if the orifice isclogged. A new orifice can be installed or the old orifice can be cleaned in an ultrasonic bath containingdistilled water and reinstalled to fix this problem.12
TB Watson, August 2017, DOE/SC-ARM-TR-19613.2 Turbo Pump FailureTurbo molecular pumps can fail after months of continuous operation. The symptom of this failure is aloss of vacuum and the shutdown of the vacuum system. This problem can be diagnosed by restarting thebacking pump by clicking on MD1 in the pump control window software and starting the turbo pumpsindividually. The good pumps will start and the failed pump will shut down. When the failed pump shutsdown it will turn off the other pumps. It is usually the small turbo pump, pump 3, that fails. This problemcan be fixed by installing a new turbo pump.13.3 Switch Ionizer ElementThe ionizer element will burn out after several years of continuous operation. The ionizer element failureerror message will appear and the element “on” check box will be unchecked in the “Vaporizer andIonizer Control” window (Error! Reference source not found.). If the “on” box is rechecked, the ionizerwill shut down. There are two ionizer filaments in the ACSM. Filament 2 can be selected by clicking onthe button to the right of the “on/off” check box so that the green dot appears. The values to the right ofthe “Emiss, mA” and Max, amps boxes will increase if the filament is operating.Figure 7.“Vaporizer and Ionizer Control” panel. The “Filament 1” and “Filament 2” selection buttonsare indicated.13.4 Prisma Computer LockupIf the data acquisition stops because the Prisma computer locks up, it is necessary to rebootPrisma computer. The symptoms of this problem are: The loss of active status of the “ACSM Configuration and Control”,13
TB Watson, August 2017, DOE/SC-ARM-TR-196 a failure to update
The Aerodyne Aerosol Chemical Speciation Monitor (ACSM) measures particle mass loading and chemical composition in real time for non-refractory sub-micron aerosol particles. The ACSM is designed for long-term unattended deployment and routine monitoring applications. Figure 1. The bench top configuration of the ACSM. 2.0 Mentor Contact Information