Transcription
Investing for Retirement in a Low Returns Environment: Making theRight Decisions to Make the Money LastAlistair Byrne and Catherine ReillySeptember 2017PRC WP2017Pension Research Council Working PaperPension Research CouncilThe Wharton School, University of Pennsylvania3620 Locust Walk, 3000 SH-DHPhiladelphia, PA 19104-6302Tel.: 215.898.7620 Fax: 215.573.3418Email: ncil.orgAll findings, interpretations, and conclusions of this paper represent the views of the author(s) and not thoseof the Wharton School or the Pension Research Council. 2017 Pension Research Council of the WhartonSchool of the University of Pennsylvania. All rights reserved.
Investing for Retirement in a Low Returns Environment: Making the RightDecisions to Make the Money LastAlistair Byrne and Catherine ReillyAbstractLow returns on financial assets and increasing longevity mean saving for retirement isbecoming more challenging than it has been in the past. Generations retiring in the near term(boomers) face increased longevity, but have lived through periods with strong market returnsboosting their assets, and many also have DB entitlements. Younger generations also faceincreasing longevity, and in addition are likely to earn much lower investment returns on theirretirement assets and few have DB. The challenge for them is tougher. We model the likelyoutcomes for different cohorts under scenarios for savings behavior, investment returns and lifeexpectancy. We take account of likely pillar one entitlements and varying replacement raterequirements and expected longevity in different demographic and income groups. We show thatyounger generations do face substantial challenges, but there are plausible courses of actioninvolving increased contributions and delayed or partial retirement that can provide reasonableincome replacement rates in retirement. We map out the steps that the retirement industry(government, employers, financial services providers) needs to take to support people in followingthese courses of action, such as providing more flexibility over social security.Catherine ReillySenior Investment StrategistDefined ContributionState Street Global AdvisorsCatherine reilly@ssga.comAlistair ByrneHead of Investment StrategyEuropean Defined ContributionAlistair byrne@ssga.com
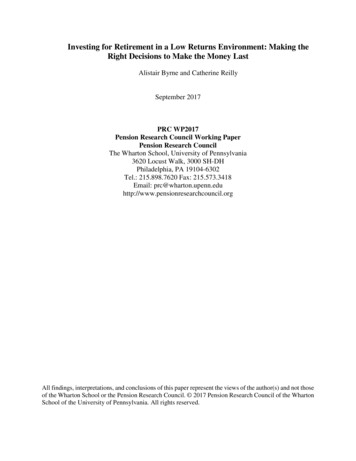
At the same time that longevity has been increasing, expected investment returns havefallen below historical levels. Figure 1 shows that Society of Professional Forecasters estimates of10 year real returns on key US assets classes, with forecasts made from 1992 to 2017. Expectedbill rates, bond returns, and equities returns are all significantly lower now than in the recentdecade. In a lower return environment, markets do less of the work for savers, so contributionsneed to be higher instead. For Baby Boomers who have enjoyed good returns for most of theircareers, this will have little impact. For younger individuals, however, lower future returns are amore significant drag on retirement income prospects.Figure 1 hereHow to Reach Target Replacement Rates with Defined Contribution PlansApproach and methodology. One goal of this chapter is to provide participants, plan sponsors,and policymakers with simple guidelines on the strategies that participants can employ to haveenough money available in retirement. It seems self-evident that people should save more andexpect to work for longer, but how much more do they need to save and at what age should theyaspire to retire? The answers to these questions may be different depending on the participant’scurrent age and previous contribution history. Furthermore, because the Social Securityreplacement rate varies depending on income level, we also need to take this into consideration.To do so, we first look at the replacement rate that different age cohorts can expect fromtheir DC savings. We use identical savings assumptions, so that any differences in outcomesbetween cohorts are due purely to differences in market returns. We then study the impact thatincreasing the savings rate or postponing retirement would have on retirement readiness for thedifferent age cohorts. Unsurprisingly, we find that the outlook for younger generations is
considerably more challenging than for older generations who have benefited from strongerhistorical returns. Of course, in addition to their DC savings, most participants will also receiveincome from Social Security in retirement and some will also have income from DB plans.Second, we investigate the outlook for different income groups, taking into account bothdifferences in life-expectancy and Social Security replacement rates. Primarily due to theprogressive nature of Social Security, low income cohorts will need lower DC savings rates toachieve retirement readiness than will higher earning cohorts. Finally, we study the strategies thatlate-starters (i.e., 45 and 55 year participants without accumulated savings balances) can employto improve their ability to retire in comfort. By employing aggressive savings rates (over 15%)and working to 70 or beyond, these groups are likely to achieve reasonable retirement outcomes.Challenges for different age cohorts. To calculate outcomes by cohorts, we assume that all theindividuals invest in identical portfolios consisting of 80 percent S&P500 stacks and 20 percentUS government bonds throughout their working lives. While this portfolio is undeniably simplifiedand may not be the investment vehicle of choice for current cohorts, we choose it becausesomething like it has been available to all the different cohorts (unlike e.g., target date funds, firstlaunched in the mid-1990s). This also provides a reasonable approximation of the averageequity/bond split of a target date fund during the accumulation phase. We assume that allparticipants join the plan at the age of 22 and invest the same amount of their salary (in our basecase, 9%) in the portfolio, and they also experience the same nominal wage growth (2% per annum)throughout their careers. The nine percent contribution rate is our base case because the medianemployee contribution rate is about six percent and the most common employer matchingcontribution is three percent (Vanguard 2016). For older participants, their returns are basedmainly on realized historical returns; for younger participants, their portfolio growth is based
mainly on forecasted future returns based on Monte Carlo simulations using asset class returnforecasts from SSGA’s Investment Solutions Group. We take into account that life expectancywill continue to rise, so that someone now is 25 years old will have higher life expectancy at age65 than someone now 60 years old. We calculate the replacement rate that each age cohort canexpect at retirement, based on the returns that their portfolios have delivered over their savingsperiods and their life expectancies at retirement.We show that there is wide variation in outcomes by cohort (see Figure 2). A hypotheticalindividual currently 60 years old and who retires at age 65, having been the saving since age 22,could expect to achieve a 211 percent replacement rate from his DC savings alone. In addition, hecan expect to receive Social Security and may well have some DB benefits as well. (While few60-year-olds may have been in a DC plan since the age of 22, they could have made contributionsto a retirement savings account by themselves.) By contrast, an individual currently 25 years oldand who employs the same saving strategy could expect to achieve a 27 percent replacement rateif he was to retire at age 65. Furthermore, the younger individual is unlikely to have any DBentitlements and faces more uncertainty regarding the amount of Social Security that he willreceive. A 45-year-old individual can expect better outcomes than the 25-year-old but is alsoclearly disadvantaged compared to the 60-year-old.Figure 2 hereDue to these lower expected returns, younger cohorts are clearly at a disadvantage to olderworkers. The most obvious tactics that younger workers could adopt to improve their situation areto contribute more and to work for longer. Yet the real questions is, how much more and howmuch longer? We also seek combinations that are feasible: savings rates that are affordable, andworking patterns that are manageable.
For example, let us assume that our worker aspires to achieve a 40 percent replacementrate from his DC plan (while relying on Social Security and other sources of income for the restof his retirement income). Depending on his desired retirement age, he will have a menu of actionplans to choose from (here, we assume in all cases that he employs the same savings ratethroughout his working life). A 25-year-old could reach a 40 percent replacement rate bycontributing about 13.5 percent by working until age 65; by contributing slightly above 10 percentand working to age 70, or by contributing about seven percent and working to age 75 (see Table 1below). The 35 and 45-year-olds benefit from stronger historical returns, so they can achieve thetarget replacement rate at slightly lower contribution rates.Table 1 hereIt is encouraging to see that these contribution rates seem feasible. Yet it is important tonote that this assumes consistent savings behavior during the entire working life, no career breaks,and no leakage from retirement savings. In fact, however, leakage can be a significant drag onsavings accumulation (Munnell and Webb 2015). Moreover, those who start to save later or aspireto retire earlier will require higher savings rates. In sum, financial advisers’ often-quoted rule ofthumb of 12 – 15 percent of income seems surprisingly realistic (Munnell et al. 2014).Challenges for computations by income: differences in life-expectancy and Social Securityreplacement rates. Participant income levels are relevant to our computations for reasons overand above the fact that those with more income will be more able to save. First, public SocialSecurity or pension benefits tend to be (fairly) flat meaning that replacement rates from statepension are higher in percentage terms for lower earners. Second, life expectancies are correlatedwith income levels, in that higher earners tend to live longer. Both factors will influence ourretirement income calculations.
Calculating required replacement rates. An often-cited rule of thumb suggests a two-thirds or 70percent income replacement target, but this is rather imprecise. In reality, the required replacementrate depends on a variety of factors including household size, home equity, region, etc.(MacDonald et al. 2016). Broadly speaking, a lower earner will need a higher replacement rate inpercentage terms (to cover essential expenditures) compared to a higher earner, though the lattermay have higher aspirations.There will also be differences in Social Security entitlements and other sources of income.Lower-paid individuals are likely to receive relatively high replacement rates (in percentage terms)from Social Security. Nevertheless, percentages can be misleading, as people on very low incomesmay need close to a 100 percent replacement rate simply to meet their basic needs, especially ifthey have few other financial resources. Lower-income persons also typically have poorer healthand lower life expectancies reducing their ability to extend their working life. Indeed only about30 percent of males in the lowest income quintile are still in full-time employment at age 60,compared with almost 80 percent in the highest income quintile (Gordodnichenko et al. 2013). Yetthis also reduces the number of years in retirement that lower-income persons need to fund.Higher-income individuals will receive considerably lower replacement rates from SocialSecurity, but they are more likely to be able to manage with the often-quoted 70 percentreplacement rate or even less. They are also more likely to own their own homes and have othersources of income in addition to Social Security. Extending their working lives may also be morefeasible, and indeed more necessary, since their higher life expectancies mean that they will havea longer retirement period to fund. In order to achieve a given replacement rate target, higherearners must also generate a higher replacement rate from their DC savings. Table 2 shows SocialSecurity replacement rates by income levels for individuals retiring either at age 65 or 70 (currently
the maximum age for claiming Social Security). It illustrates the progressive nature of SocialSecurity benefits. For example, a low earner can expect a 49 percent replacement rate from age65, whereas someone earning at the contribution cap would have a replacement rate of only 24percent, at that age.Table 2 hereThere is also substantial evidence that high income individuals have longer life expectancies thanthe lower income groups (see Table 3). This disparity has risen for several decades, and addingrace and education to the computation makes the disparity even more striking. The life expectancyfor white American males with 16 years or more of schooling in 2008 was 14.2 years more thanfor black American male with fewer than 12 years of education (Olshansky et al. 2012).Table 3 hereAccordingly, higher earners also expect to spend a longer period in retirement, while receiving alower replacement rate from Social Security. This means that in order to achieve a given targetreplacement rate, higher earners must save a higher proportion of their incomes than low incomeearners, or live on relatively less in retirement.In our next round of calculations, we examine the case of a 25-year-old at the start of theircareer. We add our DC replacement rate calculations to the expected Social Security replacementrates for different income cohorts to assess how much individuals in different income cohortswould need to save in order to achieve a target income replacement rate at when retiring at age 65or 70 (the current maximum age for starting Social Security benefits).To illustrate, we assume that all households target a 70 percent replacement rate atretirement. As Figure 3 shows, the mix of DC savings and Social Security that provides thisreplacement rate varies by income group. A low earner retiring at age 70 would be able to rely
entirely on Social Security to provide a 70 percent replacement rate, whereas a maximum earnerretiring at 65 would need to generate a 46 percent replacement rate from his DC savings. Themaximum earner here is an individual earning the maximum wage on which Social Securitycontributions are paid (currently 127,000); individuals on higher salaries will need to generate aneven higher proportion of retirement income from their DC savings.Figure 3 hereMoreover, higher earners must save considerably higher shares of their salaries than do thelow earners. If we exclude the very lowest income group, people aspiring to retire at age 65 shouldsave between 11 and 15 percent of their salary; those planning to defer retirement until 70 shouldsave between four and eight percent (see figure 4).Figure 4 hereTwo interesting implications arise from this analysis. First, even in the low returnenvironment, people who save systematically for retirement should be well equipped to retire evenat fairly modest deferral rates (we reiterate that these are total savings rates including an employermatching contributions). Participants wishing to retire at 65 need to save almost twice as much oftheir salary as those planning to retire at 70. Our model assumes that participants keep the same80/20 portfolio until retirement; this is more aggressive than most people are likely (or should)have, and it may slightly overstate the investment gains during the last years of working life.Accordingly, these should be interpreted as minimums rather than recommended rates. Yet thisdoes not change the conclusion that postponing retirement has a very positive impact on retirementreadiness, not least through its impact on the replacement rate offered by Social Security.Second, because the low earners receive a high replacement rate from Social Security, theyonly need to save a fairly small proportion of their salaries. If they are able to work until age 70,
they may not need to save much at all. This has interesting implications for the potentialintroduction of automatic enrollment schemes targeted at uncovered employees, such as state plansin the US (Gale and John 2018) or automatic enrollment in the UK. Employees at the lower endof the earnings spectrum are also less likely to be offered retirement plans by their employers thanthose at the higher end, and automatic enrollment plans often have quite modest total contributionrates (a total rate of eight percent in the UK, while the Oregon State plan targets at 6%). Theserates are likely to be inadequate for higher earners, but as we have demonstrated, they are probablyample for the low paid. Requiring people on low incomes to save more could be counterproductive, as it may lead them to opt out altogether. Since optimal savings rates will differ byearning levels, one potential solution could be to have different automatic enrollment rates foremployees by income level. Alternatively, communication and engagement chould focus onencouraging higher earners to save more, though plan sponsors will need to be aware of thepowerful influence of inertia in preventing action.Challenges for late starters. In the previous section, we showed that participants whosystematically save for retirement throughout their careers can reach reasonable outcomes withfairly low savings rates, despite the low expected market returns. Yet, many people reach middleage without having saved significant amounts for retirement. What strategies can these individualsemploy to maximize their chances of attaining financial security in retirement?We study a 45 and a 55 year old who start saving for retirement, and first evaluate theimpact of different contribution rates (10, 15, 20 and 25%) and alternative retirement ages. Wethen study how working part time in retirement (from 65 to 70 or from 70 to 75) could affectexpected replacement rates. For such late starters, we assume that they make their contributions toan age-appropriate target date fund. Again, assumed investment returns are based on SSGA asset
class return forecasts, and in retirement, the same drawdown rates are used as in the previoussection.Participants who start the retirement saving journey late do face more challenges, yet theycan also significantly improve their retirement readiness with a disciplined approach to saving andby postponing retirement. Figure 5 shows the DC replacement rates that an individual starting tosave at age 45 or 55 can expect to achieve, depending on his contribution rate and retirement age.Unsurprisingly, even at these relatively high contribution rates, outcomes are considerably poorerthan for early starters. Previously we showed the combinations of contribution rate and retirementage, that would lead to a 40 percent DC replacement rate. Here, by contrast, we see that even a 20percent contribution rate and working until age 70 provides only a fraction of this target.Figure 5 hereFigure 6 shows expected total replacement rates for late starters at different contributionrates, including Social Security. The first calculation assumes a medium earner who saves 15percent and retires at age 65. He can expect a replacement rate of just over 50 percent; by delayingretirement to age 70, he could achieve a total replacement rate of 70 percent. Those on highersalaries will have lower Social Security replacement rates at all ages.Figure 6 herePotential policy reforms. As evident, postponing retirement is an extremely powerful tool forimproving retirement outcomes. In fact, retiring at age 70 or even 75 would improve retirementreadiness for all cohorts, but particularly for late starters and higher earners. Though some peoplemay not be physically able to work full time that late, part-time work may be feasible for many.Another consideration that Social Security payments currently start the latest at age 70, andthere is no option for ‘partial retirement.’ One alternative policy would be to allow individuals to
take out partial Social Security benefits rather than obliging them to always take the full benefit.For example, in Sweden, people who have reached the minimum age of eligibility for SocialSecurity (62) can take a 25 percent, 50 percent, 75 percent, or 100 percent benefit, and modify thispercentage when desired at an actuarially fair rate. There is also no maximum age by which fullpayments must start (Pensions Myndigheten 2016). Such a flexible option could be particularlyuseful for people who start saving for retirement later in life.Another option would be to give people a choice to defer the start of Social Securitybenefits beyond age 70, to make the most efficient use of Social Security’s cost-efficient longevityinsurance. This would make it possible to use Social Security as a longevity backstop providingthe main source of income in late life, rather than a steady source of income throughout retirement.For example, in Australia, eligibility for the Age Pension is based on an asset test (reassessedannually) rather than retirees’ age. People are not eligible for the Age Pension until they havedrawn their assets down to a minimum level, after which they receive the flat rate Age Pension forthe rest of their lives. Johnson (2016) suggests a similar modification to the UK State Pension,postponing the start of payments to age 80 but doubling the payment.If it were possible to defer Social Security payments until age 75 at an actuarially fair rate,this would substantially increase replacement rates. Some people might find it preferable to rundown their DC balances first, in order to maximize the benefit from Social Security by claimingat a later date. The ability to postpone payments and receive higher benefits for a shorter periodcould be particularly valuable for higher earners, who would now actually receive meaningfulincome and valuable longevity insurance from Social Security. Table 4, calculates the SocialSecurity replacement rate for starting payments at age 75 by assuming that this would lead to thesame increase as deferring from 65 to 70. As a matter of fact, this understates the actuarially fair
increase, as mortality credits would accumulate faster between open 70 and 75 than between 65and 70. Nevertheless, a flat rate has the benefit of simplicity and is used in a number of countries.For example, the UK uses a flat rate increase of 5.8 percent per annum for deferring the statepension.Table 4 hereAnother policy alternative would be to offer people a lump sum rather than a higher annuitypayment as a means to encourage people to defer retirement. Maurer et al. (2016) found thatoffering a lump sum incentive rather than a higher monthly payment after the Early RetirementAge (62) induced people to voluntarily claim 6 – 8 months later that they otherwise would. Inessence, offering lump sum incentives builds on the behavioral reluctance of people to annuitize.The fact that those who currently claim at the youngest ages were also most responsive to the lumpsum offer indicates that this could be an effective incentive, particularly for the less financiallyliterate sections of the population. Maurer et al. (2017) also found that lump sums of 85-90 percentof the actuarially fair amount were still effective in encouraging later claiming.As the population approaching retirement is becoming increasingly heterogeneous, it mayalso be necessary to offer different incentive structures for different groups. For example, offeringlump sum incentives could be an effective and equitable way of encouraging lower earners to deferclaiming Social Security. As lower earners have lower life expectancies. They expect to deriveless benefit from deferring Social Security for a higher payment than higher earners. Offering thema lump sum would allow them to reap the full benefit of deferring retirement.We have also modeled what would happen if employees had the option of taking out 50percent Social Security at ages 65 or 70. For those who work part time from 65 to 70, we calculatethe Social Security benefit by assuming that at age 65 they receive 50 percent of the benefit payable
at 65; from age 70, they receive 50 percent of the benefit payable at 65 and 50 percent of the benefitpayable at age 70. We follow an equivalent procedure for those who work part time from 70 to 75.We model the income stream that they would receive by subtracting the DC contribution rate fromthe wage income (hence the 85 percent replacement rate while in full time work).Figure 7 shows that for the participant who started saving at age 45, working part time inretirement until age 70 would get him to a replacement rate slightly higher than 60 percent. Whilethis may not be optimal, it is still a 10 percentage point improvement compared to if he had retiredfull time at age 65 (Figure 6). The participant who did not start saving until age 55 only achievesa 55 percent replacement rate because of his limited DC savings (Figure 8).Figure 6, 7 and 8 hereLate starters aiming for higher replacement rates could also benefit from working part timefrom all 70 to 75, as they would reap the benefit of higher Social Security payments and a longersavings period (Figures 9 and 10). The income stream in these calculations is rather uneven; onesolution would be to start drawing down some DC savings at age 70 to generate a smoother incomestream.Figure 9 hereFigure 10 hereThis hypothetical delayed Social Security payment is not currently available, yet thesimulations illustrate how powerful delaying retirement and the start of Social Security paymentscan be. Even with the current system, it can be beneficial for employees with limited savings touse their DC balances to delay taking Social Security as long as possible, rather than to use themto supplement their Social Security payments. Offering more flexibility to defer Social Security
payments could further enhance the value of this benefit and allow individuals to optimize thevalue of their DC savings.Altering the Choice EnvironmentThese approaches require individuals to save consistently over their working lives, and there is arange of behavioral interventions (‘nudges’) that can help people save more to generate betterreplacement rates. It is now fairly well established that automatic enrolment can boost pensionparticipation rates. Automatic enrolment is now mandated in the UK and achieving opt outs ofonly around 5-15 percent (DWP 2014). Many large US DC plans also use automatic enrollment(Vanguard 2016) and the approach is under consideration for improving participation in Ireland.Australia and Chile go even further with compulsory retirement plan participation for allemployees.It has also been shown that ‘save more tomorrow’ approaches – involving automaticallyescalating contribution rates – can be effective in boosting contribution rates over time (Benartziand Thaler 2007). This can allow for participants to be introduced to retirement saving at a lowrate, avoiding adverse reaction to reductions in take home pay, before being raised to the longterm required levels. This approach is in use in a growing number of large US plans (Vanguard2016), and in the UK and Austraia automatic enrolment and autoescalatio have been introduced.Matching contributions can also be used to encourage voluntary contributions to the matchthreshold. This can be employer contributions in response to employee contributions, or tax relieffor employee contributions which may be presented as a form of matching (relief from 20 percenttax can be recast as 1:4 matching, which may be simpler for participants to understand.)
Finally, reducing pre-retirement ‘leakage’ of retirement assets will help enhance savingsrates. This can include ensuring accumulated assets rollover into a retirement plan on job changerather than being cashed out, and avoiding early withdrawals. For example, the UK ‘pensionfreedoms’ abolished annuitization and provided full access to retirement assets from age 55. Earlyevidence shows a significant number of participants taking withdrawals in their 50s for nonretirement reasons (leisure, home improvement) with relatively little consideration for the impacton longer term retirement income (SSGA 2016).Making it easier for people to work for longer. As the calculations above show, creating a betterretirement income system in the face of low returns will require longer working lives. This meanscreating incentives for individuals to stay employed (which may mean reskilling or reengineeringjob roles), and moving away from conventional ages.Another important question is how employers will facilitate and value older workers. Somefirms already employ them as a source of competitive advantage: for example B&Q, a homeimprovements store chain in the UK, is known to employ retirees who are able to advise customerswith a lifetime of experience of household maintenance. Yet other firms are not ready for theincreasing number of older workers (Sonsino 2017). There may also be regulatory barriers such ascompulsory retirement ages to be overcome. For example, both Sweden and the UK have abolishedthe compulsory retirement age for most positions. Additionally, policymakers may need to takesteps to encourage the hiring of older workers, e.g. by subsidizing healthcare costs or reducingemployment protections.Another way to make retirement systems more sustainable is to require people to worklonger, by raising the retirement age. Yet a uniform increase in the minimum retirement age risksmay be seen as unfair to low earners who have lower average life expectancies and likely to be
employed in professions where extending the work l
10 year real returns on key US assets classes, with forecasts made from 1992 to 2017. Expected bill rates, bond returns, and equities returns are all significantly lower now than in the recent decade. In a lower return environment, markets do less of the work for savers, so contributions need to be higher instead.