Transcription
Kaur et al. BMC Family Practice 2013, ESEARCH ARTICLEOpen AccessDepression, anxiety and stress symptoms amongdiabetics in Malaysia: a cross sectional study in anurban primary care settingGurpreet Kaur1*, Guat Hiong Tee1, Suthahar Ariaratnam2, Ambigga S Krishnapillai2 and Karuthan China3AbstractBackground: Diabetes mellitus is a highly prevalent condition in Malaysia, increasing from 11.6% in 2006 to 15.2%in 2011 among individuals 18 years and above. Co-morbid depression in diabetics is associated with hyperglycemia,diabetic complications and increased health care costs. The aims of this study are to determine the prevalence andpredictors of depression, anxiety and stress symptoms in Type II diabetics attending government primary carefacilities in the urban area of Klang Valley, Malaysia.Methods: The study was cross sectional in design and carried out in 12 randomly selected primary care governmentclinics in the Klang Valley, Malaysia. A total of 2508 eligible consenting respondents participated in the study. TheDepression, Anxiety and Stress Scale (DASS) 21 questionnaire was used to measure depression, anxiety and stresssymptoms. Data was analyzed using the SPSS version 16 software using both descriptive and inferential statistics.Results: The prevalence of depression, anxiety and stress symptoms among Type II diabetics were 11.5%, 30.5% and12.5% respectively. Using multiple logistic regression, females, Asian Indians, marital status (never married, divorced/widowed/separated), a family history of psychiatric illness, less than 2 years duration of diabetes and current alcoholconsumption were found to be significant predictors of depression. For anxiety, unemployment, housewives, HbA1clevel of more than 8.5%, a family history of psychiatric illness, life events and lack of physical activity were independentrisk factors. Stress was significantly associated with females, HbA1c level of more than 8.5%, presence of co-morbidity, afamily history of psychiatric illness, life events and current alcohol consumption. For depression (adjusted OR 2.8, 95%CI 1.1; 7.0), anxiety (adjusted OR 2.4, 95% CI 1.1;5.5) and stress (adjusted OR 4.2, 95% CI 1.8; 9.8), a family history ofpsychiatric illness was the strongest predictor.Conclusion: We found the prevalence of depression, anxiety and stress symptoms to be high among Type II diabetics,with almost a third being classified as anxious. Screening of high risk Type II diabetics for depression, anxiety and stresssymptoms in the primary care setting is recommended at regular intervals.Keywords: Depression, Anxiety, Stress, Prevalence, Predictors, Diabetes, Outpatients, Urban, MalaysiaBackgroundDiabetes and depression are two of the commonest publichealth problems affecting people all over the world. About220 million people are estimated to be suffering fromdiabetes, majority of the burden being in low and middleincome countries (LMIC) [1]. Diabetes is also responsiblefor about 1.256 million deaths globally in 2008, with most* Correspondence: dr.gurpreet@iku.moh.gov.my1Institute for Public Health, Ministry of Health, Jalan Bangsar, Kuala Lumpur50590, MalaysiaFull list of author information is available at the end of the articledeaths occurring in LMIC. Unipolar depressive disordersand diabetes were ranked 3rd and 19th respectively asleading causes of disability adjusted life years (DALYs) in2004. The former also being the leading cause of years lostdue to disability (YLD). Unipolar depressive disorders arein fact projected to be the leading cause of disease burdenby 2030.In Malaysia, a middle income country, the prevalenceof diabetes has increased in the last decade from 5.7% to9.5% among individuals aged 30 years and above [2] andfrom 11.6% in 2006 to 15.2% in 2011 among individuals 2013 Kaur et al.; licensee BioMed Central Ltd. This is an Open Access article distributed under the terms of the CreativeCommons Attribution License (http://creativecommons.org/licenses/by/2.0), which permits unrestricted use, distribution, andreproduction in any medium, provided the original work is properly cited.
Kaur et al. BMC Family Practice 2013, 8 years and older[3]. Of the estimated 2.6 milliondiabetics in Malaysia, about 715,550 (27.5%) diabeticsare originating from the most populous regions inMalaysia namely the state of Selangor and the FederalTerritory of Kuala Lumpur [3]. In terms of leadingcauses of total YLD, the Malaysian National Burden ofDisease and Injury Study 2004 ranked diabetes mellitusas the third leading cause in both males (6.0%) and females (7.2%) respectively, while unipolar major depression was ranked as second and top most leading causein males (7.2%) and females (12.7%) respectively [4].It is well recognized that many individuals withchronic illnesses also have co-morbid unrecognizedmental health disorders [5]. The International Federationof Diabetes has stressed the importance of integratingpsychological care in the management of diabetes [6].It has been estimated that the risk of getting depression in the general population is 10-25% in females and5 – 12% in males. For individuals with chronic illnesses,the risk is higher at 25 – 33% [7]. Studies have shownthat diabetics have a higher prevalence of depressionthan non-diabetic populations [8-10]. Globally, an estimated 43 million diabetics have symptoms of depression[5]. Also, diabetes is associated with anxiety disorders[11]. Being diagnosed with diabetes is a life stressor byitself. It requires a large number of physical and mentalaccommodations. Depression adds to the burden ofmanaging diabetes. Furthermore, health care utilizationand costs [12-14] increase with the coexistence ofdiabetes and major depression.Depression and anxiety are associated with hyperglycemia [15-17]. While depression is associated withdiabetes complications [18,19] and increased functionaldisability [20,21]. Co-morbid depression has also beenshown to be associated with poor adherence to diabetesmedication and dietary regimens [16,22,23] and reducedquality of life [24,25]. Several studies have shown therisk of mortality to be increased by depression [26-29].The PROSPECT trial has shown that the five year risk ofmortality was reduced with a depression managementcare program among diabetics compared to similar patients with usual care practices [30].In Malaysia, there is paucity of epidemiologicalestimates on the prevalence, characterization and riskfactors of depression, anxiety and stress among diabetics.An estimate of the prevalence of these conditions is thefirst step towards priority setting and the planning,implementation and evaluation of a depression management intervention program in diabetes care in theprimary care setting. This study was carried out with theaims of determining the prevalence of depression,anxiety and stress, and its predictors among Type IIdiabetic outpatients attending government primary careclinics in the Klang Valley.Page 2 of 13MethodsThis was a cross sectional study carried out in 12selected government primary care clinics located in theKlang Valley.Study locationThe Klang Valley generally refers to the urban areas ofKuala Lumpur, its suburbs and adjoining areas in thestate of Selangor. To the North and East, it is demarcated by the Titiwangsa Mountain range, while to theWest by the Straits of Malacca. The estimated population of the Klang Valley is 7.5 million [31]. The twofederal territories of Kuala Lumpur and Putrajaya as wellas five districts from the state of Selangor (Sepang, HuluLangat, Gombak, Klang and Petaling) were included inthe study. In each of these localities the number ofclinics ranged from 1 to 13 with a total of 45 clinics.Sample size and samplingSample size was calculated using both the populationsurvey method for prevalence and for comparing twoproportions using the Sample Size Calculator for Prevalence Studies [32] and the PS Software [33] respectively.The larger minimum sample size required based on boththese methods was taken as the sample size for thewhole study. Based on 80% study power, Type I error of0.05, design effect of 2, a difference of 8% in two groupsand a non-response of 20%, a sample size of 2261 wasrequired.For sampling, a two stage stratified sampling techniquewas employed. About 25% of the total number of clinicsfrom each locality (with a minimum of one clinic) wasrandomly selected, giving a total of 12 clinics from thestudy area. The sample size was then proportionatelydistributed based on the number of clinics selected fromeach locality. For three localities where only one singleclinic was selected, the minimum sample size wasincreased to at least 250 to enable clinic level analyses infuture. The final minimum sample size for the study was2446.Study procedureAll patients attending the diabetic clinics during thestudy period were screened for eligibility to participate.The inclusion criteria were age 30 years and above,having Type II diabetes of at least six months (verifiedwith medical records) and being literate in Malay (whichis the official language of the country) or English. Patients with a known medically diagnosed psychiatricillness in the past (verified with medical records) or withany form of cognitive impairment such as dementia ormental retardation and females in the post-partum periodwere excluded. Eligible patients were then approached forwritten consent for the study. Prior to obtaining consent,
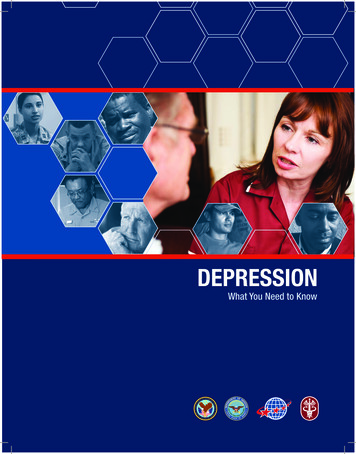
Kaur et al. BMC Family Practice 2013, age 3 of 13Table 1 Frequency distribution of respondents bysocio-demographic characteristics and selected variablesDemographic characteristics(n 2508)Age (years)MeanSD56.610.67nPercentage(%)30 – 391586.340 – 4945818.350 – 5989135.560 – 6972829.070 – 792389.5 128251.2Chinese43817.5Asian Indian78731.3Highest Educational LevelStudying and 920.3BMI (kg/m2)27.8328511.4Never completed primary school42316.9Completed primary school51920.7Never completed secondaryschool46218.4Completed secondary 81.1Normal ( 18.5 - 25.0)75129.9Overweight ( 25.0 - 30.0)103441.2Obese ( 30.0)69527.7Abdominal ObesityNo54021.5Yes196878.5 5.2176770.5 5.274129.5 8.5153761.3 8.597038.7Serum Cholesterol (mmol/l)1144.5400 – 69927711.0700 – 99931312.51000 – 199979831.88.36Duration of Diabetes (years)7.70.8782.0386.26 2 yrs2068.22 - 10 yrs152160.610 - 20 yrs58623.4 20 ychiatric illness in familyDiabetes in family2000 – 299951020.33000 – 39992078.34000 – 49991054.2 50001847.3712.8Married/Cohabiting204881.7Smoking status†Divorced/Separated/Widowed38915.5Marital StatusCurrent Job StatusCivil servant5.03Co-morbidity1,974.6 1,869.12 400Never married5.395Underweight ( 18.5)HbA1c (%)aNoneMonthly household income(MHI) in Malaysian Ringgit(MYRb)Table 1 Frequency distribution of respondents bysocio-demographic characteristics and selected Yes113545.3Non-smoker208983.3Former smoker1606.425910.3232692.7Life events within the last 6months2279.0Current smokerPrivate Sector employee44817.8Alcohol Consumption Status‡Self-employed1716.8Lifetime abstainerGovernment retiree2108.4Former drinker883.5Private retiree1586.3Current drinker943.8
Kaur et al. BMC Family Practice 2013, age 4 of 13Table 1 Frequency distribution of respondents bysocio-demographic characteristics and selected variables(Continued)Leisure-time Physical ActivityStatus§Regular activity79331.6Some .3Life events within the last 6months¶aone missing data.b1 USD is approximately 3 MYR.cCo-morbidity –any chronic co-morbid condition present.†Non-smoker - Respondent who reported to have never smoked at least 100cigarettes in his lifetime.Current smoker- Respondents who reported to have smoked 100 or morecigarettes in his lifetime and currently smoked daily or some days.Former smoker - Respondents who reported to have smoked 100 or morecigarettes in his lifetime but not smoking currently.‡ a) Current drinker – persons who have had at least 12 drinks in their lifetimeand at least one drink in the previous year.b) Former drinker - persons who have had 12 drinks in their lifetime, but nodrinks in the past year.c) Lifetime abstainer – had 12 drinks in his/her entire lifetime.§a) Inactive – did not report any sessions of light to moderate or vigorousleisure-time physical activity of at least 10 minutes or reported they wereunable to perform leisure-time physical activity.b) Some leisure-time activity – at least 1 session of light to moderate orvigorous activity of at least 10 minutes in duration but did not meet therequirement of regular leisure-time activity.c) Regular leisure-time activity – at least 3 sessions per week of vigorousleisure-time activity lasting at least 20 minutes or at least 5 sessions per weekof light to moderate physical activity lasting at least 30 minutes or both.¶ Life events – any sudden change in one’s life whether desirableor undesirable.all potential respondents were explained about the purpose of the study and the relevant procedures involved.They were assured that their blood results would benotified eventually to their attending physician. Subsequently, only consenting patients were recruited inthe study.the symptoms of depression, anxiety and stress respectively. The DASS has been shown to have high internalconsistency. The validated Malay or Bahasa Malaysiaversion of DASS 21 was used in this study [34]. Respondents were asked to rate their experience on each symptom over the past week on a 4-point severity scaleranging from 0 (does not apply to me), to 3 (applies tome most or all of the time). Scores for each scale werelater summed up and categorized as normal, mild,moderate, severe and extremely severe according to theDASS Manual [35].The following anthropometric and blood assay measurements were also taken:Height and weight for Body Mass Index (BMI) - Bothparameters were measured twice with the patientstanding bare footed. Height (to the nearest centimeter)was measured with fixed stadiometers (Seca, Vogel &Halke, Germany) and weight (to the nearest 0.1kilogram) was measured using an electronic floorweighing scale (Tanita HD 319 Personal Scale,Australia). BMI was classified according to the WorldHealth Organisation guidelines [36].Waist circumference (WC) - Measured twice using astandard tape measure as described by the NationalInstitutes of Health (NIDDK) [37]. Abdominal obesitywas defined by a waist circumference of 90 cm formen and 80cm for women [38].Total Serum Cholesterol (TC) - Measured using theAccutrend GCT (Roche Diagnostics, Germany) from asingle finger prick.HbA1c level - Measured using the DCA VantageAnalyser (Siemens Healthcare Diagnostics Inc, USA)from the same single finger prick.For all the measurements except TC and HbA1c anaverage of two readings was taken for analyses. Variableswere categories based on clinical and statistical reasoning.Ethical issuesEthical approval for the study was obtained from theMedical Research Ethics Committee, Ministry of HealthMalaysia (NIHSEC 08/0809/P09). Permission to conductthe study was also obtained from the State Health Directorsas well as Medical and Health Officers in charge of theselected clinics prior to the study.Data collection tools and measurementsSocio-demographic and other relevant information werecollected by five trained interviewers via face-to-faceinterview. Depression, anxiety and stress symptoms weremeasured using a self-administered short version of theDepression, Anxiety and Stress Scale (DASS), i.e., DASS21 (Additional file 1: DAS S 21). The short version has21 items which are divided into 7 items each assessingPre-test and pilot studyA pre-test was conducted on 40 Type II diabetic patientsselected conveniently from a government primary carefacility which was not included in the study. This waspurposively done to test the study questionnaire. Thepilot study was then conducted after the pre-test in twoother government health facilities that were also notselected for the study. The logistics and feasibility ofconducting the study were explored. Weaknesses thatwere identified from the pre-test and pilot study wererectified.Data management and statistical analysisAll questionnaires were checked for completeness ofresponse at the clinic and attempts were made to improve
Kaur et al. BMC Family Practice 2013, age 5 of 13Table 2 Frequency distribution of respondents bydepression status and socio-demographic characteristicsand other selected variablesVariablesPDepressionsymptomscORNo (%) Yes (%)(n) ‡(n) †Age (Years)95% CITable 2 Frequency distribution of respondents bydepression status and socio-demographic characteristicsand other selected variables (Continued) 30.0Lower Upper0.593605 87.19012.9 0.557 1.100.811.50AbdominalObesityNo *484 89.65610.4Yes1735 88.223311.8 0.344 1.16----0.851.5830 – 39*138 87.32012.7--40 - 49407 88.35411.7 0.752 0.9150.531.58Sr. Cholesterollevel (mmol/l)50 - 59796 89.59310.5 0.413 0.8060.481.35 5.2*1555 88.021212.060 – 69645 88.68311.4 0.655 0.8880.531.50 5.2664 89.67710.4 0.251 0.8570 - 79205 86.93313.1 0.730 1.1110.612.02HbA1c level (%) 8028617.6 0.443 1.4790.554.01 8.5 *1369 89.116810.9-- 8.5849 87.512112.5 0.239 1.160.911.49 2173 84.03316.0 0.036 1.531.032.26 2*2046 88.925611.1------82.4--SexMale*886 90.9899.1Female1332 87.020013.0 0.030 1.49Ethnicity(n 2507)----1.151.940.006---1155 90.11279.9--Chinese390 89.04811.0 0.529 1.120.791.59Co-morbidityAsian Indian673 85.511414.5 0.002 1.541.182.02No*466 87.96412.1Yes1753 88.622511.4 0.654 0.942202 88.62820.006None231 81.95418.1 0.001 2.241.373.65Primaryeducation837 88.910511.1 0.414 1.200.771.86Secondaryeducation883 89.610210.4 0.655 1.110.711.72Tertiaryeducation*268 90.5289.5--Monthlyhouseholdincome (MHI)in MalaysianRinggit (MYR) 1,000-0.006--0.701.26Yes1770.8711.4--29.2 0.010 3.22--1.327.82Diabetes infamilyNo*582 88.07912.0Yes1637 88.621011.4 0.688 0.945----0.7181.245Life eventswithin the past6 months9280.72219.3 0.001 1.901,000 - 3,000238 85.93914.1 0.021 1.54 3,000*276 88.23711.8Marital Status--2.80No*1221 88.915211.11.072.23Yes998 87.913712.1 0.435 1.103--Non smoker*1842 88.224711.8--143 89.41710.6 0.304 0.7970.5171.229234 90.3259.7 0.650 0.8870.5271.4912140 88.61.280.000Smoking status77.51622.5 0.001 2.721.534.83Former smokerDivorced/widowed/separated1850 90.31989.7 0.000 2.231.672.99Current smokerMarried*314 80.7Never married1.12Psychiatricillness infamilyNo*-0.65Duration 631.4100.550--Current drinker7519.3Current JobStatus----0.013No*Yes7927411.4--84.01516.0 0.173 1.48--0.842.610.961.57--Unemployed438 85.47514.6 0.005 1.621.162.26Leisure-timephysicalactivity levelHousewives682 87.39912.7 0.047 1.371.001.82Inactive1077 87.415512.6 0.103 1.23Retired334 90.8349.2 0.855 0.960.631.46Active*1142 89.513410.5Employed*765 90.4819.6-- 25.0*686 88.19311.9 25.0928 89.710610.3 0.256 0.84BMI (kg/m2)--0.207----0.6301.13--–Crude odds ratio.*- Reference group.†- Scores of 0–9 (normal).‡ Scores of 10 (mild, moderate, severe, extremely severe).cOR
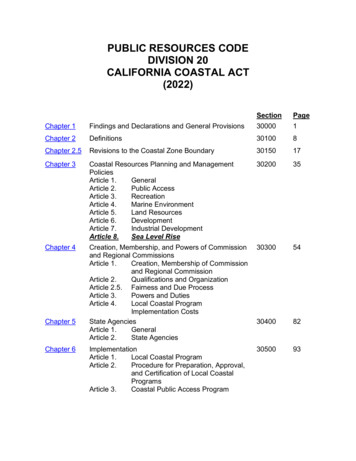
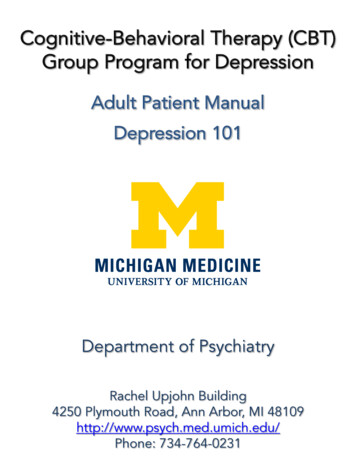
Kaur et al. BMC Family Practice 2013, he response rate for missing items. Data was enteredmanually into a database and cleaned before analyses. TheStatistical Package for the Social Science (SPSS) version16 software was used for both descriptive and inferentialanalysis. Items that were not answered by respondentswere considered as missing. Univariate statistics such asmean values, standard deviations, frequencies and proportion percentages were derived for continuous and categorical variables respectively. Bivariate and multivariateanalyses were used to measure the strength of associationbetween the variables in the study and identify predictorsfor the outcomes of interest respectively. All tests weretwo-tailed with significance defined as p 0.05. Oddsratios (OR) along with 95% confidence levels (CI) werederived where appropriate.ResultsOut of 2774 eligible patients approached, 2508 subjectswere successfully recruited, giving a response rate of 90.4%.Socio-demographic, clinical and other characteristics ofsample populationMajority of the respondents were between 50 to 59 yearsold (35.5%), females (61.1%), Malays (51.2%) and married(81.7%). Almost 40% had some form of secondary education and one third earned a monthly household income(MHI) of MYR 1,000 to 1,999. Slightly over one third ofrespondents were gainfully employed. The mean age andMHI was about 57 (56.6 SD 10.67) years and MYR2,000 (1,974.6 SD 1,869.12) respectively (Table 1).Over 41% of the respondents were overweight whilealmost twice the proportion had abdominal obesity.Almost 30% and 40% of the respondents had an elevatedTC level of 5.2 mmol and HbA1c of 8.5% respectively.Majority (61%) were diagnosed as having diabetes for2 - 10 years (Table 1).Almost 80% reported having at least one co-morbidcondition. Majority reported having at least one familymember with diabetes (73.6%) while only 1% reportedhaving a history of mental illness in the family. As forlife events, about 45% reported experiencing at least onelife event in the past 6 months. Current smokers andcurrent alcohol drinkers comprised 10% and 4% of therespondents respectively. Almost half of the respondentswere classified as physically inactive (49.1%).Depression, anxiety and stressOverall, the prevalence of depression, anxiety and stresssymptoms were 11.5%, 30.5% and 12.5% respectively. Onbivariate analysis using binary logistic regression, depression was found to be significantly associated with sex,ethnicity, educational level, MHI, marital status, currentjob status, duration of diabetes and family history ofpsychiatric illness (Table 2).Page 6 of 13For anxiety, all socio-demographic variables; females,Asian Indian, no formal education, MHI of MYR 3,000,divorcees/widowers, housewives and unemployment weresignificant. In addition, HbA1c 8.5%, 2 years durationof diabetes, presence of psychiatric illness in the family,life events and physical inactivity were also significantlyassociated (Table 3).Stress was significantly associated with sex, HbA1c, comorbidity, diabetes in the family, psychiatric illness in thefamily, life events and alcohol consumption (Table 4).Variables with a p value of 0.25 in the bivariateanalyses and thought to be important risk factors ofdepression, anxiety and stress were entered into themultivariate model. The forward likelihood ratio (LR)method was used to predict the associated variables fordepression, anxiety and stress symptoms in three separate models. The presence of interaction between theexplanatory variables was assessed prior to determiningthe final model.In the final model six variables i.e., sex, ethnicity,marital status, duration of diabetes, psychiatric illness inthe family and alcohol consumption were found to bepredictors of depression (Table 5). The strongest predictor was psychiatric illness history with an adjustedodds ratio (aOR) of 2.8 times followed by marital status(aOR 2.5-2.1) and current alcohol consumption (aOR1.8). Individuals with diabetes of less than two yearsduration were 1.6 times more likely to have depressivesymptoms than individuals with diabetes of longerduration while females and Asian Indians were 1.4 timesmore likely to have depressive symptoms compared tomales and Malay diabetic individuals.In terms of anxiety (Table 5), age group, job status,HbA1c, family history of psychiatric illness, life eventsand leisure-time physical activity remained significant inthe final model, while for stress five variables namelysex, HbA1c, co-morbidity, psychiatric illness in thefamily, life events and alcohol consumption were foundto be significant contributors. Individuals with a familyhistory of psychiatric illness were 2.4 times more likelyto report anxiety. Anxiety was 1.4 times more likely inrespondents experiencing life events, those physicallyinactive and with an HbA1c level of 8.5%. All diabeticswho were not gainfully employed were 1.2-1.6 timesmore likely of experiencing anxiety.Psychiatric illness in the family was the strongestpredictor of stress having aOR of 4.2 followed by currentalcohol drinkers with an aOR of 2.2. Having a highlyundesirable level of HbA1c was associated with at least1.6 times the odds of stress. Female diabetics and thosewith co-morbidity were 1.4 times more likely to reportstress after controlling for confounders.There was also significant correlation (p 0.01) betweendepression, anxiety and stress symptoms (r 0.360 for
Kaur et al. BMC Family Practice 2013, age 7 of 13Table 3 Frequency distribution of respondents by anxietystatus and socio-demographic characteristics and otherselected variablesVariablesAnxiety symptomsPcORNo (%) Yes (%)(n) †(n) ‡Age (Years)95% CILower Upper0.00630 – 39*102 64.65635.440 - 49341 74.211925.8 0.021 0.63--Table 3 Frequency distribution of respondents by anxietystatus and socio-demographic characteristics and otherselected variables (Continued)AbdominalObesityNo*373 69.116730.9--Yes1369 69.659930.4 0.827 0.980.801.200.741.08----0.430.93Sr. Cholesterollevel (mmol/l)--50 - 59628 70.626129.4 0.126 0.760.531.08 5.2*1215 68.855238.2 0.242 0.9060 – 69504 69.222430.8 0.253 0.810.561.16 5.2527 71.121428.9--HbA1clevel (%)--70 - 79144 60.59439.5 0.416 1.190.781.80 80221235.3 0.987 0.990.462.1664.7SexMale*710 72.826527.2Female1032 67.350132.7 0.004 1.30-Malay*911 71.037229.0Chinese314 71.7124Asian Indian516 65.727043628.4--641 66.132933.9 0.003 1.301.091.541.072.09---1.55--28.3 0.778 0.970.761.23Co-morbidity34.3 0.012 1.281.061.550.022EducationalLevel--0.070None184 64.610135.4 0.045 1.431.012.04Primaryeducation629 66.831333.2 0.076 1.300.971.73Secondaryeducation715 72.627027.4 0.922 0.990.741.32Tertiaryeducation*1101 71.6 8.51.09Ethnicity- 8.5*Duration ofDM (years) 2158 76.74823.3 0.019 1.49 2*1584 68.871831.2--No*382 72.114827.9----Yes1360 68.861831.2 0.141 1.170.951.451730 69.675430.4 0.043 2.291.035.1350.01250.0--No*477 72.218437.8 0.079 1.190.981.45Yes1265 68.558231.5------Psychiatricillness infamilyNo*214 72.38227.7Monthlyhouseholdincome (MHI)in MalaysianRinggit (MYR)----0.001Yes12--Diabetes infamilyLife eventswithin thepast 6 months 1,000457 64.924735.1 0.000 1.641.272.12No*996 72.537727.51,000 - 3,000912 69.739630.3 0.022 1.321.041.67Yes746 65.738934.3 0.000 1.38 3,000*373 75.212324.8--Marital Status--0.010Smoking status--1.161.630.064Non smoker*1433 68.665631.4--73.21926.8 0.626 0.880.511.49Former smoker186 71.87328.2 0.030 0.660.450.96Divorced/widowed/separated1445 70.660329.4 0.003 1.411.121.77Current smoker123 76.93723.1 0.292 0.860.641.14Married*245 63.01677 69.573730.52930.9 0.947 1.015Never married52--Current drinker14437.0Current JobStatus----Unemployed315 61.419838.6 0.000 1.861.472.35Housewives530 67.925132.1 0.002 1.401.131.74Retired265 72.010328.0 0.326 1.150.871.51Employed*632 74.721425.3------BMI (kg/m2)0.472-No*Yes0.000 25.0*529 67.925032.1 25.0721 69.731330.3 0.407 0.920.751.12 30.0492 70.820329.2 0.023 lactivity levelActive*931 73.034527.0Inactive811 65.842134.2 0.000 1.40--cOR –Crude odds ratio.*- Reference group.†- Scores of 0–7 (normal).‡ Scores of 8 (mild, moderate, severe, extremely severe).--1.181.66
Kaur et al. BMC Family Practice 2013, age 8 of 13Table 4 Frequency distribution of respondents by stressstatus and socio-demographic characteristics and otherselected variablesVariablesStress symptomsPcORNo (%) Yes (%)(n) †(n) ‡Age (Years)95% CILower Upper0.33630 – 39*133 84.22515.840 - 49408 88.55311.5 0.159 0.691--Table 4 Frequency distribution of respondents by stressstatus and socio-demographic characteristics and otherselected variables (Continued)AbdominalObesityNo*475 88.06512.0Yes1719 87.324912.7 0.70--0.4131.156Sr. Cholesterollevel (mmol/l)---0.791.4250 - 59784 88.210511.8 0.160 0.7130.4441.144 5.2*1545 87.422212.660 – 69627 86.110113.9 0.525 0.8570.5321.380 5.2649 87.69212.4 0.919 0.9970 - 79214 89.92410.1 0.092 0.5970.3271.088 8028617.6 0.793 1.1400.4283.037HbA1clevel (%)82.4SexMale*870 89.210510.8Female1324 86.420913.6 0.035 1.311135 88.514711.5EthnicityMalay*--- 8.5*1376 89.516110.5 8.5817 84.215315.8 0.000 1.60--- 2182 88.32411.72012 87.429012.6 0.694 0.915387 88.45111.6 0.920 1.020.731.43 2*11614.7 0.030 1.341.031.73Co-morbidity0.219477 90.05310.01717 86.826113.2 0.049 1.372179 87.730512.3253 88.83211.2 0.484 1.2110.7092.068824 87.511812.5 0.155 1.3710.8882.116Psychiatricillness infamilySecondaryeducation849 86.213613.8 0.051 1.5330.9982.355No*Tertiaryeducation*268 *NoneMonthlyhouseholdincome (MHI)in MalaysianRinggit (MYR)---37.5 0.001 4.28No*594 89.96710.1Yes1600 86.624713.4 0.031 1.37-- 1,000600 85.210414.8 0.051 1.4191.002.021,000 - 3,0001152 88.115611.9 0.539 1.1080.801.54No*1227 89.414610.6--Yes967 85.216814.8 0.002 1.46442 89.15410.9Marital StatusNever married--Smoking status0.5736287.3Divorced/widowed/separated1798 87.8Married *334 abetes infamilyLife eventswithin thepast 6 months 3,000*0.76Duration ofDiabetes(years)671 85.3--1.68Asian --1.041.82--1.151.850.836912.7 0.906 1.040.512.13Non smoker*1824 87.326512.7--25012.2 0.292 1.180.871.62Former smoker142 88.81811.2 0.743 0.940.631.39Current smoker228 88.03112.0 0.598 0.870.531.
as the third leading cause in both males (6.0%) and fe-males (7.2%) respectively, while unipolar major depres-sion was ranked as second and top most leading cause in males (7.2%) and females (12.7%) respectively [4]. It is well recognized that many individuals with chronic illnesses also have co-morbid unrecognized mental health disorders [5].