Transcription
Munich Personal RePEc ArchiveForex Trading and the WMR FixEvans, MartinDepartment of Economics, Georgetown University27 August 2014Online at https://mpra.ub.uni-muenchen.de/60171/MPRA Paper No. 60171, posted 25 Nov 2014 15:01 UTC
Forex Trading and the WMR FixMartin D.D. Evans November 2014Second DraftAbstractSince 2013 regulators have been investigating the activities of some of the world’s largest banks aroundthe setting of daily benchmarks for forex prices. These benchmarks are a key linchpin of world financialmarkets, providing standardize prices used to value global equity and bond portfolios, to hedge currencyexposure, and to write and execute derivatives’ contracts. The most important of these benchmarks,called the “London 4pm Fix”, “the WMR Fix” or just the “Fix”, is published by the WM Companyand Reuters based on forex trading around 4:00 pm GMT. This paper undertakes a detailed empiricalanalysis of the how forex rates behave around the Fix drawing on a decade of tick-by-tick data for 21currency pairs. The analysis reveals that the behavior of spot rates in the minutes immediately beforeand after 4:00 pm are quite unlike that observed at other times. Pre- and post-Fix changes in spotrates are extraordinarily volatile and exhibit strong negative serial correlation, particularly on the lasttrading day of each month. These statistical features appear pervasive, they are present across all 21currency pairs throughout the decade. However, they are also inconsistent with the predictions of existingmicrostructure models of competitive forex trading.Keywords: Forex Trading, Order Flows, Forex Price Fixes, Microstructure Trading ModelsJEL Codes: F3; F4; G1.* Georgetown University, Department of Economics, Washington DC 20057 and NBER. Tel: (202) 687-1570 email:evansm1@georgetown.edu. Disclosure: The research reported here only uses publicly available data and wasundertaken independently without compensation. I do, however, have an ongoing consulting relationship with a lawfirm involved in litigation related to the WRM Fix.1
IntroductionIn the summer of 2013 the financial press reported the existence of numerous regulatory investigations intothe foreign currency (forex) trading activities of some of the world’s largest banks. These on-going investigations by the European Commission, Switzerland’s markets regulator Finma and the country’s competitionauthority Weko, the UK’s Financial Services Authority, the Department of Justice in the US, the Hong KongMonetary Authority and the Australian Securities and Investment Commission, among others, center on theactions of the banks’ forex traders around the time that benchmark currency prices are determined. Themost widely used benchmarks are provided by the WM Company and Reuters, based on forex transactionsaround 4:00 pm GMT. These benchmarks are colloquially known as the “London 4pm Fix”, “the WMRFix” or just the “Fix”. In June 2013 Bloomberg News reported that some forex traders at the world’slargest banks had been allegedly colluding in an attempt to manipulate the Fixes, and that regulators wereinvestigating the matter. Since then, very little information concerning the investigations has been madepublic.1Benchmark interest rates and forex prices, like LIBOR and the Fix, are key linchpins of the world’sfinancial markets. In particular, the Fix provide standardize currency prices that are used to value globalequity and bond portfolios, to (dynamically) hedge currency exposure, to write and execute derivativescontracts, and administer custodial agreements. In light of this, the fact that so many financial regulatorsare investigating forex trading around the Fix suggests that the allegations of collusion are credible. What ismuch less clear is whether collusion, if indeed it took place, could have materially affected the determinationof the Fix to the detriment of participants in the forex and other financial markets. This paper presentsstatistical evidence pertinent to this issue. In particular, I used a decade’s worth of tick-by-tick data from 21currency paris to study the behavior of the forex prices around the Fix. To be clear, this analysis does notprovide any direct evidence on the allegations of the collusion being investigated by regulators. Instead itdocuments a set of facts about the behavior of forex prices around the Fix which may be juxtaposed againstmodels of forex trading.The sine qua non of the Fix is that it provides an accurate measure of the prices (i.e., spot rates) atwhich currency pairs trade around a specified time (4:00 pm GMT)2 . This is true in the narrow sense thateach Fix is computed from transaction prices in a currency pair during a 60 second window around 4:00pm. But, interpreted more broadly, it is not the case. The central finding of my analysis is that the Fixbenchmarks are very unrepresentative of the prices at which currency pairs trade in the hour or so around4:00 pm. This finding holds true in all 21 currency pairs I examine (including the major currency pairs: e.g.USD/EUR, CHF/USD, USD/GBP and JPY/USD), and for every year between 2004 and 2013. It is alsoparticular striking on the last trading day of every month. Initial news reports concerning the allegationsof collusive behavior of banks’ forex traders around the Fix showed instances where the prices from forextrades immediately around 4:00 pm looked very different from the prices several minutes earlier or later.My analysis shows that these examples of price movements around the Fix are far from unusual. On thecontrary, they have been commonplace throughout the span of my data.1 There have been several news stories reporting the dismissal of forex traders from major banks, but the reasons behindthese dismissals - particularly with respect to the regulators’ investigations - were not disclosed.2 Hereafter, all times refer to GMT.2
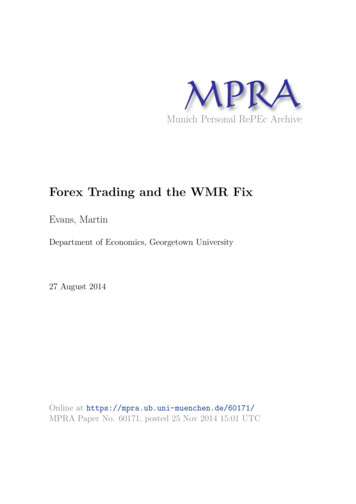
My main findings are most easily summarized with the aid of a plot. Figure 1 shows the average pathsfor the USD/GBP spot rate during the 15 minutes before and 30 minutes after the 4:00 pm.3 The solidlines plot the average level of spot rates measured in basis points relative to their level at 3:45 pm from allend-of-month trading days between the start of 2004 and end of 2013. The dashed lines depict the analogousplots from all other (i.e. intra-month) trading days. The upper branch of the solid and dashed plots showsthe average spot rate level on those days when rates rose in the 15 minutes before the Fix, the lower branchshows the level when rates fell.Figure 1: USD/GBP Spot Rate Profiles Around the Fix20151050 5 10 15 20 1501530Notes: Solid lines plot the average path for the USD/GBP from 15 minutes before to 30minutes after the 4:00 pm GMT from all end-of-month trading days between the startof 2003 and end 2013. The dashed lines plot the average path over the same intervalon all other (intra-month) trading days. Paths are plotted in basis points relative to theUSD/GBP rate at 3:45 pm GMT.Several features of the plots in Figure 1 are representative of my main findings. The first concerns thedifference between the level of the Fix and the prior level of spot rates. Figure 1 shows that relative tothe 3:45 level, this difference is roughly 15 basis points on average at the end-of-the month, and 7 basispoints on intra-month days. I refer to these differences as the pre-fix rate changes. My analysis showsthat rate changes of these magnitude are very rare in normal trading. I use the eleven year span of thetick-by-tick data to construct precise estimates of the distribution of rate changes that arise in forex tradingaway from significant (recurrent) events, such as the Fix and the scheduled release of macro data. Theseestimated distributions summarize the behavior spot rates under “normal” trading conditions, and can be3 Hereafter I use the term “spot rate” when referring to the price at which a particular currency pair trades. The USD/GBPspot rates plotted here are computed from the mid-point of the bid and offer rates, see Section 2 for details.3
used to calibrate the rate changes we observe in the minutes leading up the Fix. This calibration exercisereveals that the pre-fix rate changes routinely seen at the end of each month fall in the extreme tails ofthe rate-change distribution based on normal forex trading. For example, in the case of the USD/GBP, thechange in rates between 3:45 and 4:00 at the end of each month appear in 95th percentile of the rate-changedistribution six times more frequently than we see under normal trading conditions. This pattern appliesacross all the currency pairs, and across horizons ranging from one hour to one minute before the Fix. It isalso evident, to a lesser degree, in the intra-month data. As Figure 1 shows, intra-month pre-fix rate changesare on average smaller than their end-of-month counterparts, but they still appear in the 95th. percentileof the rate-change distribution four times more frequently than in normal trading. In sum, the movementsin spot rates leading up to the 4:00 pm Fix are extraordinarily volatile across all time periods and currencypairs.My second main finding concerns the relation between spot rates leading up to 4:00 pm, the Fix benchmark, and rates after 4:00 pm. The plots in Figure 1 show that the average path for the USD/GBP spotrate at the end of the month slope in opposite directions either side of (a point close to) the 4:00 pm Fix.In other words there are partial reversals in rate changes around the Fix: on average rates tend to fall afterrising towards the Fix, and rise after falling towards the Fix. These reversals are larger in end-of-monththan intra month data (as shown in Figure 1) and are present in the rate-dynamics of all 21 currenciesstudied. Like the pre-fix rate changes, unusually large post-fix changes (i.e., rate changes from the Fix goingforward) regularly occur at the end of each month. In the 15 minutes following the Fix they appear in the95th percentile of the rate-change distribution at two to four times the rate we see under normal tradingconditions. Statistically, reversals show up as negative correlations between pre-fix and post-fix rate changes.I find evidence of large statistically significant negative correlations for most currency pairs in end-of-monthdata over horizons ranging from one to 15 minutes. These findings stand in sharp contrast to the very smalldegree of serial correlation in the rate changes generated by normal forex trading.The statistical evidence overwhelming indicates that for all currency pairs the behavior of spot ratesaround the Fix is very unusual. These findings have several important implications. First, they underminethe notion that the Fix benchmark provides a snapshot of the spot rates (forex prices) associated withnormal trading activity during the day. This notion is implicit in the widespread use of the Fix as the “dailyspot rate”. In reality, however, the daily range for spot rates is similar in size to the time series changesin Fix benchmarks over months, quarters and longer. Moreover, Fix benchmarks generally fall towards theextremes of the daily range for spot rates. Together, these findings imply that the forex returns computedfrom the Fix benchmarks often materially differ from the returns on forex positions that were initiatedand/or closed at times away from 4:00 pm on the same days. This means that the returns routinely studiedin the international finance literature (computed from the Fix benchmarks) are at best noisy estimates ofthe returns achieved by actual investors.My statistical findings also present a challenge to theories of trading behavior around the Fix. As Section1 explains, there are particular institutional factors that weigh on the trading decisions of market participantsaround the Fix that are not present at other times during the trading day. These factors figure prominentlyin the anecdotal accounts of forex trading around the Fix reported in the financial press, but it is unclearwhether such trading can account for the unusual behavior of spot rates we observe. Similarly, existing4
microstructure models of the forex trading are silent on whether the unusual statistical characteristics ofspot rates around the Fix can arise in an equilibrium when these institutional factors are present.Currency trading around the WMR Fix has not been the focus of academic research, with the notableexception of Melvin and Prins (2011). They describe how currency hedging by portfolio managers generateforex trading around the Fix. Their empirical analysis focuses on the links between forex and equity returnsin the G10 currencies between 1996 and 2009, particularly the effects of equity returns on forex volatilityaround the Fix. This paper provides a more detailed examination of the behavior of spot rates round theFix across a wider rage of currency pairs that compliments the analysis in Melvin and Prins (2011).The remainder of the paper is structured as follows. Section 1 describes the institutional details of theWMR Fix and discusses the implications of existing theoretical trading models for the behavior of spotrates around the Fix. Section 2 describes the data. My empirical analysis begins in Sections 3 and 4. HereI examine how the Fix benchmarks relate to the daily variations in spot rates, and document how ratesbehave under normal trading conditions. Sections 5 and 6, in turn, examine the behavior of spot rates inthe minutes before and after 4:00 pm. Finally, in Section 7, I examine the trading implications of the spotrate reversals around the Fix. This analysis places an economic perspective on my statistical findings, andprovides indirect evidence on the degree of competition in forex trading around the Fix. Section 8 concludes.1Background1.1Institutional BackgroundThe WMR Fix was established as a key financial benchmark at the end of 1993. Morgan Stanley CapitalInternational (MSCI) announced that from December 31st 1993 onwards it would use the benchmark forexprices compiled at 4:00 pm GMT by the WM Company and Reuters to value the foreign security positionsin its MSCI equity indices4 – indices widely used track the performance international equity portfolios.Since then, the Fixes have been incorporated into numerous other tracking indices5 and derivatives6 . WRMFixes are the de facto standard for construction of indices comprising international securities. They are alsoroutinely used to compute the returns on portfolios that contain foreign currency denominated securitiesas well as the value of foreign securities held in custodial accounts. WMR Fixes are now computed everyhalf-hour for 21 currency pairs and hourly for 160 currency pairs, but the 4:00 pm Fix remains the singlemost important benchmark forex price each day. My analysis focuses exclusively this particular benchmark.Although forex markets operate continuously, trading activity is heavily concentrated around Europeanbusiness hours for most currency pairs (exceptions include Asian currencies where trading is concentratedearlier in the day). Thus the 4:00 pm Fix occurs towards the end of the daily window where there are a largenumber of potential counterparties available to participate in forex trades for major currency pairs. This isan important feature of the Fix. Market participants wanting to trade in the minutes following the Fix will4 Initially, the Fix benchmarks were used to compute the MSCI indices for all but the Latin American countries. After 2000they were used for all the country indices.5 Recent examples include: Dow Jones Islamic Market, Global Real Estate (FTSE EPRA/NAREIT) and Global Coal (NASDAQ OMX) indices.6 See, for example, the USD volatility warrants issued by Goldman Sacks; Wiener Borse AG fInancial futures and CME spot,forward and swaps.5
face spreads between bid and offer rates offered by potential counterparties that are comparable to spreadsearlier in the day, but in the next hour or so (with exact timing depending on the particular currency pair)spreads widen as the number of counterparties shrinks. Generally speaking, forex trading becomes increasingcostly (in terms of spreads) as one moves later into the day past the 4:00 pm Fix.The Fix is computed over a one minute window that starts 30 seconds before 4:00 pm. The methodologyis described on the WMR website (http://www.wmcompany.com) as follows:Over a one-minute Fix period, bid and offer order rates from the order matching systems andactual trades executed are captured every second from 30 seconds before to 30 seconds after thetime of the Fix. Trading occurs in milliseconds on the trading platforms and therefore not everytrade or order is captured, just a sample. Trades are identified as a bid or offer and a spread isapplied to calculate the opposite bid or offer.Using valid rates over the Fix period, the median bid and offer are calculated independentlyand then the mid rate is calculated from these median bid and offer rates, resulting in a midtrade rate and a mid order rate. A spread is then applied to calculate a new trade rate bid andoffer and a new order rate bid and offer. Subject to a minimum number of valid trades beingcaptured over the Fix period, these new trade rates are used for the Fix; if there are insufficienttrade rates, the new order rates are used for the Fix.Two aspects of this methodology are noteworthy. The first concerns the source of the bid and offer forexrates. The electronic trading platforms run by Reuters and Electronic Broking Services (EBS) (now owned byICAP) are the main trading venues for dealer-banks in the forex market. EBS is the primary trading venue forEUR/USD, USD/JPY, EUR/JPY, USD/CHF and EUR/CHF, and Reuters Matching is the primary tradingvenue for commonwealth (AUD/USD, NZD/USD, USD/CAD) and emerging market currency pairs.7 TheWMR Fix uses either platform as the primary data source depending on the currency pair, and rates fromCurrenex as a secondary source for validation. In recent years forex trading platforms have proliferatedso that a wider array of (tradable) bid and offer rates are available to market participants than just thosesourced by the Fix methodology. Thus the Fix should be viewed as a benchmark computed from a subsetrather than the universe of forex rates available in the one minute window around 4:00 pm.The second aspect concerns the computation of the trade benchmark. A careful reading of the methodology reveals that no account is taken of trading volume. This means that the transaction price recorded asthe result of the submission of a market order to buy or sell forex valued at 20 million USD has exactly thesame weight in computing the benchmark as an order valued at 200 million USD. Moreover, the methodologytakes no account of order flow (i.e., the difference between the value of market orders to buy forex and sellforex within a time interval). Order flow during the one minute Fix window may be strongly positive ornegative, but this fact will not be reflected in the Fix benchmark (provided there are enough buy and sellmarket orders to compute the median bid and offer trade rates).The existence of the 4:00 pm Fix per se would not be of any great significance were it not for the factthat market participants face strong economic incentives to trade forex in and around the Fix window. It7 Throughout, I use market abbreviations for currencies: e.g., U.S. Dollar (USD), Euro (EUR), Swiss Franc (CHF), JapaneseYen (JPY), British Pound (GBP), Australian Dollar (AUD), Canadian Dollar (CAD) and New Zealand Dollar (NZD). I alsofollow market conventions when quoting spot rates in direct or indirect form, e.g. EUR/USD rather than USD/EUR.6
is hard to overstate the importance of this point. If the Fix were calculated every day according to themethodology described above and archived as a data series, its existence would have no economic relevancefor the behavior of the forex market. Fixes would simply be snap shot measures of forex rates around 4:00pm that could be useful for research. One could argue about whether the methodology could be improved,but these would be arguments about measurement rather than arguments about how the existence of theFix affected actual market activity. Of course, in reality, the Fixes aren’t simply archived. Instead they areused in real time to value other securities, such as equity portfolios and derivatives. Market participants facestrong incentives to trade in and around the Fix precisely because the Fixes are used for real-time valuationpurposes.The trading incentives created by the existence of the Fix originate with two groups of market participants.The first comprises investors wishing to hedge some of the currency risk associated with their holdings. AsMelvin and Prins (2011) stress, fund managers with cross-boarder equity investments are important membersof this group. Because the performance of their investments are often tracked against the returns on theMSCI indices that use the Fix, many managers will want to reduce the tracking error of their own portfoliosby choosing to hedge some of their (forex) exposure to the Fix. In principle this hedging could take placecontinuously through the adjustment of forex forward positions, but in practice most managers adjust theircurrency hedge positions once a month, usually on the last trading day of the month. This hedging activityproduces orders to purchase or sell forex. And, since the managers are concerned with tracking the MSCIindices, they want their forex orders to be filled at the Fix to minimize the tracking error in their ownportfolio’s performance.As a concrete example, suppose the UK based mutual fund manager holds part of his portfolio in USequities. At the end of last month the US position had a value of 1 billion USD. The manager also maintainsa 50 percent forex hedge ratio against this position, which was short 500 million USD at the end of lastmonth. Now suppose that the value of the US equity portfolio rises by five percent during the current monthto a value of 1050 million USD on the day prior to the end of the month. In this situation, the managerwould want to increase his short USD position by 25 million, so on the last day of the month he wouldplace an order to sell 25 million USD with a dealer-bank. This order could be submitted as a standardforex order, to be filled immediately by the dealer-bank at the best bid rate for the USD/GBP prevailing inthe market (say on Reuters Matching). Alternatively, the manager could submit a “fill-at-fix” forex order,which specifies that the order to sell 25 million USD should be filled at the Fix benchmark rate establishedat 4:00 pm.8 By market convention, fill-at-fix orders must be submitted to dealer-banks before the 3:45pm. Consequently, the submitter of such an order faces a good deal more uncertainty about the exact rateat which the order will be filled than with a standard forex order.9 Nevertheless, a fill-at-fix order will bepreferable to the fund manager because it guarantees that the GBP value of the adjusted hedge portfoliomatches 50 percent of the equity position valued in GBP at the new USD/GBP Fix benchmark.This example illustrates how the use of the Fix in valuing equity portfolios combines with the desire offund managers to (partially) hedge forex risk to produce fill-at-fix forex orders leading up to the Fix. The8 The actual rate received by the manager will also include a spread adjustment to the Fix benchmark depending on whetherthe order was to buy or sell foreign currency. The fill-at-fix contract may specify the spread reported by WMR or one set bythe dealer-bank.9 As we shall see, the volatility of spot rates between 3:45 and 4:00 pm is several orders of magnitude higher than the volatilityof rates during the (fraction of) seconds between the submission and filling of a standard forex order.7
use of the Fix benchmarks in derivative contracts produces a similar incentive to submit fill-at-fix ordersfrom other investors wishing to partially hedge their derivative positions. Thus, the existence of the Fixesand their use in real-time valuation produces a hedging incentive for the submission of fill-at-fix orders before3:45 pm. These incentives are particularly strong at the end of the month.The second group of market participants affected by the Fix are the dealer-banks that accept fill-at-fixforex orders. As noted above, fill-at-fix orders differ from standard forex orders because the dealer-banksagree to fill them at the Fix benchmark rate at least 15 minutes before that rate is determined. Thus,in effect, the dealer-banks are offering a guarantee that the order will be filled at particular point in timewhatever the prevailing rates (as represented by the Fix) might be.10 By contrast, in accepting a standardforex order the dealer-bank undertakes to fill the order immediately at the best available prevailing rate.11Of course, such guarantees represent a source of risk to the dealer-bank. Generally speaking, it is the desireto manage this risk that creates incentives for dealer-banks to trade in and around the Fix.To understand these risk, consider the position of a dealer-bank that by 3:45 pm has on net fill-at-fixorders to purchase 200 million GBP in the USD/GBP market. Broadly speaking, there are three strategiesavailable to the dealer-bank. The first is simply to fill the fill-at-fix orders immediately at the prevailingmarket rate. This strategy runs the obvious risk that the Fix benchmark will be established at a significantlydifferent level than current rates. In this particular example, the dealer risks a fall in the USD/GBP ratebetween 3:45 and 4:00 pm, which would produce a (USD) trading loss because the 200 million GBP purchasedat 3:45 would be sold on to the bank’s fill-at-fix customers at a lower USD price established by the Fix. Thesecond strategy is to purchase the 200 million GBP at a rate as close as possible to the Fix benchmark. Thisinvolves trading within the one minute Fix window, and even then, there is no guarantee that the actual rateat which the GBP purchase is made exactly matches the Fix benchmark (because the latter is an averageof rates during the Fix window). The third strategy has two prongs: (i) purchase the 200 million GBPincrementally between 3:45 and 4:00 and (ii) take a speculative position in anticipation of a change in ratesbetween 3:45 and 4:00. The first prong reduces the risk from a fall in the USD/GBP rate relative to thefirst strategy, but it cannot eliminate the risk entirely. Goal of the second prong is produce a trading profitthat will cover the remaining slippage between the Fix benchmark and the (effective) rate at which the 200million GBP were purchased.Several aspects of the third trading strategy are particularly noteworthy. First, the strategy necessitatestrades to establish and close out the speculative position in addition to the trades necessary to fill thefill-at-fix order. Consequently, there would be greater trading volume around the Fix if many dealer-banksfollow this strategy than is necessary to simply process the fill-at-fix orders across the market. Second, thestrategy requires an inclination on the part of dealer-banks to take speculative positions. Generally speaking,dealer-banks will be more willing to take such positions the more representative they believe their fill-at-fixorders are relative to others across the market. For if their orders are indeed representative, they provideinformation on the aggregate order flow that must be processed by the market between 3:45 and 4:00 pm.Consistent with large body of research, dealer-banks know that order flow is the dominant driver of spot rates(away from scheduled data releases), so they will be willing to take a speculative position to benefit from10 Whilethese are not legally binding guarantees, it is very rare for fill-at-fix orders not to filled at the Fix benchmark rate.could also accept a limit order where price-contingency replaces the immediacy feature of the forex order.11 Dealer-bank8
the anticipated impact of order flow on future rates. Under these circumstances, the trades used by dealersto initiate their speculative positions will be in the same direction as the trades they use to incrementallyfill the fill-at-fix orders – a trading pattern referred to as “front running”.In sum, the economic relevance of the Fix arises from the fact that it is used in real-time valuation. This,in turn, creates incentives for atypical forex trading activity around the 4:00 pm. There is a strong hedgingincentive for fund managers and derivative investors to submit fill-at-fix forex orders to dealer-banks before3:45 pm, particularly at the end of the month. And, once these atypical forex orders are received, there arestrong incentives for dealer-banks to trade in a way that mitigates the risk inherent in filling the orders.The key challenge in examining the behavior of the forex market around the Fix is understanding how thistrading activity is reflected in the behavior of spot rates.1.2Theoretical BackgroundThe institutional features described above do not, in and of themselves, provide an explanation for thebehavior of spot rates around the Fix. The submission of fill-at-fix forex orders before 3:45 pm and theirimplications for risk-mitigating trades by dealer-banks do not comprise a trading theory that can accountfor the volatility and negative serial correlation in spot rate changes around the Fix found in the data. Whatwe require, instead, is an understanding of how the decisions by all market participants (i.e., dealer-banksand others) give rise, in aggregate, to the unusual behavior of spot rates we observe. In short, we need amodel of forex trading that incorporates the institutional features described above and delivers equilibriumspot rates with the same statistical characteristics as we find in the data.The Portfolio Shifts (PS
Forex Trading and the WMR Fix Evans, Martin Department of Economics, Georgetown University 27 August 2014 Online at https://mpra.ub.uni-muenchen.de/60171/ . analysis of the how forex rates behave around the Fix drawing on a decade of tick-by-tick data for 21 currency pairs. The analysis reveals that the behavior of spot rates in the minutes .