Transcription
CHAPTER 10NPHYLOGENETIC APPROACHESFOR RESEARCH IN COMPARATIVECOGNITIONUNCORRECTEDPROOFS AMERICAYCHOLOGICALbe treated as independent observations in statistical analyses because of patterns of inheritance on abifurcating phylogeny (Felsenstein, 1985; Martins &Garland, 1991). To deal with this nonindependence,comparative biologists incorporate informationabout the evolutionary relationships between species.Phylogenetic comparative methods are a set of statistical approaches designed for exactly this purpose(Garamszegi, 2014; Garland, Bennett, & Rezende,2005; Nunn, 2011; Rezende & Diniz-Filho, 2012),a toolkit that is becoming increasingly useful in thefield of comparative psychology. In addition to beingapplied in a broader range of evolutionary contexts,comparative methods themselves are evolving, andmany classical techniques are rapidly being replacedby newer and more flexible approaches.In this chapter, we introduce the reader to arange of phylogenetic comparative methods thatcan be used to address fundamental questions incomparative psychology, including some recentmethodological advances that will create powerfulopportunities for future research. We illustrate thesemethods by using a combination of simulated dataand analyses of published datasets. Given the rapidgrowth of research on comparative cognition, wehighlight the utility of comparative methods for thestudy of cognitive evolution. However, the conceptsand statistical approaches described in this chaptercan be similarly applied in other areas of comparative psychology.At the outset, we want to emphasize thatsome traits are measured on a quasi-continuousscale (e.g., percentage of correct responses on anPSNComparative studies have the potential to addressa wide range of questions about how, when, andwhy different traits have evolved. The comparative approach refers to studies in which variation intraits of different species (or different populations)is used to test specific hypotheses or to generate newhypotheses about evolutionary phenomena. In manycases, comparative methods are used to investigatehow two or more traits covary. Comparative methods are also used to reconstruct evolutionary historyor to assess how traits influence patterns of diversification (speciation and extinction; Nunn, 2011).In the context of comparative psychology, thesemethods have been used, for example, to investigateassociations between aspects of neuroanatomy andexecutive function (MacLean et al., 2014; Shultz &Dunbar, 2010; see also Chapter 24, this volume),to explore how life history traits influence temporaldecision making (Stevens, 2014; see also Volume 2,Chapter 24, this handbook), and to make inferencesabout how life in complex societies has shaped primate cognitive evolution (Amici, Aureli, & Call,2008; Burkart et al., 2014; MacLean et al., 2013; seealso Chapters 12 and 13, this volume).Understanding evolutionary relationships—orphylogeny—among the species of interest is criticalfor effective inference in comparative research. In avery real sense, phylogeny is the scaffolding on whichone investigates evolutionary change in traits and thefactors that lead to these changes. This is importantconceptually, and it is also critically relevant in statistical analyses. For example, in the context of studyinghow traits covary, data on different species cannotASSOCIATIOEvan L. MacLean and Charles L. Nunnhttp://dx.doi.org/10.1037/XXXXX-XXXAPA Handbook of Comparative Psychology: Vol. 1. Basic Concepts, Methods, Neural Substrate, and Behavior, J. Call (Editor-in-Chief)Copyright 2017 by the American Psychological Association. All rights reserved.BK-APA-HCM V1-160213-Chp10.indd 1104/07/16 6:13 PM
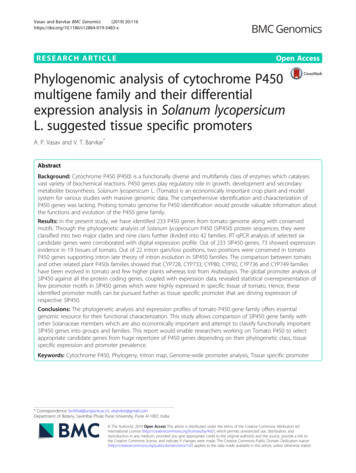
MacLean and Nunnexperimental task), and other traits are measuredon a discrete scale (e.g., presence or absence of mirror self-recognition). These two types of data oftenrequire different statistical approaches. For brevity,we present a single variant of each method below,yet we also direct the reader to relevant literature onother approaches throughout and to several recentreviews (Garamszegi, 2014; Garland et al., 2005;Nunn, 2011; Rezende & Diniz-Filho, 2012). Webegin with a brief introduction to additional keyterms and concepts that are foundational to all phylogenetic comparative methods.PHYLOGENETIC TREESCIATIONAs just noted, phylogenies represent the evolutionaryrelationships between taxa and are frequentlyvisualized as trees with a branching pattern (seeFigure 10.1A). Phylogenetic trees consist of nodes andbranches. Nodes indicate speciation events where 0111432G00111342H00111224OOPREUNCORRECTEDFMAC AB(B)ERDFSAICANPSYCHOLOGICALASSO(A)FIGURE 10.1. A phylogenetic tree and variance–covariance matrixrepresenting the evolutionary relationships between species. A: The rootof the tree is at the bottom with the tips (terminal branches) extending upward. Uppercase letters refer to extent taxa at the tips of the tree.Nodes are indicated by lowercase letters enclosed in circles, and branchlengths are shown to the left of each branch in the tree. The scale barindicates 1 million years (MY). B: The variance–covariance matrix represents the total age of the phylogeny along the diagonal, with the extentof shared evolutionary history between pairs of species indicated on theoff-diagonals.2BK-APA-HCM V1-160213-Chp10.indd 204/07/16 6:13 PM
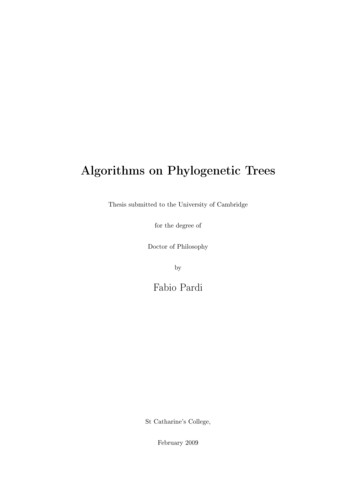
Phylogenetic Approaches for Research in Comparative CognitionPHYLOGENETIC SIGNALUNCORRECTEDPROOFS AMERICAYCHOLOGICALASSOCIATIONAs a result of shared evolutionary history, closelyrelated species tend to resemble one another more sothan less closely related taxa; this tendency is termedphylogenetic signal (Blomberg & Garland, 2002;Blomberg, Garland, & Ives, 2003). Interestingly, theextent to which traits are associated with phylogenyvaries widely from one trait to another, with morphological traits tending to exhibit higher levels of phylogenetic signal than behavioral, cognitive, or ecologicalvariables (Blomberg et al., 2003; Kamilar & Cooper,2013; MacLean et al., 2012). Quantitative estimatesof phylogenetic signal in continuous traits can beobtained by using a variety of different approaches(for reviews, see Kamilar & Cooper, 2013; Münkemüller et al., 2012; Nunn, 2011). Here we focus onone commonly used metric, Pagel’s lambda (Freckleton et al., 2002; Pagel, 1999a).Lambda is a continuous parameter that rangesfrom 0 to 1, with a value of 0 indicating that traitcovariances are independent of phylogeny and avalue of 1 indicating that variation among species approximates expectations from a Brownianmotion model of evolution (i.e., a random walk inwhich trait variance accumulates proportionally toevolutionary time). The lambda parameter scalesthe internal branches of a phylogeny by multiplying the internal branch lengths (the off-diagonals inthe variance–covariance matrix) by lambda whileretaining the original variances along the diagonal.Thus, when λ 0, the internal structure of the treeis entirely eliminated (all internal branch lengthsare 0, yielding a “star phylogeny”; see Felsenstein,1985). In contrast, the internal branch lengths (offdiagonals in the variance–covariance matrix) remainunchanged when λ 1. Lambda may take any valuebetween 0 and 1 (and even slightly higher than 1,subject to constraints determined by characteristicsof the tree). The lambda value for a given trait istypically estimated using maximum likelihood tofind the lambda transformation that makes covariances between species most likely under a Brownianmotion model of evolution.To illustrate the concept of lambda and phylogenetic signal, Figure 10.2 shows the values of twoPSNancestral lineage gave rise to two (or more) descendentspecies. Nodes are connected by branches, which aretypically drawn to be proportional to evolutionarytime. Figure 10.1A shows a phylogenetic tree for eightspecies with circles enclosing the internal nodes. Noder is located at the root of the phylogeny and represents the oldest bifurcation in the tree, which in thisexample occurred 4 million years ago. The internalbranches of the tree (i.e., branches connecting nodes,rather than ending at a tip) represent the time thatspecies have shared evolutionary history, whereas theterminal branches (leading to a tip) represent the timethat each extant species has evolved independently ofother taxa in the tree (of course keeping in mind thatthere are often many extinct lineages that are not represented on a phylogeny of extant species; see Nunn,2011).The extent of shared evolutionary historybetween pairs of species in a phylogeny can be represented as a variance–covariance matrix (see Figure10.1B; Cunningham, Omland, & Oakley, 1998;Freckleton, Harvey, & Pagel, 2002). The diagonalof the matrix (gray background) represents the variances, or the total time from the root to the tips ofthe tree (4 million years). The off-diagonals of thematrix represent the covariances, or the amount oftime that pairs of species have shared evolutionaryhistory since the root of the tree. In this example,the covariance between species C and D is 3 million years, reflecting the time between nodes r andd, whereas the covariance between species C andH is 1, reflecting the time between nodes r and b.Variance–covariance matrices play an important rolein many phylogenetic comparative methods; hence,we revisit this concept throughout the chapter.A first step in most comparative analyses is toobtain a phylogeny for the species of interest. Fortunately, digital phylogenies are widely availableand can be downloaded from sites such as 10ktrees(http://10ktrees.fas.harvard.edu; Arnold, Matthews, & Nunn, 2010), TreeBase (http://treebase.org; Sanderson, Donoghue, Piel, & Eriksson, 1994),and the Open Tree of Life (http://blog.opentreeoflife.org). Garamszegi and Gonzalez-Voyer (2014) provided an overview of the steps for obtaining a phylogeny for comparative research.3BK-APA-HCM V1-160213-Chp10.indd 304/07/16 6:13 PM
CIAONPSYCHOLOGICALof lambda for indifference points was 1 (see Volume 2, Chapter 24, this handbook). Similarly, in testsof self-control administered to 36 species, includingprimates, carnivores, rodents, and birds, MacLeanet al. (2014) reported lambda values of 0.76 acrossthe entire sample of species (for the average scoreacross cognitive tasks) and 0.86 within primates.Thus, as with many other traits, phenotypic variationin cognition is not independent of phylogeny.One common misconception about testing forphylogenetic signal in individual traits is that theresults of these analyses determine whether phylogenetic approaches are needed for subsequentanalyses. For example, if none of the individualtraits being studied display phylogenetic signal,researchers may be tempted to use these findingsas a justification to forego additional phylogeneticanalyses. However, as we show in the next section,it is phylogenetic signal not in individual traits butin the error variance of a statistical model that isrelevant in comparative analyses of correlated evolution in two or more traits. Of course, a lack of phylogenetic signal should also lead one to be cautiousabout applying phylogenetic methods to reconstructancestral nodes or to assess how traits influence speciation and extinction rates across the tree.UNCORRECTEDPROOFS AMERICAcontinuous traits that were simulated on a phylogenyto have different levels of phylogenetic signal. Themaximum likelihood estimate of lambda for the graytrait is 0.99, indicating that closely related specieshave highly similar trait values (notice, e.g., that sister species have gray bars of approximately the samemagnitude). In contrast, the maximum likelihoodestimate of lambda for the black trait is 0, indicating that phylogeny is a weak predictor of species-levelvariance (hence, one sees no pattern of sister specieshaving black bars of more similar magnitude, compared with other species on the tree). More important, these branch-length transformations are nota revised estimate of the actual species divergencetimes (the best estimate of which was known beforeanalysis). Instead, the transformation estimates theextent to which phenotypic covariance matches theexpected covariance on the basis of phylogeny anda Brownian motion model of evolution. For tests ofphylogenetic signal in discrete traits, we direct thereader to Maddison and Slatkin (1991), Abouheif(1999), and Fritz and Purvis (2010).Assessing phylogenetic signal is an importantfirst step in comparative analyses because it providesinformation about the extent of nonindependence inthe data. To date, only a few studies have investigatedphylogenetic signal in measures of cognition acrossspecies. Yet the initial findings have suggested thatseveral cognitive measures are characterized by substantial phylogenetic signal relative to behavioral orecological traits. For example, in a comparative analysis of primate data from an intertemporal choice task,Stevens found that the maximum likelihood estimateASSFIGURE 10.2. Two traits (indicated in gray and black) with differing levels ofphylogenetic signal plotted on a phylogeny. The vertical positions of the pointsare proportional to the trait values. The gray trait has strong phylogenetic signal(closely related species have more similar trait values), and the black trait hasweak phylogenetic signal (trait variance is independent of phylogeny).TIONMacLean and Nunn“HOW” AND “WHY” QUESTIONS: TESTINGADAPTIVE HYPOTHESESMany of the most interesting questions about cognitive evolution concern when, how, and why particular aspects of cognition evolved. “When” questions4BK-APA-HCM V1-160213-Chp10.indd 404/07/16 6:13 PM
Phylogenetic Approaches for Research in Comparative CognitionUNCORRECTEDPROOFS AMERICAYCHOLOGICALASSOCIATIONin X or Y alone is insufficient justification for ignoring phylogeny in regression models using these variables (Revell, 2010).Generalized least squares (GLS) is an extension of the general linear model that can accommodate nonindependence in the data, as well asnon-Gaussian error distributions (see Chapter 8,this volume). Phylogenetic generalized least squares(PGLS) is a regression model that is based on theGLS framework (Grafen, 1989; Martins & Hansen,1997; Pagel, 1999a). It is similar to GLS in that itgenerates regression coefficients, confidence intervals, and significance estimates for one or more predictors (which can be continuous or discrete) of acontinuous response variable. PGLS accommodatesthe nonindependence of species-level data by incorporating the variance–covariance matrix (describedabove) into the error term of the model to accountfor covariance in model residuals given the phylogeny and the extent of phylogenetic signal in the data(Symonds & Blomberg, 2014).The flexibility of PGLS lies in its ability to adjustfor statistical nonindependence on the basis of theactual error structure of the data (based on estimating lambda or other scaling parameters). This is acritical difference between PGLS and independentcontrasts, an earlier approach that is used to obtainstatistically independent comparisons within a phylogeny (for a review, see Felsenstein, 1985; Nunn &Barton, 2001). Specifically, independent contrasts are calculated by generating differences—orcontrasts—between pairs of lineages throughoutthe tree. The method assumes that phylogeny accurately predicts the model’s error structure and thusstandardizes contrasts by dividing them by the sumof their branch lengths to control for heteroskedasticity. An alternative is to estimate the extent ofphylogenetic signal in the data and adjust the modelaccordingly (Symonds & Blomberg, 2014). To doso, PGLS is often combined with estimating branchlength transformations (such as Pagel’s lambda) thataccommodate diverse evolutionary models and different levels of phylogenetic nonindependence. Asin the case for estimating phylogenetic signal in asingle trait, maximum likelihood can be used to findthe branch-length transformation that optimizes theerror structure of the residuals in a regression modelPSNoften involve assessing whether a particular character state is ancestral in a clade or evolved independently. These questions embrace Tinbergen’s (1963)question about evolutionary history. “How” questions are typically questions about the proximatemechanisms (Tinbergen, 1963) underlying phenotypic variance. For example, do differences in lifehistory strategies, gene expression in the brain (seeChapter 22, this volume), or the volume of brainregions relate to species differences in cognition (seeChapters 12 and 24, this volume)? “Why” questionsare typically questions about the selective pressuresthat have favored cognitive evolution. For example,does living in complex societies, relying on spatiotemporally distributed resources, or facing high levels of niche competition favor particular cognitiveadaptations?One of the most powerful approaches for investigating how and why questions involves tests ofcorrelated evolution. In brief, the rationale for suchtests is that correlations between traits across phylogeny suggest that these traits may be functionally linked (Harvey & Purvis, 1991; Nunn, 2011;Nunn & Barton, 2001). However, as we discoveredin our review of phylogenetic signal, the nonindependence of species-level data is an important consideration when testing such hypotheses becausemany traits are correlated at the species levelthrough inheritance from a common ancestor, notindependent evolutionary origins.General linear models provide a unified statistical framework for predicting a continuous dependent measure as a function of an intercept and alinear combination of predictor variables weightedby regression coefficients (see Chapter 8, this volume). General linear models assume that errors(model residuals) are normally and independentlydistributed with common variance (homoscedasticity). Comparative data frequently violate thisassumption because the residuals of closely relatedspecies tend to be more similar than those of moredistantly related species, and thus errors are notindependently distributed (i.e., they exhibit phylogenetic signal). More important, this scenario canarise even in cases when neither the predictor northe response variable has high levels of phylogeneticsignal, and thus the absence of phylogenetic signal5BK-APA-HCM V1-160213-Chp10.indd 504/07/16 6:13 PM
MacLean and NunnNPSYCHOLOGICALASSOCIATIONassociation exists between X and Y, as shown inthe clade-specific dashed regression lines. Betweenclades, however, grade shifts occur in both X andY. When treating species as independent datapoints (i.e., when lambda is forced to equal 0), GLSstrongly overestimates the relationship between Xand Y (gray regression line; R2 .74, p .001). Incontrast, PGLS accounts for the nonindependencein the model and correctly fails to reject the nullhypothesis (λ 0.72, R2 .05, p .07).Figure 10.3B shows a different situation in whichPGLS again leads one to a correct interpretation ofscaling relationships. In this case, there is a gradeshift in X but not in Y, which when analyzed byGLS (gray regression line) obscures the strong relationships between X and Y within each of the threeclades (dashed regression lines). In this case, GLSfails to detect the correlation between X and Y (R2 .05, p .10), whereas PGLS has increased power todo so (λ 0.84, R2 .60, p .001).As noted previously, PGLS can accommodateboth continuous and discrete predictors of a continuous response variable, but it is inappropriate to usePGLS for a discrete response variable (i.e., logisticregression). For a review of methods appropriate forcategorical response variables, we direct the readerto Ives and Garland (2014).AMERICA(Revell, 2010). When lambda is estimated to be 1,the results of the PGLS model will be identical tothose from independent contrasts, and when lambdais estimated to be 0, PGLS results will mirror thosefrom a general linear model (or GLS with a Gaussian distribution) that does not include phylogeny.However, in many cases the maximum likelihoodestimate of lambda will lie intermediate to these twoextremes.A common misconception about phylogeneticmodels is that they are more conservative than nonphylogenetic approaches and thus guard only againstType I statistical errors (see Chapter 8, this volume).However, by meeting the assumptions of the underlying statistical model, phylogenetic approaches notonly reduce false positives by correcting for pseudoreplication but also have increased power to detectcorrelated evolution in cases in which a generallinear model does not do so (Type II errors). Both ofthese scenarios are illustrated in hypothetical examples exploring the relationship between an ecologicalpredictor and a cognitive dependent measure inFigure 10.3. Figure 10.3A depicts the classic problem of pseudoreplication (see Felsenstein, 1985).Data from three clades (monophyletic groups) areshown, with clade membership indicated by theshading of points. Within each clade, no significant(B)Cognitive MeasureOOPREcological PredictorEcological PredictorUNCORRECTEDCognitive MeasureFS (A)FIGURE 10.3. Examples of scenarios in which phylogenetic generalizedleast squares avoids Type I (A) and Type II (B) statistical errors. Clade membership is represented by the color of points. The solid gray regression line isfrom a nonphylogenetic model that fails to account for the nonindependenceof species-level data. The dashed black lines show the clade-specific associations between the ecological predictor and cognitive dependent measure. Seetext for details.6BK-APA-HCM V1-160213-Chp10.indd 604/07/16 6:13 PM
Phylogenetic Approaches for Research in Comparative CognitionNCORRECTEDPROOFS AMERICAU“WHEN” QUESTIONS: RECONSTRUCTINGTHE COGNITIVE PASTComparative psychologists study the behavior andcognition of extant species, yet many questions incomparative psychology involve inferences aboutthe past. For example, did the last common ancestorYCHOLOGICALASSOCIATIONof humans and great apes have a theory of mind?When, and how many times, has social learningevolved? Do vertebrate species share a primitivenumber sense?The answers to these types of questions relyon the ability to make inferences about the pastusing information from the present and thus capture the when questions identified above. Severalcomparative methods are designed for ancestralstate reconstructions. Here, we focus on maximumlikelihood approaches for inferences about discretetraits, although similar methods can be used withcontinuous variables (for review, see MacLean et al.,2012). Maximum likelihood methods differ fromparsimony reconstructions in a number of important ways (Pagel, 1999b). Reconstructions basedon parsimony attempt to minimize the number oftransitions on the tree, and they ignore informationabout branch lengths (i.e., changes are assumed tobe equally likely to occur along the shortest and thelongest branch on the tree). Maximum parsimonymethods also do not provide easily interpretablestatistical support measures for reconstructed states(Nunn, 2011). More important, parsimony lacks anunderlying evolutionary model and is being drivento extinction by model-based approaches, such asthose based on maximum likelihood. By using aspecific evolutionary model, maximum likelihoodapproaches integrate information about branchlengths (the amount of time that lineages haveevolved independently of other taxa in the tree)and rates of evolutionary change, and they can provide estimates of statistical support for each reconstructed node in the tree. These models can alsoaccommodate specific types of trait evolution, suchas asymmetric transition rates in which the probability of moving from state A to state B differs fromthat of moving from state B to state A.To illustrate a maximum likelihood reconstruction using discrete variables, we present an exampleusing data on social learning, extractive foraging,and tool use taken from Reader, Jager, and Laland(2011). This dataset includes counts of publishedreports for each of these categories in a large sampleof primates, along with the total number of citationsfor each species at the time data were compiled.To create discrete traits based on these data, wePSNPGLS has been incorporated in several recentstudies of comparative cognition. For example,using PGLS with a sample of 13 primate species,Stevens (2014) identified links between a range ofallometric variables, including body mass, brainvolume, life span, and home range size, and species differences in a delayed reward task. In anotherstudy, MacLean et al. (2014) found that absolutebrain volume and dietary breadth, but not frugivoryor species-typical social group size, predicted differences on two self-control tasks among 36 species ofmammals and birds. Interestingly, when a smallersubset of species was tested on both a social cognitive measure and one of these self-control tasks,MacLean et al. (2013) found that social group sizewas a significant predictor of species differenceson the social but not the self-control task. Last, ina recent comparative study of 15 primate species(including humans), Burkart et al. (2014) foundthat extensive allomaternal care was the best predictor of proactive prosociality, implicating cooperativebreeding as a possible selective pressure for humanhypercooperation (see Chapter 13, this volume).We return to this example below to assess whetherhumans show substantially more prosociality thanother primates given their level of allomaternal care(see Phylogenetic Prediction section).Thus, PGLS has allowed researchers to test awide range of hypotheses about cognitive evolution.Unlike studies using proxy variables for cognition,such as brain size, a combination of experimentaland phylogenetic methods has led to unique insightsabout the selective pressures that have favored cognitive evolution in specific cognitive domains. Collectively, these types of studies highlight an excitingnew direction for research in comparative cognition,one that has potential to lead to major insights aboutlong-standing questions regarding how and whycognition evolves.7BK-APA-HCM V1-160213-Chp10.indd 704/07/16 6:13 PM
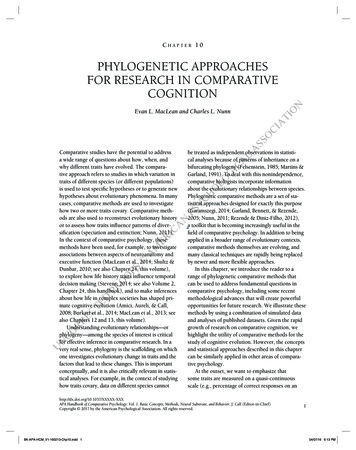
MacLean and NunnCIATIONmember of the genus (each of these coded as yes[1] or no [0]). Ancestral states were then estimatedusing maximum likelihood in a model with equaltransition rates between the character states for eachvariable, meaning that the rates of state yes transitioning to state no were equivalent to rates of stateno transitioning to state yes.The results of this analysis are plotted on the genuslevel tree in Figure 10.4. The tips of the tree depict theASSOtool useext. foragesocial learningfirst restricted the dataset to species with at least 20citations in the Zoological Record database, effectively limiting the data to a subset of reasonablywell-studied species. Species-level data were thencollapsed to a genus-level summary (44 genera) toallow a concise example for illustrative purposes.Finally, within each genus we created three discretevariables reflecting whether social learning, extractive foraging, and tool use had been observed in anyUNCORRECTEDPROOFS AMERICANPSYCHOLOtool useext. foragesocial CercopithecusFIGURE 10.4. Ancestral state reconstruction of tool use, extractive foraging,and social learning modeled as discrete traits in primate genera. Squares at thetips of the phylogeny represent the character states for extant species(shaded trait present, unshaded trait absent). The circles at the internalnodes represent the scaled likelihood that a trait was present at that node(proportion shaded likelihood a trait was present). The leftmost circles andsquares correspond to tool use. The center circles and squares correspond toextractive foraging. The rightmost circles and squares correspond to sociallearning. See text for details.8BK-APA-HCM V1-160213-Chp10.indd 804/07/16 6:13 PM
Phylogenetic Approaches for Research in Comparative CognitionUNCORRECTEDPROOFS AMERICAPHYLOGENETIC PREDICTIONEvolutionary singularities—or uniquely derivedtraits—present a challenge for comparative methodsYCHOLOGICALASSOCIATIONthat rely on convergence to infer adaptation. However, comparative methods can be used to determinewhether a particular species deviates from what oneexpects given the phylogeny and given the relationships between a set of predictor and response variables measured in other taxa (Nunn & Zhu, 2014;Organ, Nunn, Machanda, & Wrangham, 2011). Forexample, human brains may have more neuronsthan any other primate species, but this trait maynot be extraordinary given knowledge of humanbrain volumes and the general cellular scaling rulesof primate brains (Herculano-Houzel, 2009, 2012).Many long-standing questions in comparativepsychology relate to whether aspects of cognitionare qualitatively different in humans and nonhuman animals (Penn, Holyoak, & Povinelli, 2008;Shettleworth, 2012). Often, these questions areinvestigated by comparing the performance ofhumans and nonhuman animals on a set of cognitive measures with the aim of identifying areas ofsimilarity and difference (e.g., Herrmann, Call,Hernàndez-Lloreda, Hare, & Tomasello, 2007;Inoue & Matsuzawa, 2007). However, even in casesin which humans do differ substantially from otherspecies, these differences may be predictable withina phylogenetic framework and, in this sense, consistent with broader evolutionary patterns. Methodsfor phylogenetic prediction allow statistical inferences about the extent to wh
study of cognitive evolution. However, the concepts and statistical approaches described in this chapter can be similarly applied in other areas of compara-tive psychology. At the outset, we want to emphasize that some traits are measured on a quasi-continuous scale (e.g., percentage of correct responses on an CHAPTER 10 PHYLOGENETIC APPROACHES