Transcription
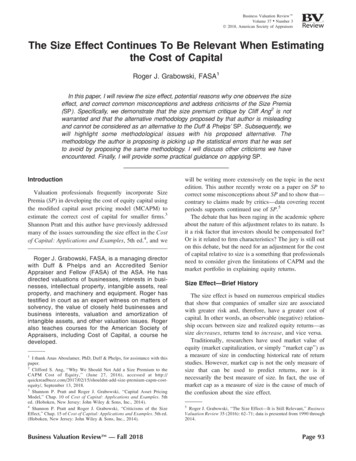
Business Valuation RevieweVolume 37 Number 3Ó 2018, American Society of AppraisersThe Size Effect Continues To Be Relevant When Estimatingthe Cost of CapitalRoger J. Grabowski, FASA1In this paper, I will review the size effect, potential reasons why one observes the sizeeffect, and correct common misconceptions and address criticisms of the Size Premia(SP). Specifically, we demonstrate that the size premium critique by Cliff Ang2 is notwarranted and that the alternative methodology proposed by that author is misleadingand cannot be considered as an alternative to the Duff & Phelps’ SP. Subsequently, wewill highlight some methodological issues with his proposed alternative. Themethodology the author is proposing is picking up the statistical errors that he was setto avoid by proposing the same methodology. I will discuss other criticisms we haveencountered. Finally, I will provide some practical guidance on applying SP.IntroductionValuation professionals frequently incorporate SizePremia (SP) in developing the cost of equity capital usingthe modified capital asset pricing model (MCAPM) toestimate the correct cost of capital for smaller firms.3Shannon Pratt and this author have previously addressedmany of the issues surrounding the size effect in the Costof Capital: Applications and Examples, 5th ed.4, and weRoger J. Grabowski, FASA, is a managing directorwith Duff & Phelps and an Accredited SeniorAppraiser and Fellow (FASA) of the ASA. He hasdirected valuations of businesses, interests in businesses, intellectual property, intangible assets, realproperty, and machinery and equipment. Roger hastestified in court as an expert witness on matters ofsolvency, the value of closely held businesses andbusiness interests, valuation and amortization ofintangible assets, and other valuation issues. Rogeralso teaches courses for the American Society ofAppraisers, including Cost of Capital, a course hedeveloped.1I thank Anas Aboulamer, PhD, Duff & Phelps, for assistance with thispaper.2Clifford S. Ang, ‘‘Why We Should Not Add a Size Premium to theCAPM Cost of Equity,’’ (June 27, 2016), accessed at ize-premium-capm-costequity/, September 13, 2018.3Shannon P. Pratt and Roger J. Grabowski, ‘‘Capital Asset PricingModel,’’ Chap. 10 of Cost of Capital: Applications and Examples. 5thed. (Hoboken, New Jersey: John Wiley & Sons, Inc., 2014).4Shannon P. Pratt and Roger J. Grabowski, ‘‘Criticisms of the SizeEffect,’’ Chap. 15 of Cost of Capital: Applications and Examples. 5th ed.(Hoboken, New Jersey: John Wiley & Sons, Inc., 2014).Business Valuation ReviewTM — Fall 2018will be writing more extensively on the topic in the nextedition. This author recently wrote on a paper on SP tocorrect some misconceptions about SP and to show that—contrary to claims made by critics—data covering recentperiods supports continued use of SP.5The debate that has been raging in the academic sphereabout the nature of this adjustment relates to its nature. Isit a risk factor that investors should be compensated for?Or is it related to firm characteristics? The jury is still outon this debate, but the need for an adjustment for the costof capital relative to size is a something that professionalsneed to consider given the limitations of CAPM and themarket portfolio in explaining equity returns.Size Effect—Brief HistoryThe size effect is based on numerous empirical studiesthat show that companies of smaller size are associatedwith greater risk and, therefore, have a greater cost ofcapital. In other words, an observable (negative) relationship occurs between size and realized equity returns—assize decreases, returns tend to increase, and vice versa.Traditionally, researchers have used market value ofequity (market capitalization, or simply ‘‘market cap’’) asa measure of size in conducting historical rate of returnstudies. However, market cap is not the only measure ofsize that can be used to predict returns, nor is itnecessarily the best measure of size. In fact, the use ofmarket cap as a measure of size is the cause of much ofthe confusion about the size effect.5Roger J. Grabowski, ‘‘The Size Effect—It is Still Relevant,’’ BusinessValuation Review 35 (2016): 62–71; data is presented from 1990 through2014.Page 93
Business Valuation ReviewTMOne of the first characteristics that researchers analyzedwas returns on large-market-capitalization (large-cap)companies versus returns on small-market-capitalization(small-cap) companies because the data to calculatemarket capitalization were available in the Center forResearch in Security Prices (CRSP) database. Forexample, a 1981 study by Rolf Banz examined thereturns of New York Stock Exchange (NYSE) small-capcompanies compared to the returns of NYSE large-capcompanies over the period 1926 to 1975. Banz observedthat the returns of small-cap companies were greater thanthe returns for large-cap companies.6Roger Ibbotson and Rex Sinquefeld began publishingsummaries of data that demonstrated the size effect (laterincorporated in the annual Stocks, Bonds, Bills andInflation [SBBI]) based on analyzing the CRSP data andmarket cap as the measure of size.7 Originally theypublished a small stock premium calculated as the simpledifference in small-cap returns versus large-cap returns.8However, relying on the simple difference in small-capreturns versus large-cap returns is problematic becauseequity risk premium, the expected return on the marketportfolio of stocks in excess of the risk-free rate).This author still reads references to ‘‘small stockpremium’’ when the writer means SP and vice versa. Toavoid confusion, it is important to accurately define therelationship one is discussing.While many critiques of the size effect focus on thesmall stock premium with size measured by marketcapitalization, we shall examine the beta-adjusted sizepremia now published as the CRSP Decile Size Premia.10First, why do we observe the empirical CRSP DecileSize Premia? For example, is the size effect simply theresult of not estimating beta correctly? That is, if we had abetter way of estimating beta the CAPM would we notobserve the SP? Or, are there simply market anomaliesthat cause the size effect to appear? Is size a proxy for oneor more other factors correlated with size? Should onedirectly use these factors rather than size to measure risk?Is the size effect hidden because of unexpected events?in doing so one assumes that the company being valued hasthe same systematic risk (or beta) as the portfolio of smallstocks used in the calculation of the size premium.9SP are based on empirical observations. The observedreturns of small-cap stocks adjusted for beta risk in excessof returns of large-cap stocks calls into question whetherthe textbook CAPM fully explains stock returns. If CAPMwere fully explaining the returns on stocks, then why dowe find a size effect after adjusting for beta? Thisquestion has spawned a large body of research.Small companies are believed to have greater requiredrates of return than do large companies because smallcompanies are inherently riskier. It is not clear, however,whether this is attributable to size itself or to other factorsclosely related to or correlated with size. Banz’s insight inhis 1981 article remains as pertinent today as it was thirtyseven years ago:In other words, SP are now most often measured byremoving the portion of observed excess return that isattributable to the CAPM beta, leaving only the sizeeffect’s contribution to excess return. For each portfolioconstructed from the CRSP database measuring size bymarket cap, SP are calculated as follows:Size premium ¼ Realized return Estimated return;where the realized return equals the historical return inexcess of the risk-free rate (calculated as the realizedlong-term arithmetic mean return of the subject portfolioof stocks minus the realized long-term arithmetic returnof the risk-free rate) and the estimated return equals thereturn expected from CAPM (calculated as beta for thesubject portfolio of stocks multiplied by the realized6Rolf W. Banz, ‘‘The Relationship between Return and Market Value ofCommon Stocks,’’ Journal of Financial Economics (March 1981):3–18.This paper is often cited as the first comprehensive study of the sizeeffect.7Later the SBBI Yearbook was replaced by the SBBI ValuationYearbook (which was published by Morningstar until 2013). The dataseries was more recently published in the Duff & Phelps ValuationHandbook – U.S. Guide to Cost of Capital from 2014 through 2016. Thedata series is now available via the online Duff & Phelps Cost of CapitalNavigator platform. See dpcostofcapital.com and view a video case studyto see the functionality and capabilities of the Cost of Capital Navigator.8The excess returns to small cap stocks data series continues to beavailable via the on-line Cost of Capital Navigator under the title ‘‘TheCRSP Decile Size Premia Studies.’’9Author, 2012 SBBI Valuation Yearbook (City: Publisher, 2012), 28.Page 94Possible Explanations for the Size EffectIt is not known whether size [as measured by marketcapitalization] per se is responsible for the effect or whethersize is just a proxy for one or more true unknown factorscorrelated with size.11Practitioners know that small firms measured in termsof fundamental size measures such as assets or net incomehave risk characteristics that differ from those of largefirms. For example, potential competitors can more easilyenter the ‘‘real’’ market (the market for the goods and/orservices offered to customers) of the small firm and takethe value that the small firm has built. Large companies10Published in 2014 through 2017 in the annual Valuation Handbook—U.S. Guide to Cost of Capital and now available through the online Costof Capital Navigator online platform.11Rolf W. Banz, ‘‘The Relationship between Return and Market Valueof Common Stocks,’’ Journal of Financial Economics (March 1981):3–18.Ó 2018, American Society of Appraisers
The Size Effect Continues To Be Relevant When Estimating the Cost of Capitalhave more resources to better adjust to competition andavoid distress in economic slowdowns. Small firmsundertake less research and development and spend lesson advertising than large firms do, giving them lesscontrol over product demand and potential competition.Small firms have fewer resources to fend off competitionand redirect themselves after changes in the marketoccur.12Smaller firms often have fewer analysts following themand less information available about them. Smaller firmsmay have less access to capital, thinner managementdepth, a greater dependency on a few large customers,and their stocks may be less liquid than the stocks of theirlarger counterparts. One study found that analysts andinvestors have difficulty evaluating small, little-knowncompanies and estimating traditional quantitative riskmeasures for them. This ambiguity adds to the risk ofinvestment and increases the return required to attractinvestors.13The characteristics of smaller firms generally cause therate of return that investors expect when investing instocks of small companies to be greater than the rate ofreturn expected when investing in stocks of largecompanies.Several authors have investigated problems withestimating beta, a forward-looking concept, using historical returns over look-back periods. The most commonmethod used in estimating beta is the ordinary leastsquares (OLS) regression of historical returns over a lookback period. If the true beta is underestimated, SP will beobserved, and the cost of equity capital estimated usingthe textbook CAPM will be underestimated.14 SP can beseen as a correction for this underestimation.For example, papers investigated the problem withunderestimating betas for ‘‘troubled’’ firms that tend topopulate the smaller deciles where size is measured by themarket value of equity.15 As the market value of equitygets bid down for a troubled company, its stock may tradelike a call option.This suggests that SP may be overestimated in CRSPsubdecile 10z, for example, which is populated with thesmallest companies as measured by market cap. TheCRSP Decile Size Premia include all companies with no12See, for example, M. S. Long and J. Zhang, ‘‘Growth Options,Unwritten Call Discounts and Valuing Small Firms,’’ EFA 2004Maastricht Meetings Paper no. 4057, March 2004.13R. Olsen and G. Troughton, ‘‘Are Risk Premium Anomalies Causedby Ambiguity?’’ Financial Analysts Journal (March–April 2000):24–31.14Sabine Elmiger, ‘‘CAPM-Anomalies: Quantitative Puzzles,’’ EconTheory (June 2018). http://doi.org/10.1007/s00199-018-1137-5.15Carlos A. Mello-e-Souza, ‘‘Bankruptcy Happens: A Study of theMechanics of Distressed Driven CAPM Anomalies,’’ Working paper,January 25, 2002; and ‘‘Limited Liability, the CAPM and SpeculativeGrade Firms: A Monte Carlo Experiment,’’ Working paper, August 18,2004.Business Valuation ReviewTM — Fall 2018exclusion of speculative (e.g., start-up) or distressedcompanies whose market cap is small because of beingspeculative or distressed. Some critics have held that theinclusion of speculative or distressed companies in thedatabase is a basis for criticism of the size effect.16 Wewill return to a discussion of subdecile 10z later.Size Effect—More ResearchIn 1990, this author, who regularly applied SP whenestimating the cost of equity capital using the MCAPM,was confronted with criticisms of the size effect andbegan closely studying the relationship between companysize and stock returns. This research focused on whetherstock returns were predicted by measures of size otherthan market cap and whether stock returns were predictedby fundamental risk measures based on accounting data.We found that as size decreases, or risk increases (asmeasured by fundamental accounting data), returns tendto increase (and vice versa). Thereafter, we published aseries of articles reporting our findings, culminating witha seminal 1996 article and a subsequent article in 1999that together serve as the foundation of the Risk PremiumReport studies.17These studies differ from some of the academicresearch in the way the portfolios are constructed. Thebasic methodology is akin to that used by valuationprofessionals when identifying guideline public companies when valuing a nonpublicly traded business.Valuation professionals begin their investigation bysearching for appropriate guideline public companies toinclude in their estimation of beta and their marketapproach analysis by examining the characteristics ofpotential guideline public companies and comparingthose characteristics to those of the subject business.The valuation professional strives to identify thehypothetical ‘‘as if publicly traded’’ market value of thesubject company by comparing its metrics to those ofpublicly traded companies with comparable risk andexpected return characteristics as the subject company.For example, if the subject company is an established smallcompany, the most appropriate guideline companies arethose established publicly traded companies that are in thesame industry but are also small. Likewise, if the subjectcompany is not highly levered and is profitable, the mostappropriate guideline pubic companies in its industry arethose that are not highly levered and are profitable. It is16Jonathan B. Berk, ‘‘A Critique of Size Related Anomalies,’’ Review ofFinancial Studies 8 (Summer 1995):225–286.17Roger J. Grabowski and David King, ‘‘New Evidence on Size Effectsand Equity Returns,’’ Business Valuation Review 15 (September 1996,revised March 2000):103–115; Roger J. Grabowski and David King,‘‘New Evidence on Equity Returns and Company Risk,’’ BusinessValuation Review 18 (September 1999, revised March 2000):112–130.Page 95
Business Valuation ReviewTMeasy to understand in applying the market approach (i.e.,applying multiples derived from guideline public companies to the subject company). Even then, some academicserroneously claim that valuation professionals shouldapply an average multiple drawn from all companies inan industry whether they would be considered guidelinecompanies or not. This faulty line of reasoning wascountered in recent empirical research.18The same logic follows in examining the returns ofsimilar public companies to develop a discount rateappropriate for the subject company. That is, the historicreturns of companies with comparable characteristics asthose of the subject company should be used as evidenceof the likely expected returns for the subject company.That logic guided us in constructing the portfoliosreported in the Risk Premium Report studies.The Risk Premium Report studies screen out speculativestart-ups, distressed (i.e., bankrupt) companies, and otherfinancial high-risk companies. We are examining the returnsof relatively high-quality firms.19 This methodology waschosen to counter the criticism of the size effect by some thatthe SP is a function of the high rates of return for speculativecompanies and distressed companies in the data set.Financial services companies are also excluded fromthe analysis because the regulated nature of banks andinsurance companies causes their underlying characteristics to differ from those of non-regulated companies.20Risk Premium Report–Size Studies21The Risk Premium Report–Size Studies report on sizepremia where size is measured in eight differentmeasures: Market capitalization; Book value of equity;Five-year average net income; Market value of investedcapital (MVIC); Total assets; Five-year average EBITDA;Sales; Number of employees.We have several reasons for using alternative measuresof size (in addition to the market cap used in the CRSPDecile Size Study).18Friedrich Christian Rose Sommer and Arnt Wohrmann, ‘‘NegativeValue Indicators in Relative Valuation—An Empirical Perspective,’’Journal of Business Valuation and Economic Loss Analysis 9 (2014):23–54.19Thus this analysis can be thought of as consistent with the findings ofClifford S. Asness, Andrea Frazzini, Ronen Israel, Tobias J. Moskowitz,and Lasse Heje Pedersen, ‘‘Size Matters, If You Control Your Junk,’’Journal of Financial Economics 129 (2018):479–509.20Because financial services companies are excluded from the base setof companies used to develop the analyses presented in the RiskPremium Report studies, the data published should not be used toestimate cost of equity for financial services companies (i.e., companieswith an SIC Code that begins with 6).21See Chapter 7, ‘‘The CRSP Decile Size Premia Studies and the RiskPremium Report Studies—A Comparison’’; Chapter 9, ‘‘Risk PremiumReport Exhibits—General Information’’; and Chapter 10, ‘‘Risk Premium Reports—Examples,’’ available through the online Cost of CapitalNavigator platform.Page 96First, financial literature indicates that a bias may beintroduced when ranking companies by market valuebecause a company’s market capitalization may beaffected by characteristics of the company other thansize. In other words, some companies might be small (asmeasured by market cap) because they are risky (highdiscount rate), rather than risky because they are small(small assets or small income).22One simple example could be a company with a largeasset base but a small market capitalization as a result ofhigh leverage or depressed earnings. Another examplecould be a company with large sales or operating incomebut a small market capitalization attributable to beinghighly leveraged.Second, market cap may be an imperfect measure ofthe risk of a company’s operations.Third, using alternative measures of size may have thepractical benefit of removing the need to first make aguesstimate of size (i.e., the hypothetical market cap ofthe subject company) in order to know which portfolio’spremium to use (this issue is commonly referred to as the‘‘circularity’’ issue). When you are valuing a nonpubliclytraded company, you are trying to determine an estimateof as if public traded market value. If you need to make aguesstimate of the subject company’s market cap first inorder to know which size premia to use, the circularityproblem is introduced. While market cap for the nonpublicly traded company is not available, other sizemeasures, such as assets, net income or sales, aregenerally available.Returns each year are measured as the equal weightedaverage return for the companies comprising the sizeranked portfolio. The valuation professional is notbuilding investment portfolios but rather, we aredetermining the return for the typical company withcertain size characteristics over time.23For illustrative purposes, we focus on the results of theSize Study for four measures of size based on returns for1981 through 2016 and 1990 through 201624 for theportfolios comprised of the smallest companies (asmeasured by the respective size measure) (Portfolios 21through 25) (see Exhibits 1, 2, 3, and 4). The size premia(observed premium over CAPM) is observed for bothperiods, 1981–2016 and 1990–2016 (see Premium overCAPM columns).22Jonathan B. Berk, ‘‘A Critique of Size Related Anomalies,’’ Review ofFinancial Studies 8 (Summer 1995):225–286.23This is comparable to the S&P Equal Weighted Index.24The exhibits presented herein are based on data extracted from thedata used to prepare Risk Premium Report Exhibit B that appeared in the2017 Valuation Handbook—Guide to Cost of Capital for the period 1963to 2016. Of course, in developing cost of capital estimates, one shoulduse data for the period ending prior to the valuation date.Ó 2018, American Society of Appraisers
The Size Effect Continues To Be Relevant When Estimating the Cost of CapitalExhibit 1Companies Ranked by Size Measured by MarketValue of Equity: Size Premia for Companies Rankedby Market Value of EquityPortfolioRankingby Size2122232425Premiums of CAPMAverage MVE(in .82%3.38%2.36%5.61%7.99%4.27%4.83%3.81%7.06%9.43%* Average total market value of equity (MVE) in 2015 forcompanies comprising each portfolioCAPM ¼ capital asset pricing model.We show these specific periods to counter the criticismthat SP have disappeared in the post-Banz periods.While the change in SP portfolio to portfolio are notuniformly monotonic, we are presenting empirical results.We make no claim that there is an underlying theory.Rather, SP are a correction to a theory shown to befraught with problems.In summary, given this recent evidence, one canconclude that the size effect can still be used today byvaluation professionals.Exhibit 3Companies Ranked by Size Measured by Total Assets:Size Premia for Companies Ranked by Total AssetsPortfolioRankingby Size2122232425 2122232425Premiums of CAPMNet Income(in %4.17%4.41%6.18%3.13%4.95%5.62%5.86%8.05%* Five-year average prior to 2016 for companies comprisingeach portfolioCAPM ¼ capital asset pricing model.Business Valuation ReviewTM — Fall 6%6.43%3.59%4.60%4.89%5.31%7.87%Portfolios 1, 2, and 3, and the data for the portfolioscomprising the smallest firms as measured by therespective measure of size, Portfolios 21 through 25.We make the following observations:Size and fundamental risk of small companies arerelated. Exhibits 5, 6, 7, and 8 display select data for thesame periods as shown in Exhibits 1 to 4 above. Wedisplay the data for the portfolios comprising the largestfirms as measured by the respective measure of size,PortfolioRankingby Size1981–2016* Average total assets in 2015 for companies comprising eachportfolioCAPM ¼ capital asset pricing model.Is the Size Premium a Proxy for OtherCharacteristics?Exhibit 2Companies Ranked by Size Measured by Five-YearAverage Net Income: Size Premia for CompaniesRanked by Five-Year Average Net IncomePremiums of CAPMAverage Total Assets(in Millions)*The increase in SP as size decreases is not the resultof significantly different amounts of debt among thecompanies comprising the portfolios (see Avg Debtto MVIC columns); recall that the high financial riskcompanies have been excluded in the basic RiskPremium Report analysis.Business risks as measured by the unlevered assetbeta (i.e., greater asset beta indicates greater businessrisk) generally increase as size decreases (seeAverage Unlevered Beta column).Business risks as measured by the average operatingmargin (i.e., a lower average operating marginindicates greater business risk) generally increaseas size decreases (see Average Operating Margincolumn).Exhibit 4Companies Ranked by Size Measured by Five-YearAverage EBITDA: Size Premia for Companies Rankedby Five-Year Average EBITDAPortfolioPremiums of CAPMRankingFive-year Averageby Size EBITDA (in Millions)* 1981–2016 0%5.99%4.85%4.57%6.13%4.74%7.43%* Five-year average prior to 2016 for companies comprisingeach portfolioCAPM ¼ capital asset pricing model; EBITDA ¼ earningsbefore interest, taxes, appreciation, and amortization.Page 97
Business Valuation ReviewTMExhibit 5Companies Ranked by Size Measured by Market Value of Equity: Fundamental Risk Data for Companies Ranked byMarket Value of EquityPortfolio Rankingby Size1232122232425Fundamental Risk DataMVE(in Millions)*Avg Debt/MVICUnlevered BetaAvg OperatingMarginAvg CV(Operating %33.00%47.18%* Average in 2015 for companies comprising each portfolioMVIC ¼ debt plus market value of equity; CV ¼ coefficient of variation.Exhibit 6Companies Ranked by Size Measured by Five-year Average Net Income: Fundamental Risk Data for CompaniesRanked by Five-Year Average Net IncomePortfolio Rankingby Size1232122232425Fundamental Risk DataNet Income(in Millions)*Avg Debt/MVICUnlevered BetaAvg OperatingMarginAvg CV(Operating 1%* Five-year average prior to 2016 for companies comprising each portfolioMVIC ¼ debt plus market value of equity; CV ¼ coefficient of variation. Business risks as measured by the variability ofoperating margin over the prior five years (i.e., ahigher coefficient of variation of operating marginindicates greater risk) generally increase as sizedecreases (see Average CV [Operating Margin]column).Liquidity affects the cost of capital.25 For thispurpose, liquidity refers to the speed at which a largequantity of a security can be traded with a minimalimpact on the price and with the lowest transactioncosts. Stocks of small companies generally do not havethe same level of liquidity as large-company stocks. This25See, for example, Roger G. Ibbotson and Daniel Y.-J. Kim, ‘‘Risk andReturn within the Stock Market: What Works Best?’’ Working paper,January 8, 2016. Accessed at http://www.zebracapital.com.Page 98is likely a function of the mix of shareholders andunderlying risk characteristics. Many institutional investors do not own stocks in small companies becausethey have too much money to invest relative to the sizeof these companies. Were they to invest as little as 1% oftheir available funds in a small company, they likelywould control the company. Institutional investorsgenerally want sufficient liquidity to move into andout of their positions in a single firm without disruptingthe market. Therefore, one does not see the breadth ofinvestors investing in small-cap stocks, as one sees inlarge-cap stocks.Further, small companies are followed by only a smallnumber of analysts, if any at all. This makes it moredifficult for investors to acquire information on andevaluate small firms.Ó 2018, American Society of Appraisers
The Size Effect Continues To Be Relevant When Estimating the Cost of CapitalExhibit 7Companies Ranked by Size Measured by Total Assets: Fundamental Risk Data for Companies Ranked by TotalAssetsPortfolio Rankingby Size1232122232425Fundamental Risk DataTotal Assets(in Millions)*Avg Debt/MVICUnlevered BetaAvg OperatingMarginAvg CV(Operating 3%30.74%43.99%* Average total assets in 2015 for companies comprising each portfolioMVIC ¼ debt plus market value of equity; CV ¼ coefficient of variation.Are SP observed for smaller companies (afteradjusted for differences in beta) the result ofdifference in size or differences in liquidity? Differences in liquidity certainly impact the observed returnsin publicly traded stocks but if one is estimating thecost of capital for a small, nonpublic business, theanalyst has no observations as to the liquidity thatcompany’s stock might have were it public. We canonly estimate that the liquidity of that stock would besimilar of other publicly traded stocks of companies ofsimilar size.Fundamental risk may be creating the liquidity effect.That is, the greater underlying risks of small companiesrelative to those of larger companies may cause investorsto shy away from small companies, reducing theirliquidity. Thus, reduced liquidity may also be acoincident indicator of fundamental risk.Criticisms of AngWe will now provide a response to Ang’s criticismsadvocating that the CRSP Decile SP calculated by Duff &Phelps is erroneous. We will explain how his logic isflawed and present concrete evidence to that effect.Criticism: Size Premium is an error is a statisticalsenseAng considers SP nothing but an excess of return thatis not captured by the CAPM and added back labeled aSize Premium. The author refers to the size premium asExhibit 8Companies Ranked by Size Measured by Five-Year Average EBITDA: Fundamental Risk Data for CompaniesRanked by Five-Year A
series was more recentlypublished in the Duff & PhelpsValuation Handbook - U.S. Guide to Cost of Capitalfrom 2014 through 2016. The data series is now available via the online Duff & Phelps Cost of Capital Navigator platform.Seedpcostofcapital.com and view a video case study to see the functionality and capabilities of the Cost of Capital .