Transcription
JCA-21-03-07-REILLY.qxp JCA 06-06-04-Ruby 4/19/21 3:12 PM Page 25EMPIRICALBENCHMARKS TOESTIMATE THECOMPANYSPECIFIC RISKPREMIUMThere are various market-derived, empirical data sources thatanalysts may consider for guidance as a proxy or benchmarkin the company -specific risk premium estimation process.C O N N O R J . T H U R M A N A N D R O B E R T F. R E I L LYE.stimating the cost of capital isone component of every construction company’s valuation,damages, or transfer price analysis, especially for private construction companies. These analyses may beperformed for transaction, taxation, financing, accounting, and litigation purposes,among many others.This discussion is the second part of atwo-part series. The first part of thisdiscussion described the generally acceptedcost of capital measurement models, focusingon the company-specific risk premium(CSRP) component of the cost of capital. 1Part one summarized three reasons for including a CSRP in the cost of capital measurementused in a construction company valuation,damages, or transfer price analysis. It alsodescribed the qualitative factors that analystsconsider in the CSRP estimation process.This part of the discussion describes thevarious empirical data sources that analystsmay consider as proxies, benchmarks, orapproximations in the estimation of theconstruction company CSRP.Proxies for the CSRPThe final estimation of a CSRP is supportedby the analyst’s professional judgment. Suchprofessional judgment is based on considerationof the qualitative factors that may affect thecompany-specific risk of the privateconstruction company and any market-derivedempirical data that may provide a benchmarkor approximation of a supportable CSRP.There are various data sources that analystsmay consider for guidance as a proxy orbenchmark in the CSRP estimation process.Unlike the data sources that analysts mayconsider for measurement of the size-relatedCONNOR J. THURMAN is a senior associate of Willamette Management Associates, a valuation consulting, forensic analysis, andfinancial advisory services firm. He is a resident in the firm’s Portland, Oregon, office and is a candidate member of the AmericanSociety of Appraisers.ROBERT F. REILLY, CPA, is a managing director of Willamette Management Associates, a valuation consulting, forensic analysis,and financial advisory services firm. He is a resident in the firm’s Chicago office and is a certified public accountant accredited inbusiness valuation and certified in financial forensics. He is also a certified management accountant, chartered financial analyst,and certified business appraiser.MARCH/APRIL 2021CONSTRUCTION ACCOUNTING AND TAXATION25
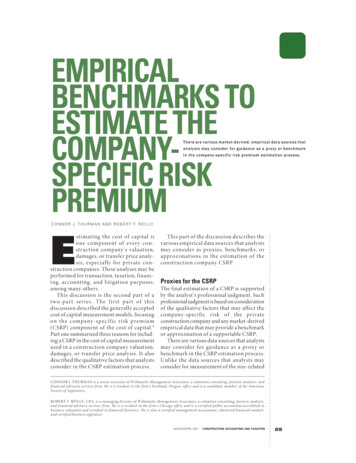
JCA-21-03-07-REILLY.qxp JCA 06-06-04-Ruby 4/19/21 3:12 PM Page 26.EXHIBIT 1The Quantum of Risk Measurement Procedure: Analyst’s Illustrative Estimation of the CSRP Based on aProxy Risk Measurement for Analyst GuidanceApplication of the Modified Capital Asset Pricing Model (ex post equity risk premium)Quanta of Risk in the Cost of Equity CapitalRisk-Free Rate of ReturnGeneral Equity Risk Premium6.91%Multiplied by: Industry Beta0.90Industry-Adjusted Risk Premium6%6.22%Size-Related Risk Premium5.22%Analyst's Estimated Company-Specific Risk Premium- Based on an Assessment of the Previous Levels of Risk4%5%3% - 6%18.31%Indicated Cost of Equity CapitalSelected Cost of Equity Capital (rounded)18%Application of the Build-Up ModelQuanta of Risk in the Cost of Equity CapitalRisk-Free Rate of Return2.87%General Equity Risk Premium6.91%Industry Equity Risk Premium0.14%Industry-Adjusted Risk Premium7.05%Size-Related Risk Premium5.22%Analyst's Estimated Company-Specific Risk Premium - Basedon an Assessment of the Previous Levels of RiskIndicated Cost of Equity CapitalSelected Cost of Equity Capital (rounded)risk premium (S p ) component of the cost ofequity capital (K e ), these proxy data sourcesdo not directly measure the CSRP.Instead, these data sources may help analysts estimate the CSRP. They representproxies for — or substitutes for — the CSRPestimation. They are not databases orformulas that provide specific empiricalevidence to directly measure the CSRP.Ultimately, the CSRP estimation is supported by the analyst’s professionaljudgment and by the analyst’s functionalanalysis of the subject constructioncompany. The data sources described hereinprovide an empirically based, quantitativetest of the reasonableness of the analyst’sestimated CSRP.262.87%Guideline Quantum ofthe Expected Rate ofReturn per Risk Level3%CONSTRUCTION ACCOUNTING AND TAXATIONMARCH/APRIL 20214%Guideline Quantum ofthe Expected Rate ofReturn per Risk Level3%7%5%3% to 7%19.14%19%The following discussion summarizes fourempirically based, quantitative proxy datasources that analysts may consider for guidancein the CSRP estimation process. These proxydata source analyses are as follows:1. quantum of risk in the modified capital asset pricing model (MCAPM) andthe build-up model (BUM);2. quartile analysis of Duff &Phelps/Ibbotson 10 th size decile;3. analysis of relative corporate bondratings and yields; and4. analysis of illiquidity studies (i.e., preinitial public offering and restrictedstock studies).COMPANY-SPECIFIC RISK
JCA-21-03-07-REILLY.qxp JCA 06-06-04-Ruby 4/19/21 3:12 PM Page 27Analysts may consider the different levels(or components) of risk within a K e measurement model such as the MCAPM orBUM to provide indications of the CSRPestimate. That is, each component of theMCAPM (i.e., risk-free rate of return [R f ],beta-adjusted equity risk premium [ERP],and S p ) represents a quantifiable level — orquantum — of risk applicable to the subjectconstruction company. These quantum ofrisk levels may be described as follows: The R f is the rate of return that aninvestor would expect on an investmentwith no risk. Typically, the R f sets theminimum rate of return that aninvestor will expect on any investment.The R f measures the first quantum ofrisk in the K e measurement model. The beta-adjusted ERP (in the MCAPM)or the combination of the ERP and theindustry-related risk premium (IRP) (inthe BUM) measure a second quantum ofthe expected rate of return on investment in the business ownership interest.Typically, this second risk level is thequantum of expected return that motivates investors to forego the risklessinvestment. The S p is the rate of return that aninvestor expects for investing in smallcapitalized companies. In addition tosize, small-capitalized companies tendto be riskier investments than largecapitalized companies for many reasons. The S p provides the thirdquantum of the risk levels related to thesubject construction company.The analyst now has to estimate the quantum for the fourth level of risk — the CSRP— associated with the construction companyinvestment. Analysts have empirically based,quantifiable evidence for the first threequanta of risk associated with an investmentin the construction company, which theycan consider in the CSRP estimation process.Presented in Exhibit 1 is a hypotheticalK e measurement. This illustrative K e measurement considers the first threeempirically based measurable quanta ofrisk levels in the estimation of the fourthjudgment-based quantum of risk level (i.e.,the CSRP).COMPANY-SPECIFIC RISK.Quantum of risk in the MCAPMThe guideline quanta of risk levels presented in Exhibit 1 are based on the followingillustrative data as of December 31, 2018:1. The R f is based on the 20-year U.S.Treasury bond available as of December31, 2018.2. The ERP is the “ex post” ERP providedby the Duff & Phelps Cost of CapitalNavigator.3. The industry beta is based on hypothetical guideline publicly tradedcompanies’ betas as reported byBloomberg.4. The IRP is provided by the Duff &Phelps Cost of Capital Navigator forgeneral contractors–nonresidentialbuildings (presented solely as an illustrative industry group).5. The S p is provided by the Duff &Phelps Cost of Capital Navigator forsize decile 10.Based on the empirically based quantumof risk data for each of the first three levelsof investment risk included in Exhibit 1,an analyst may conclude that 4 percent isa supportable CSRP estimate (i.e., the fourthquantum of risk of the K e ). The conclusionis based on the consideration that the 4percent CSRP estimate falls within the rangeof the other empirically based quantum ofrisk indications.The average quantum of risk in the Exhibit1 MCAPM cost of capital analysis and theBUM cost of capital analysis (before consideration of the CSRP quantum of risk) is4.8 percent and 5.0 percent, respectively. Ananalyst may consider the average size of thequantum of risk measured in each of the firstthree K e model components to indicate asupportable quantum of the CSRP risk level.It is important to note that the previousCSRP quantum of risk level estimate maynot be constant over time. Like allcomponents of the K e , the CSRP is subjectto the prevailing economic conditions,which may upwardly or downwardly affectthe quanta of risk related to the variousrisk factors.For example, if the R f were to decreasefrom 2.9 percent in December 2018 to 1.9percent in December 2019, it is likely thatcorresponding ERPs would decrease (allelse being equal). If the expected return ona risk-free investment decreases, then therelative expected return needed to encourageMARCH/APRIL 2021CONSTRUCTION ACCOUNTING AND TAXATIONANALYSTSMAY CONSIDERTHE DIFFERENTLEVELS (ORCOMPONENTS)OF RISKWITHIN A KeMEASUREMENTMODEL SUCHAS THE MCAPMOR BUM TOPROVIDEINDICATIONSOF THE CSRPESTIMATE.27
JCA-21-03-07-REILLY.qxp JCA 06-06-04-Ruby 4/19/21 3:12 PM Page 28.an investor to forego the risk-free investmentmay also decrease.In other words, the investor would notexpect as much of a rate of return premiumfor investing in generally risky equity investments. This is because the alternative investment (i.e., a risk-free 20-year U.S. Treasurybond) now provides a lower rate of return.Therefore, the quantum of a CSRP risk levelindication based (at least in part) on theR f and the general ERP components of theK e may be correspondingly decreased.Quartile analysis of the CRSP DecilesSize Premia Studies 10th decileBANZCONCLUDEDTHAT THEREWAS ANOBSERVABLENEGATIVERELATIONSHIPBETWEEN THESIZE OF APUBLICCOMPANY ANDTHE HISTORICALEQUITYINVESTMENTRETURNS.28The analyst may consider the Universityof Chicago Center for Research in SecurityPrices (CRSP) Deciles Size Premia Studies10 th decile data (now presented in the Costof Capital Navigator) to provide someempirical guidance as to a supportableCSRP estimate. While the CRSP DecilesSize Premia Studies data are typically reliedon to quantify S p, these data may also providesome guidance with regard to a supportableCSRP range.The following discussion summarizesthe background of the CRSP Deciles SizePremia Studies and how the data may beconsidered in the estimation of the CSRP.B a c k g ro u n d o f t h e C R S P D e c i l e s S i z ePremia Studies data. The first comprehensivestudy of the size effect (i.e., the relationshipof the size of a public company and the rateof return that investors expect on aninvestment in that company’s stock) wasperformed by Rolf Banz in 1981. Banz examined and compared the returns of smallcapitalized New York Stock Exchange (NYSE)companies to the returns of large-capitalizedNYSE companies. The study was performedbetween 1926 and 1975.In his study, Banz segmented all NYSEpublicly traded companies into 10 deciles— the 1 st decile being the largest capitalizedpublic companies and the 10 th decile beingthe smallest capitalized public companies.Banz concluded that there was an observable negative relationship between the sizeof a public company and the historicalequity investment returns. 2 The Banz studydetermined that as the public company sizedecreases, historical equity investmentreturns tend to increase and vice versa. TheCONSTRUCTION ACCOUNTING AND TAXATIONMARCH/APRIL 2021so-called “size effect,” however, was notlinear. Rather, it was most pronounced inthe smallest capitalized public companies.Furthermore, as the investment holdingperiod increased, the small-capitalizedpublic companies tended to outperformthe large-capitalized public companies interms of providing a higher rate of returnto their investors.Many of the risk attributes that generallydefine small-capitalized public companiesprovide possible explanations for the empirically based relationship between companysize and equity return on investment. Ingeneral, small-capitalized public companystocks are less liquid, are harder to diversify,and tend to have less available investor information (due to limited security analyst coverage). Small-capitalized companies havefewer financial resources, operationalresources, human resources, and strategicresources. Limited resources restrict a smallerpublic company’s ability to prevent largercompanies from entering its market andtaking its market share.More access to capital means that largecapitalized public companies tend to hirebetter quality employees, spend more on advertising and on research and development, andendure economic downturns. Additionally,when compared to small public companies,large public companies have a relatively highvolume of customers, decreasing their relianceon a few key customers.While these are not the only differences,the functional and operational differencesoutlined contribute to the increased riskassociated with investing in a small publiccompany compared with investing in a largecompany. Investors expect smaller publiccompanies to provide a higher return onequity investment relative to larger publiccompanies because they expect to be compensated for assuming a greater level ofinvestment risk.The S p quantifies the increased rate ofreturn that investors expect as compensationfor assuming the risk associated with smallcompany investments.A significant relationship between thesize of a company and historical equityreturns was observed in the Banz study.However, the study concluded that it is notclear whether the relationship is due tocompany size itself or to other unknownCOMPANY-SPECIFIC RISK
JCA-21-03-07-REILLY.qxp JCA 06-06-04-Ruby 4/19/21 3:12 PM Page 29COMPANY-SPECIFIC RISK.variables correlated with company size. Itcould be that small company size does notcause risk or the increase in expected investment returns, but rather the financial andoperational disadvantages associated withsmall company size cause the risk — andthe expectations among investors for higherrates of return on equity investments.The conclusion of the Banz study is summarized in the following statement: “It isnot known whether size [as measured bymarket capitalization] per se is responsiblefor the effect or whether size is just a proxyfor one or more true unknown factors correlated with size.” 3As a result of the Banz study, investmentprofessionals began performing their own“size effect” studies. Applying the data produced by the CRSP, Roger Ibbotson andRex Sinquefield performed a series of sizeeffect studies that were published in theMorningstar/Ibbotson annual Stocks, Bonds,Bills, and Inflation Valuation Yearbook(SBBI Valuation Yearbook). Those studieswere called the CRSP Deciles Size PremiaStudies, and they were summarized annuallyin the SBBI Valuation Yearbook from 1999to 2016.In 2016, Morningstar announced it wouldno longer publish the CRSP Deciles SizePremia Study in the Ibbotson SBBI ValuationYearbook. Starting with the 2016 edition,the annual study was produced by Duff &Phelps, and it was published by John Wiley& Sons in the Valuation Handbook – U.S.Guide to Cost of Capital.The CRSP Deciles Size Premia Studiescontinue to segment the NYSE stock returnsinto deciles by size (as measured by themarket capitalization of the publicly tradedcompanies). Based on the NYSE decilebreakpoints, the study now includes allNYSE/NYSE MKT/Nasdaq-listed securitiesrather than just the NYSE-listed securities;the CRSP deciles are also now calculatedfrom 1926 to the present year.The CRSP deciles data include all publiclytraded companies. That is, the CRSP DecilesSize Premia Studies data do not excludefinancial services companies (e.g., companiesin finance, insurance, or real estate) orcompanies with high financial risk.Duff & Phelps calculates the sizepremiums for the CRSP deciles as follows:“Size premia represent the differencebetween historical (observed) excess returnand the excess return predicted by the capitalasset pricing model (CAPM). Excess returnsare defined here as portfolio returns overand above the risk-free asset’s returns.” 4In this study, the CAPM-predicted returnis calculated as the product of (1) the beta(β) for the subject portfolio (i.e., the subjectdecile) of public stocks and (2) the expectedreturn on the market portfolio of stocksin excess of the Rf times the ERP. Theobserved difference after the β adjustmentdemonstrates that the β of smaller companiesdoes not fully explain the perceived riskassociated with smaller companies. Therefore,the actual rate of equity return offered bysmaller companies is not fully explained bythe unadjusted CAPM alone. In other words,the β of small companies is underestimated.Accordingly, the unadjusted CAPM underestimates the K e of smaller companies.Empirical evidence indicates that theunadjusted CAPM as a measure for theexpected returns for smaller companies isimperfect. As a result, it is a generally acceptedprocedure for analysts to consider S p in theK e calculation. This S p consideration is especially relevant for so-called “microcap” companies (i.e., the public companies with equitycapitalization in the 9 th and 10 th deciles),where the S p is more pronounced. The CRSPdeciles size premiums data can be used inthe application of the MCAPM and the BUMto estimate a K e for a smaller size businessownership interest.The CRSP Deciles Size Premia Studyprovides the size premiums data and othervaluation data previously published in theSBBI Valuation Yearbook and the Duff &Phelps Valuation Handbook – U.S. Guideto Cost of Capital.All size premiums provided by Duff & Phelpsare “beta-adjusted,” meaning that the size premiums are adjusted to remove the portion ofthe excess return (above the unadjusted CAPMestimate) that is attributable to β alone. Thatis, the concluded size premium data reportedby Duff & Phelps only measure the size effect’scontribution to the excess return (above theunadjusted CAPM estimate).In the application of the MCAPM andthe BUM, analysts often apply the CRSPdata to estimate the specific S p for a subjectownership interest. In consideration of asupportable S p , analysts may first estimateMARCH/APRIL 2021CONSTRUCTION ACCOUNTING AND TAXATIONTHE CRSPDECILES DATAINCLUDE ALLPUBLICLYTRADEDCOMPANIES.29
JCA-21-03-07-REILLY.qxp JCA 06-06-04-Ruby 4/19/21 3:12 PM Page 30.EXHIBIT 2Analysis of the 10th Decile: CRSP Deciles Size Premia Studies Data as of December 31, 2018Disaggregation of theCRSP 10th DecileMarket Capitalization of Market Capitalizaiton ofthe Smallest Publicthe Largest PublicCompany ( millions)Company ( 455109.4622.455Sp Size Premium (ActualReturn in Excess of the ReturnPredicted by 1%2.89%4.68%8.25%6.85%11.14%EXHIBIT 3Analysis of the 10y Subdecile: CRSP Deciles Size Premia Studies Data as of September 30, 2018Five-YearMarketFive-YearMarketBookAverageValue ofAverageValue ofValue ofNetInvestedTotalEBITDAEquity (in Equity (in Income (in Capital (in Assets (in(in milDecile 10y millions of millions of millions of millions of millions of lions ofPercentiles turnon BookValue ofEquity 823.418(27.018)0.480(144.8)Note: The data presented above are sourced as of September, but Duff & Phelps relieson these data for its size decile data as of December.Source: Duff & Phelps 2019 Cost of Capital: Annual U.S. Guidance and Examples, Cost of Capital Navigator.the subject ownership interest equity valueby applying a market approach or an assetbased approach valuation method and thenselecting the applicable Duff & Phelps decileand S p indication.When applying the Sp and the IRPprovided by Duff & Phelps, adding bothan S p and an IRP to the BUM analysis isnot considered to be a double counting ofthese risk premiums. This is because theS p is beta-adjusted, and the IRP is the measurement of the beta risk. In other words,these two risk premiums were designed toaccount for two different types of risk. 5Considering the CRSP Deciles Size PremiaAnalystsmay consider an analysis of the CRSP DecilesSize Premia Study 10 th decile as an empiricallyStudies data as a proxy for CSRP.30Revenue(in millions ofdollars)CONSTRUCTION ACCOUNTING AND TAXATIONMARCH/APRIL 2021based proxy (or benchmark) in the CSRPestimation. The 10 th decile is comprised ofthe smallest-capitalized public companiesincluded in the CRSP Deciles Size PremiaStudy.The public companies that comprise theth10 decile may be disaggregated into subcategories 10a and 10b. The public companiesthat comprise the 10a subdecile includecompanies with market capitalizationsbetween 185.4 million and 321.6 million,and the reported size premium is 3.71 percent(as of December 31, 2018).The public companies that comprise the10b subdecile include companies withmarket capitalizations between 2.5 millionand 184.8 million, and the reported sizeCOMPANY-SPECIFIC RISK
JCA-21-03-07-REILLY.qxp JCA 06-06-04-Ruby 4/19/21 3:12 PM Page 31Five-YearMarketFive-YearMarketBookAverageValue ofAverageValue ofValue ofNetInvestedTotalEBITDAEquity (in Equity (in Income (in Capital (in Assets (in(in milDecile 10z millions of millions of millions of millions of millions of lions ofPercentiles venue(in millions ofdollars)Returnon BookValue ofEquity 1)-(181.1)Note: The data presented above are sourced as of September, but Duff & Phelps relies on these data for its size decile data asof December.Source: Duff & Phelps 2019 Cost of Capital: Annual U.S. Guidance and Examples, Cost of Capital Navigator.premium is 8.25 percent (as of December31, 2018).Within each of the 10a and 10b subdecilecategories of the 10 th decile, Duff & Phelpspresents two additional subcategories. The10a subdecile may be disaggregated into10w and 10x subdeciles, while the subdecile10b may be disaggregated into 10y and 10zsubdeciles.Companies that are classified in the 10 thdecile vary considerably in market capitalization and in the applicable S p . The empirically derived S p measurements range from2.89 percent to 11.14 percent, a spread of8.25 percent, or 825 basis points.Exhibit 2 presents an analysis of the CRSPDeciles Size Premia Study data for the 10 thdecile. The Exhibit 2 empirical data weresourced from the Duff & Phelps Cost of CapitalNavigator as of December 31, 2018. Theseempirical data present the disaggregation ofthe 10 th decile as of that date.The 10 th decile disaggregation presentedin Exhibit 2 provides an indication thatinvestment risk may be related to more thanjust the S p examined in the Duff & Phelpsand Ibbotson data. For example, subdecile10y and subdecile 10z are populated bymany large but highly leveraged public companies with small equity capitalizations.Such large (in terms of revenue and/or assets)COMPANY-SPECIFIC RISK.EXHIBIT 4Analysis of 10z Subdecile CRSP Deciles Size Premia Studies Data as of September 30, 2018public companies with small equity capitalization probably do not match the characteristics of financially healthy but smallerpublic companies.As seen in Exhibit 2, as the size of publiccompanies increases, the corresponding S pdecreases, exemplifying why it is importantfor analysts to correctly interpret and applythe S p expected return component of theMCAPM (and BUM) measurement of the K e .According to Duff & Phelps, “as of December 31, 2018, the reported size premium forthe smallest 5 percent of companies bymarket capitalization as represented byCRSP subdecile 10b is 8.25 percent, and thesize premium for the next smallest 5 percentof companies (as represented by CRSP subdecile 10a) is 3.71 percent, a difference of4.54 percent.” 6Further, according to Duff & Phelps,“The CRSP Deciles Size Premia include allcompanies with no exclusion of speculative(e.g., start-up) or distressed companieswhose market capitalization may be smallbecause they are speculative or distressed.” 7The distressed company issue may beconsidered through an analysis of the 10 thdecile subcategories of 10y and 10z, as presented in Exhibit 3 and Exhibit 4.As presented in Exhibit 3, the subdecile10y public companies report five-year netMARCH/APRIL 2021CONSTRUCTION ACCOUNTING AND TAXATION31
JCA-21-03-07-REILLY.qxp JCA 06-06-04-Ruby 4/19/21 3:12 PM Page 32.QUANTIFYINGTHE COMPANYSPECIFICRISK IS ACHALLENGINGPROCESS.32income ranging from negative 44.5 millionto a positive 14.7 million. The subdecile10y public companies are significantlysmaller than other public companies in theCRSP Deciles Size Premia Study; in addition,more than half of these subdecile 10y companies are unprofitable.As presented in Exhibit 4, subdecile 10zincludes public companies in the fifth percentile that report five-year average EBITDAof negative 19.3 million. The public companies classified in subdecile 10z at or belowthe 50 th percentile (i.e., the lower quartile)reported negative EBITDA.Collectively, the data in Exhibits 3 and4 support the conclusion that the CRSPDeciles Size Premia Study 10 t h decile iscomprised of financially troubled and financially distressed companies.Moreover, Duff & Phelps presents thefollowing conclusion with regard tosubdecile 10y and subdecile 10z: “Subdecile10y and subdecile 10z are populated bymany large (but highly leveraged) companieswith small market capitalizations that probably do not match the characteristics offinancially healthy but small companies.” 8According to an article authored by JamesHitchner in the journal Financial Valuationand Litigation Expert, “it’s important tonote that 80 percent of the companies indecile category 10b are from 10z. As such,let’s focus on 10z. At the 50 th percentile of10z the operating margin is –1.11 percent.Yes, on average, these companies are losingmoney. At the 25 th percentile the operatingmargin is –21.27 percent. Furthermore, 62percent of the companies in 10z are fromonly three industry sectors: financialservices, technology, and healthcare.” 9Analysts may consider the S p data associated with CRSP size categories 10w, 10x,10y, and 10z to provide guidance for theCSRP estimation for the subject ownershipinterest. These data are presented in thefar-right column of Exhibit 2 (as ofDecember 31, 2018).In particular, analysts may consider thedifference between the 10x and the 10wsize premiums (e.g., 4.68 percent – 2.89percent) and the difference between the10z and the 10y size premiums (e.g., 11.14percent – 6.85 percent).The differences between these size premiums(of approximately 2 percent to 4 percent) mayCONSTRUCTION ACCOUNTING AND TAXATIONMARCH/APRIL 2021provide an empirically based proxy orbenchmark for a supportable CSRP estimate.Such consideration of the CRSP DecilesSize Premia Study 10 th decile may providea reasonableness test for the analyst’s judgment-based CSRP estimation with regardto the particular unsystematic risk profileof the subject ownership interest.As indicated by the Hitchner article,based on dated information that is still relevant, not only does the CRSP Deciles SizePremia Study 10 th decile include financiallytroubled companies, but it is also skewedby its industry concentration.As presented previously, the actual returnsearned in excess of the returns predicted bythe CAPM was 6.85 percent for subdecile10y and 11.14 percent for subdecile 10z (ora difference of 429 basis points) as ofDecember 31, 2018. This 4.29 percent returnpremium difference may (in part or in whole)be an indication of the quantum of returnthat is correlated with various types offinancial and operational risk — and not justwith the size of the subject ownership interest.That is, the delta between (1) subdecile 10yand subdecile 10z or (2) subdecile 10a andsubdecile 10b may provide an ind
4. The IRP is provided by the Duff & Phelps Cost of Capital Navigator for general contractors-nonresidential buildings (presented solely as an illus-trative industry group). 5. The Spis provided by the Duff & Phelps Cost of Capital Navigator for size decile 10. Based on the empirically based quantum of risk data for each of the first three levels