Transcription
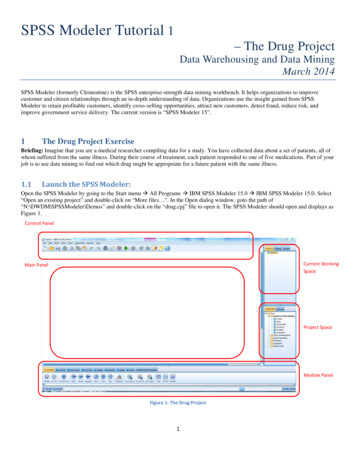
SPSS Modeler Tutorial 1– The Drug ProjectData Warehousing and Data MiningMarch 2014SPSS Modeler (formerly Clementine) is the SPSS enterprise-strength data mining workbench. It helps organizations to improvecustomer and citizen relationships through an in-depth understanding of data. Organizations use the insight gained from SPSSModeler to retain profitable customers, identify cross-selling opportunities, attract new customers, detect fraud, reduce risk, andimprove government service delivery. The current version is “SPSS Modeler 15”.1The Drug Project ExerciseBriefing: Imagine that you are a medical researcher compiling data for a study. You have collected data about a set of patients, all ofwhom suffered from the same illness. During their course of treatment, each patient responded to one of five medications. Part of yourjob is to use data mining to find out which drug might be appropriate for a future patient with the same illness.1.1Launch the SPSS Modeler:Open the SPSS Modeler by going to the Start menu All Programs IBM SPSS Modeler 15.0 IBM SPSS Modeler 15.0. Select“Open an existing project” and double-click on “More files ”. In the Open dialog window, goto the path of“N:\DWDM\SPSSModeler\Demos” and double-click on the “drug.cpj” file to open it. The SPSS Modeler should open and displays asFigure 1.Control PanelCurrent WorkingSpaceMain PanelProject SpaceModule PanelFigure 1: The Drug Project1
1.2Displaying the Properties of the DataTo open a data source, the SPSS Modeler provides many options listed in the “Sources” tab from the “Module Panel”.Here, we will use the “Var. File” node.1. Select the “Sources” tab from the “Module Panel”2. Double click on the “Var.File” node and it will appear in the “Main Panel”. You can also add a node by singleleft-click on the node in the “Module Panel”, then single left-click at the place where you want to place that nodein the “Main Panel”.3. Double click the “Var.File” node in the “Main Panel” to open its property window (Figure 2), and Click the “ ”button next to the “File” field. In the “Open” dialog window, select to open the “DRUG1n” file that containsrecords of drug information. The “Var.File” node now should have properties as in Figure 2. The DRUG1n filecontains records for 7 attributes, termed “Age”, “Sex”, “BP”, “Cholesterol”, “Na”, “K”, and “Drug”.4. Click “OK” to close the “Var.File” property window.Figure 2: Var.File PropertyTo display the properties of the data, we use a “Distribution” node.1. Select the “Distribution” node listed in the “Graphs” tab from the “Module Panel”, and add it to the “Main Panel”.2. Establish a link between the “DRUG1n” node and the “Distribution” node by right-clicking on the “DRUG1n”node and select the “Connect ” option, then left-clicking on the “Distribution” node (Figure 3).Figure 3: Link between two nodes3. Double-click the “Distribution” node to open its property window.4. Select “Drug” for the “Field” option (Figure 4) to display the distribution of drugs. Click “Run”2
Figure 4: Distribution Node Property5. You should see a distribution window for the Drug attribute in the DRUG1n file (Figure 5). This windowillustrates the count of different drugs and their percentages.Figure 5: Distribution of Drugs6. Click OK to close the window.1.3Finding a Relationship in Numeric DataTo investigate a relationship between sodium (Na) and potassium (K) levels, the most natural way would be to produce apoint plot. To do this, we create a “Plot” node and connect it to the “Var.File” node.1. Select the “Plot” node listed in the “Graphs” tab from the “Module Panel”, and add it to the “Main Panel”.2. Establish a link between the “DRUG1n” node and the “Distribution” node by right-clicking on the “DRUG1n”node and select the “Connect ” option, then left-clicking on the “Plot” node (Figure 6).3
Figure 6: Link between DRUG1n and Plot3. Double-click the “Plot” node to open its property window.4. Select “K” (Potasium) for the “X Field” option and select “Na” (Sodium) for the “Y Field” option (Figure 7).Figure 7: Plot Node Property5. Click Run. The plot window of the K attribute and Na attribute will be displayed (Figure 8). This appears to be arandom scattering, with no obviously apparent relationship between the Na and K attributes. However, this graphtakes no account of which drug was used in each case. Therefore, we need to modify the property of the “Plot”node in order to display the correlations between Na and K with respect to different drugs.4
Figure 8: Plot of K v. Na6. Double-click the “Plot” node to open its property window.7. Select “Drug” for the “Color” option in the “Overlay” group (Figure 9).Figure 9: Plot Node Property8. Click Run. The plot window of the K attribute and Na attribute with respect to different drugs will be displayed(Figure 10). We can observe that a clear pattern emerges in the overlaid plot. The threshold is neither the Na norK field, but in a ratio between them.9. Click OK to close the window.5
Figure 10: Plot of K v. Na1.4Finding the ThresholdWe can find the threshold by calculating the ratio and examining its distribution. To do so, we need to create a “Derive”node and connect it to the “Var.file” node.1. Select the “Derive” node listed in the “Field Ops” tab from the “Module Panel”, and add it to the “Main Panel”.2. Establish a link between the “DRUG1n” node and the “Derive” node by right-clicking on the “DRUG1n” nodeand select the “Connect ” option, then left-clicking on the “Derive” node (Figure 11).Figure 11: Link between Var.File and Derive Nodes3. Double-click the “Derive” node to open its property window.4. Type string “Na to K” in the “Derive field”, and formula “Na/K” in the “Formula” area (Figure 12). This willcreate a new field named “Na to K” containing numbers calculated as “Na/K”.6
5. Click “OK” to close this property window. The “Derive” node will be renamed to “Na to K”.Figure 12: Derive Node PropertyNext, we need to create a “Histogram” node to display the output from the “Derive” node.1. Select the “Histogram” node listed in the “Graphs” tab from the “Module Panel”, and add it to the “Main Panel”.2. Establish a link between the “Na to K” node and the “Histogram” node by right-clicking on the “Na to K” nodeand select the “Connect ” option, then left-clicking on the “Histogram” node (Figure 13).Figure 13: Link between Na to K and Histogram Nodes3. Double-click the “Histogram” node to open its property window.4. Select “Na to K” for the “Field” option, and “Drug” for the “Color” option in the “Overlay” group (Figure 14).7
Figure 14: Histogram Node Property5. Click “Run”. The histogram window will be display as in Figure 15.Figure 15: Histogram of Na to KThe histogram shows that the distribution of the ratio of Na and K. In addition, the threshold is clear as the column in thebars change from multi-coloured to the pure yellow colour at the critical value.We can now add a band selection line to this histogram to separate the records before and after the threshold.1. Tick the “Interactions” option from the “View” menu (Figure 16).2. Left-click the “Activates band selection” option (Figure 17).8
3. Place the RED colour line as close as possible to the point at which the bars of the histogram change colour (thethreshold point). (Figure 18).4. Right-click at the right side of the threshold line, and select “Generate Derive Node for Band” option (Figure 19).5. A new “Derive” node will then be added to the “Main Panel”. Open its property window, and observe theselection condition. Rename this node as “band’’.6. Connect this “band” node to “Na to K” derive node and also add a new histogram node to connect to it (Figure20).7. Double-click the “Histogram” node to open its property window.8. Select “Na to K” for the “Field” option, and “Band” for the “Color” option in the “Overlay” group9. Run the new histogram node and observe the result (Figure 21).Figure 16: Histogram InteractionsFigure 17: Activates band selectionsFigure 18: Threshold LineFigure 19: Generate Derive Node9
Figure 20: The new band nodeFigure 21: The new bandEnd of Tutorial 110
Open the SPSS Modeler by going to the Start menu All Programs IBM SPSS Modeler 15.0 IBM SPSS Modeler 15.0. Select "Open an existing project" and double-click on "More files ". In the Open dialog window, goto the path of "N:\DWDM\SPSSModeler\Demos" and double-click on the "drug.cpj" file to open it. The SPSS Modeler should open .