Transcription
American Economic Review: Papers & Proceedings 100 (May 2010): 573–578http://www.aeaweb.org/articles.php?doi 10.1257/aer.100.2.573Growth in a Time of DebtBy Carmen M. Reinhart and Kenneth S. Rogoff*In this paper, we exploit a new multi-countryhistorical dataset on public (government) debt tosearch for a systemic relationship between highpublic debt levels, growth and inflation.1 Ourmain result is that whereas the link betweengrowth and debt seems relatively weak at “normal” debt levels, median growth rates for countries with public debt over roughly 90 percentof GDP are about one percent lower than other wise; average (mean) growth rates are severalpercent lower. Surprisingly, the relationshipbetween public debt and growth is remarkablysimilar across emerging markets and advancedeconomies. This is not the case for inflation. Wefind no systematic relationship between highdebt levels and inflation for advanced economies as a group (albeit with individual countryexceptions including the United States). By contrast, in emerging market countries, high publicdebt levels coincide with higher inflation.Our topic would seem to be a timely one.Public debt has been soaring in the wake of therecent global financial maelstrom, especially inthe epicenter countries. This should not be surprising, given the experience of earlier severefinancial crises.2 Outsized deficits and epic bankbailouts may be useful in fighting a downturn,but what is the long-run macroeconomic impact,especially against the backdrop of graying populations and rising social insurance costs? Aresharply elevated public debts ultimately a manageable policy challenge?Our approach here is decidedly empirical,taking advantage of a broad new historicaldataset on public debt (in particular, centralgovernment debt) first presented in Carmen M.Reinhart and Kenneth S. Rogoff (2008, 2009b).Prior to this dataset, it was exceedingly difficultto get more than two or three decades of public debt data even for many rich countries, andvirtually impossible for most emerging markets.Our results incorporate data on 44 countriesspanning about 200 years. Taken together, thedata incorporate over 3,700 annual observationscovering a wide range of political systems, institutions, exchange rate and monetary arrangements, and historic circumstances.We also employ more recent data on externaldebt, including debt owed both by governmentsand by private entities. For emerging markets,we find that there exists a significantly moresevere threshold for total gross external debt(public and private)—which is almost exclusively denominated in a foreign currency—thanfor total public debt (the domestically issuedcomponent of which is largely denominatedin home currency). When gross external debtreaches 60 percent of GDP, annual growthdeclines by about two percent; for levels ofexternal debt in excess of 90 percent of GDP,growth rates are roughly cut in half. We are notin a position to calculate separate total external debt thresholds (as opposed to public debtthresholds) for advanced countries. The available time-series is too recent, beginning only in2000. We do note, however, that external debtlevels in advanced countries now average nearly200 percent of GDP, with external debt levelsbeing particularly high across Europe.The focus of this paper is on the longer termmacroeconomic implications of much higherpublic and external debt. The final section, however, summarizes the historical experience ofthe United States in dealing with private sector* Reinhart: Department of Economics, 4115 TydingsHall, University of Maryland, College Park, MD 20742(e-mail: creinhar@umd.edu); Rogoff: Economics Depart ment, 216 Littauer Center, Harvard University, CambridgeMA 02138–3001 (e-mail: krogoff@harvard.edu). Theauthors would like to thank Olivier Jeanne and Vincent R.Reinhart for helpful comments.1In this paper “public debt” refers to gross centralgovernment debt. “Domestic public debt” is governmentdebt issued under domestic legal jurisdiction. Public debtdoes not include debts carrying a government guarantee.Total gross external debt includes the external debts of allbranches of government as well as private debt that is issuedby domestic private entities under a foreign jurisdiction.2Reinhart and Rogoff (2009a, b) demonstrate that theaftermath of a deep financial crisis typically involves aprotracted period of macroeconomic adjustment, particularly in employment and housing prices. On average, publicdebt rose by more than 80 percent within three years aftera crisis.573
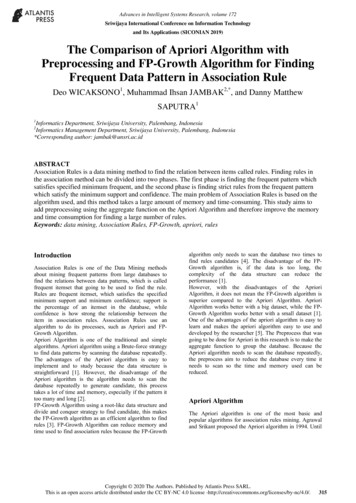
574AEA PAPERS AND PROCEEDINGS2007 2SpainUSCrisis country averageNorway175.1(increase of 75%)9China21Thailand29MexicoThis general rise in public indebtedness stands instark contrast to the 2003–2006 period of public deleveraging in many countries and owes todirect bailout costs in some countries, the adoption of stimulus packages to deal with the globalrecession in many countries, and marked declinesin government revenues that have hit advancedand emerging market economies alike.II. Debt, Growth, and le4Germany44Japan182Brazil46KoreaAverage for others6222AustraliaIndia84MAY 201032120 (increase of 20%)4149Figure 1. Cumulative Increase in Real Public DebtSince 2007, Selected CountriesNote: Unless otherwise noted these figures are for centralgovernment debt deflated by consumer prices.Sources: Prices and nominal GDP from InternationalMonetary Fund, World Economic Outlook. For a completelisting of sources for government debt, see Reinhart andRogoff (2009b).deleveraging of debts, normal after a financialcrisis. Not surprisingly, such episodes are associated with very slow growth and deflation.I. The 2007–2009 Global Buildup in Public DebtFigure 1 illustrates the increase in (inflationadjusted) public debt that has occurred since2007. For the five countries with systemic financial crises (Iceland, Ireland, Spain, the UnitedKingdom, and the United States), average debtlevels are up by about 75 percent, well on track toreach or surpass the three year 86 percent benchmark that Reinhart and Rogoff (2009a,b), findfor earlier deep postwar financial crises. Even incountries that did not experience a major financial crisis, debt rose by an average of about 20percent in real terms between 2007 and 2009.33Our focus on gross central government debt owes tothe fact that time series of broader measures of governmentThe nonlinear effect of debt on growth isreminiscent of “debt intolerance” (Reinhart,Rogoff, and Miguel A. Savastano 2003) andpresumably is related to a nonlinear responseof market interest rates as countries reach debttolerance limits. Sharply rising interest rates,in turn, force painful fiscal adjustment in theform of tax hikes and spending cuts, or, insome cases, outright default. As for inflation,an obvious connection stems from the fact thatunanticipated high inflation can reduce thereal cost of servicing the debt. Of course, theefficacy of the inflation channel is quite sensitive to the maturity structure of the debt. Inprinciple, the manner in which debt builds upcan be important. For example, war debts arearguably less problematic for future growthand inflation than large debts that are accumulated in peacetime. Postwar growth tendsto be high as wartime allocation of manpowerand resources funnels to the civilian economy.Moreover, high wartime government spending,typically the cause of the debt buildup, comesto a natural close as peace returns. In contrast,a peacetime debt explosion often reflects unstable political economy dynamics that can persistfor very long periods.Here we will not attempt to determine the genesis of debt buildups but instead simply look attheir connection to average and median growthand inflation outcomes. This may lead us, if anything, to understate the adverse growth implications of debt burdens arising out of the currentcrisis, which was clearly a peacetime event.debt are not available for many countries. Of course, thetrue run-up in debt is significantly larger than stated here,at least on a present value actuarial basis, due to the extensive government guarantees that have been conferred on thefinancial sector in the crisis countries and elsewhere, wherefor example deposit guarantees were raised in 2008.
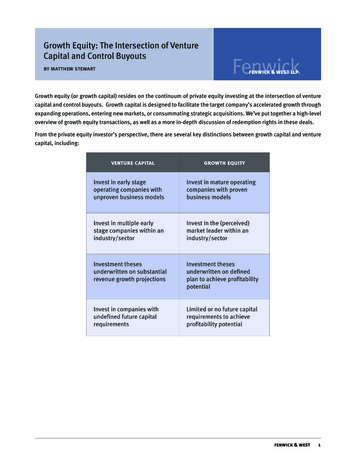
Growth in a Time of DebtVOL. 100 NO. 25.06GDP growth (bars, left axis)5.54.0GDP growthInflation(line, right axis)3.0542.0Inflation4.53.51.030.0Average MedianDebt/GDPbelow 30%Average MedianDebt/GDP30 to 60%Average MedianDebt/GDP60 to 90%Average MedianDebt/GDPabove 90% 1.02.52Figure 2. Government Debt, Growth, and Inflation:Selected Advanced Economies, 1946–2009Notes: Central government debt includes domestic andexternal public debts. The 20 advanced economies includedare Australia, Austria, Belgium, Canada, Denmark,Finland, France, Germany, Greece, Ireland, Italy, Japan,Netherlands, New Zealand, Norway, Portugal, Spain,Sweden, the United Kingdom, and the United States. Thenumber of observations for the four debt groups are: 443for debt/GDP below 30 percent; 442 for debt/GDP 30 to 60percent; 199 observations for debt/GDP 60 to 90 percent;and 96 for debt/GDP above 90 percent. There are 1,180observations.Sources: International Monetary Fund, World EconomicOutlook, OECD, World Bank, Global DevelopmentFinance, and Reinhart and Rogoff (2009b) and sourcescited therein.A. Evidence from Advanced CountriesFigure 2 presents a summary of inflation andGDP growth across varying levels of debt for 20advanced countries over the period 1946–2009.This group includes Australia, Austria, Belgium,Canada, Denmark, Finland, France, Germany,Greece, Ireland, Italy, Japan, Netherlands, NewZealand, Norway, Portugal, Spain, Sweden, theUnited Kingdom, and the United States. Theannual observations are grouped into four categories, according to the ratio of debt to GDPduring that particular year as follows: years whendebt to GDP levels were below 30 percent (lowdebt); years where debt/GDP was 30 to 60 percent (medium debt); 60 to 90 percent (high); and575above 90 percent (very high). The bars in Figure2 show average and median GDP growth foreach of the four debt categories. Note that of the1,186 annual observations, there are a significantnumber in each category, including 96 above 90percent. (Recent observations in that top bracketcome from Belgium, Greece, Italy, and Japan.)From the figure, it is evident that there is noobvious link between debt and growth until public debt reaches a threshold of 90 percent. Theobservations with debt to GDP over 90 percenthave median growth roughly 1 percent lower thanthe lower debt burden groups and mean levels ofgrowth almost 4 percent lower. (Using laggeddebt does not dramatically change the picture.)The line in Figure 2 plots the median inflation forthe different debt groupings—which makes plainthat there is no apparent pattern of simultaneousrising inflation and debt.Table 1 provides detail on the growth experience for individual countries, but over a muchlonger period, typically one to two centuries.Interestingly, introducing the longer time-seriesyields remarkably similar conclusions. Over thepast two centuries, debt in excess of 90 percenthas typically been associated with mean growthof 1.7 percent versus 3.7 percent when debt islow (under 30 percent of GDP), and comparedwith growth rates of over 3 percent for the twomiddle categories (debt between 30 and 90 percent of GDP). Of course, there is considerablevariation across the countries, with some countries such as Australia and New Zealand experiencing no growth deterioration at very high debtlevels. It is noteworthy, however, that those highgrowth high-debt observations are clustered inthe years following World War II.B. Evidence from Emerging Market CountriesWe next perform the same exercise for 24emerging market economies for the periods1946–2009 and 1900–2009, using comparablecentral government debt data to those we usedfor the advanced economies.4 Perhaps surprisingly, the results illustrated in Figure 2 andTable 1 for advanced economies are repeatedfor emerging market economies. The emerging4While we have pre-1900 inflation, real GDP, and publicdebt data for many emerging markets, nominal GDP data isharder to find.
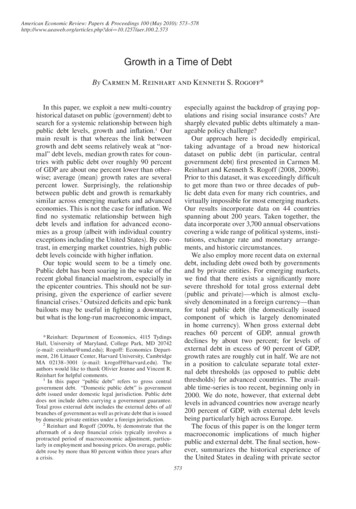
576MAY 2010AEA PAPERS AND PROCEEDINGSTable 1—Real GDP Growth as the Level of Government Debt Varies:Selected Advanced Economies, 1790–2009(annual percent change)Central (federal) government debt/GDPBelow 30percent30 to 60percent60 to .3n.a.2.52.40.70.72.03.6n.a.n.a.2.2n.a.1.8 eIrelandItalyJapanNetherlandsNew ZealandNorwayPortugalSpainSwedenUnited KingdomUnited StatesAverageMedianObservations 90 percentand aboveNotes: An n.a. denotes no observations were recorded for that particular debt range. Thereare missing observations, most notably during World War I and II years; further details areprovided in the data appendices to Reinhart and Rogoff (2009b) and are available from theauthors. Minimum and maximum values for each debt range are shown in bolded italics.Sources: There are many sources; among the more prominent are: International MonetaryFund, World Economic Outlook, OECD, World Bank, Global Development Finance. Extensiveother sources are cited in Reinhart and Rogoff (2009).market equivalents of Figure 2 and Table 1 arenot reproduced here (to economize on space),but the interested reader is referred to theNBER working paper version of this paper.For 1900–2009, for example, median and average GDP growth hovers around 4–4.5 percentfor levels of debt below 90 percent of GDP, butmedian growth falls markedly to 2.9 percentfor high debt (above 90 percent); the decline iseven greater for the average growth rate, whichfalls to 1 percent. With much faster populationgrowth than the advanced economies’, the implications for per capita GDP growth are in line (orworse) with those shown for advanced economies. The similarities with advanced economiesend there, as higher debt levels are associatedwith significantly higher levels of inflation inemerging markets. Median inflation more thandoubles (from less than seven percent to 16 percent) as debt rises from the low (0 to 30 percent)range to above 90 percent. Fiscal dominance is aplausible interpretation of this pattern.Because emerging markets often depend somuch on external borrowing, it is interesting tolook separately at thresholds for external debt(public and private). In Figure 3, we highlightthe connection between gross external debt asreported by the World Bank and growth andinflation. As one can see, the growth thresholdsfor external debt are considerably lower than thethresholds for total public debt. Growth deteriorates markedly at external debt levels over
Growth in a Time of DebtVOL. 100 NO. 25.5GDP growth (bars, left axis)4.5Inflation(line, right axis)17161514InflationGDP growth3.52.5131.5120.5 0.5Average MedianDebt/GDPbelow 30%AverageMedianDebt/GDP30 to 60%AverageMedianDebt/GDP60 to 90%AverageMedianDebt/GDPabove 90% 1.51110Figure 3. External Debt, Growth, and Inflation:Selected Emerging Markets, 1970-2009Notes: The 20 emerging market countries included areArgentina, Bolivia, Brazil, Chile, China, Colombia, Egypt,India, Indonesia, Korea, Malaysia, Mexico, Nigeria, Peru,Philippines, South Africa, Thailand, Turkey, Uruguay, andVenezuela. The number of observations for the four debtgroups are: 252 for debt/GDP below 30 percent; 309 fordebt/GDP 30 to 60 percent; 120 observations for debt/GDP60 to 90 percent; and 74 for debt/GDP above 90 percent.There is a total of 755 annual observations.Sources: International Monetary Fund, World EconomicOutlook, World Bank, Global Development Finance, andReinhart and Rogoff (2009b) and sources cited therein.60 percent, and further still when external debtlevels exceed 90 percent, which record outrightdeclines. In light of this, it is more understandable that over one half of all defaults on externaldebt in emerging markets since 1970 occurred atlevels of debt that would have met the Maastrichtcriteria of 60 percent. Inflation becomes significantly higher only for the group of observationswith external debt over 90 percent.III. Private Sector Debt: An IllustrationOur main focus has been on central government debt and, to a lesser degree, external publicand private debt, since reliable data on privatedomestic debts are much scarcer across countriesand time. We have argued here and elsewherethat a key legacy of a deep financial crisis israpidly expanding public debt. Furthermore, we577have shown that public levels of debt/GDP thatpush the 90 percent threshold are associated withlower median and average growth.5 These observations, however, present only a partial picture ofthe post-financial crisis landscape. Private debt,in contrast, tends to shrink sharply in the aftermath of a financial crisis. Just as a rapid expansion in private credit fuels the boom phase of thecycle, so does serious deleveraging exacerbate thepost-crisis downturn. This pattern is illustrated inFigure 4, which shows the ratio of private debt toGDP for the United States for 1916–2009. Periodsof sharp deleveraging have followed periods oflower growth and coincide with higher unemployment. In varying degrees, the private sector(households and firms) in many other countries(notably both advanced and emerging Europe)are also unwinding the debt built up during theboom year. Thus, private deleveraging may beanother legacy of the financial crisis that maydampen growth in the medium term.IV. Concluding RemarksThe sharp run-up in public sector debt willlikely prove one of the most enduring legacies of the 2007–2009 financial crises in theUnited States and elsewhere. We examine theexperience of 44 countries spanning up to twocenturies of data on central government debt,inflation and growth. Our main finding is thatacross both advanced countries and emergingmarkets, high debt/GDP levels (90 percent andabove) are associated with notably lower growthoutcomes. Much lower levels of external debt/GDP (60 percent) are associated with adverseoutcomes for emerging market growth. Seldomdo countries “grow” their way out of debts. Thenonlinear response of growth to debt as debtgrows towards historical boundaries is reminiscent of the “debt intolerance” phenomenondeveloped in Reinhart, Rogoff, and Savastano(2003). As countries hit debt tolerance ceilings,market interest rates can begin to rise quite suddenly, forcing painful adjustment.Of course, there are other vulnerabilitiesassociated with debt buildups, particularly ifgovernments try to mitigate servicing costs by5It is important to note that post-crises increases in public debt do not necessarily push economies into the vulnerable 90 debt/GDP range.
578MAY 2010AEA PAPERS AND PROCEEDINGSMedianunemployment rate3201916–1939 1946–2009Years with debt/GDP declinesAll other yearsPercent2709.86.77.25.5220170Flow of funds12070Historical statisticsof the United States201916 1921 1926 1931 1936 1941 1946 1951 1956 1961 1966 1971 1976 1981 1986 1991 1996 2001 2006Figure 4. United States: Private Debt Outstanding, 1916–2009(end-of-period stock of debt as a percent of GDP)Note: Data for 2009 is end-of-June.Sources: Historical Statistics of the United States, Flow of Funds, Board of Governors of theFederal Reserve, International Monetary Fund, World Economic Outlook, OECD, World Bank,Global Development Finance, and Reinhart and Rogoff (2009b) and sources cited therein.shortening the maturing structure of debt. AsReinhart and Rogoff (2009b) emphasize andnumerous models suggest, countries that chooseto rely excessively on short-term borrowing tofund growing debt levels are particularly vulnerable to crises in confidence that can provokevery sudden and “unexpected” financial crises.At the very minimum, this would suggest thattraditional debt management issues should be atthe forefront of public policy concerns.REFERENCESReinhart, Carmen M., and Kenneth S. Rogoff.2008. “The Forgotten History of DomesticDebt.” National Bureau of Economic ResearchWorking Paper 13946.Reinhart, Carmen M., and Kenneth S. Rogoff.2009a. “The Aftermath of Financial Crises.” American Economic Review, 99(2):466–72.Reinhart, Carmen M., and Kenneth S. Rogoff.2009b. This Time Is Different: Eight Centuriesof Financial Folly. Princeton, NJ: PrincetonUniversity Press.Reinhart, Carmen M., Kenneth S. Rogoff, andMiguel A. Savastano. 2003. “Debt Intoler-ance.” Brookings Papers on Economic Activity (1), ed. William C. Brainard and George L.Perry, 1–62.
search for a systemic relationship between high public debt levels, growth and inflation.1 Our main result is that whereas the link between growth and debt seems relatively weak at "nor-mal" debt levels, median growth rates for coun-tries with public debt over roughly 90 percent of GDP are about one percent lower than other-