Transcription
Wu et al. Translational 9-0159-7(2019) 8:18RESEARCHOpen AccessDihydromyricetin and Salvianolic acid Binhibit alpha-synuclein aggregation andenhance chaperone-mediated autophagyJia-Zhen Wu1,6, Mustafa Ardah2, Caroline Haikal3, Alexander Svanbergsson3, Meike Diepenbroek3,Nishant N. Vaikath3,4, Wen Li3, Zhan-You Wang5, Tiago F. Outeiro7,8, Omar M. El-Agnaf4 and Jia-Yi Li1,3,5*AbstractBackground: Progressive accumulation of α-synuclein is a key step in the pathological development of Parkinson’sdisease. Impaired protein degradation and increased levels of α-synuclein may trigger a pathological aggregation invitro and in vivo. The chaperone-mediated autophagy (CMA) pathway is involved in the intracellular degradationprocesses of α-synuclein. Dysfunction of the CMA pathway impairs α-synuclein degradation and causes cytotoxicity.Results: In the present study, we investigated the effects on the CMA pathway and α-synuclein aggregation usingbioactive ingredients (Dihydromyricetin (DHM) and Salvianolic acid B (Sal B)) extracted from natural medicinalplants. In both cell-free and cellular models of α-synuclein aggregation, after administration of DHM and Sal B, weobserved significant inhibition of α-synuclein accumulation and aggregation. Cells were co-transfected with a Cterminal modified α-synuclein (SynT) and synphilin-1, and then treated with DHM (10 μM) and Sal B (50 μM) 16hours after transfection; levels of α-synuclein aggregation decreased significantly (68% for DHM and 75% for Sal B).Concomitantly, we detected increased levels of LAMP-1 (a marker of lysosomal homeostasis) and LAMP-2A (a keymarker of CMA). Immunofluorescence analyses showed increased colocalization between LAMP-1 and LAMP-2Awith α-synuclein inclusions after treatment with DHM and Sal B. We also found increased levels of LAMP-1 andLAMP-2A both in vitro and in vivo, along with decreased levels of α-synuclein. Moreover, DHM and Sal B treatmentsexhibited anti-inflammatory activities, preventing astroglia- and microglia-mediated neuroinflammation in BAC-αsyn-GFP transgenic mice.Conclusions: Our data indicate that DHM and Sal B are effective in modulating α-synuclein accumulation andaggregate formation and augmenting activation of CMA, holding potential for the treatment of Parkinson’s disease.Keywords: chaperone-mediated autophagy, macroautophagy, alpha-synuclein, protein aggregation, Parkinsondisease, lysosomal-associated membrane proteinBackgroundAberrant degradation of alpha-synuclein (α-syn) hasbeen implicated in the pathogenesis of Parkinson’s disease (PD) which leads to accumulation of α-syn in Lewybodies [1, 2]. α-Syn can be selectively translocated intolysosomes for degradation via chaperone-mediated* Correspondence: lijiayi@cmu.edu.cn; jia-yi.li@med.lu.se1Institute of Neuroscience, College of Life and Health Sciences, NortheasternUniversity, Shenyang, Liaoning, China3Neural Plasticity and Repair Unit, Wallenberg Neuroscience Center,Department of Experimental Medical Science, BMC A10, 221 84 Lund,SwedenFull list of author information is available at the end of the articleautophagy (CMA), a highly regulated cellular processthat mediates the degradation of cytosolic proteins in lysosomes [3–6]. The protein contains a CMA target motifand is degraded by CMA in neural cells [7, 8]. CMA iscontrolled by two key CMA regulators: the chaperoneHSC70 and the receptor lysosomal-associated membrane protein 2A (LAMP 2A). LAMP-1 is highly structurally homologous to LAMP-2A suggesting that theremay be an overlapping function of these two proteins [9,10]. HSC70 binds to protein substrates containing aKFERQ peptide motif [8, 11]. The substrate–HSC complex interacts with LAMP-1/2A for targeting of The Author(s). 2019 Open Access This article is distributed under the terms of the Creative Commons Attribution 4.0International License (http://creativecommons.org/licenses/by/4.0/), which permits unrestricted use, distribution, andreproduction in any medium, provided you give appropriate credit to the original author(s) and the source, provide a link tothe Creative Commons license, and indicate if changes were made. The Creative Commons Public Domain Dedication o/1.0/) applies to the data made available in this article, unless otherwise stated.
Wu et al. Translational Neurodegeneration(2019) 8:18identified protein translocation to the lysosome [12–15].In addition, the ubiquitin-proteasome system (UPS) andmacroautophagy are also involved in α-syn degradation[16–18].Several studies have been conducted on the development of small molecular inhibitors of α-syn aggregationfor the prevention and treatment of PD [19–23]. Severalimportant compounds in the daily diet and medicinalplants have been found to be protective against α-synfibrillation [21, 24]. Dihydromyricetin (DHM), a majoractive ingredient of flavonoid compounds extracted fromthe stems and leaves of Ampelopsis grossedentata, hasanti-tumor, oxidation resistance and free radical scavenging capabilities [25–28]. Evidence indicates that DHMhas neuroprotective effects by enhancing the formationof autophagosomes and inducing autophagy [29–31].Salvianolic acid B (Sal B) is one of the bioactive compounds of Salvia miltiorrhiza Bunge extracted from theroot of Salvia miltiorrhiza and has been shown to exertvarious anti-oxidative and anti-inflammatory effects inboth in vitro and in vivo studies [23, 32, 33]. Sal B hasrecently been associated with preventing fibril aggregation of amyloid proteins and inhibiting neuroinflammation, thereby improving neurological function in animalmodels of neurodegenerative diseases [23, 24]. However,it is not clear whether DHM and Sal B have any effectson α-syn accumulation and aggregation in synucleinopathies, such as PD.To further explore the role of CMA mediated degradation of aggregated α-syn and the potential function ofautophagy regulated by DHM and Sal B, in the presentstudy, we have investigated the effects of DHM and Sal Bon α-syn accumulation and aggregation using both invitro and in vivo models. We observed that DHM and SalB upregulated the CMA associated protein LAMP-2A andits homologous protein, LAMP-1, decreased levels of αsyn, reduced cytotoxicity and inhibited inflammatory responses when administered in cell and animal models.Our findings indicate that DHM and Sal B are potentialtherapeutic compounds that can intervene and halt pathological developments in synucleinopathies.MethodsFibril preparationα-Syn monomers were ordered from Proteos (RP-003)and prepared following the Michael J Fox Foundationsguidelines for fibril formation. Briefly, monomeric protein was thawed and spun at 15.000xg for 10 min at 4 C, to pellet any aggregated materials. The supernatantwas then assessed by BCA to determine the α-syn concentration. The monomer sample was diluted to 5 mg/ml in PBS without calcium and magnesium, and transferred to a 1.5 ml Eppendorf tube, then incubated for 7days in a shaking incubator at 1000 rpm and 37 C. FinalPage 2 of 15fibril solution was stored at -80 C in single use aliquotsuntil use.Inhibitor modulation of α-synuclein aggregation kineticsAggregation kinetics were assessed in Corning NBS halfarea micro plates(#3881) plates using 70 μM α-synmonomers, 20 μM thioflavin T (Sigma, T3516) and Sal B(Sigma, SML0048, 94% (HPLC) ) or DHM (Sigma,SML0295, 98% (HPLC) ) at either 15 or 30 μM. Vehiclecontrol wells were set up using a volume equal to that ofthe highest inhibitor concentration (0,015 μl per well).To initiate the experiment, sonicated α-syn seeds wereadded to each well at 0.1% of the monomer concentration (70 nM). Kinetics were observed using a BMGFLUOstar Omega plate reader, allowing continual measurements for 7 days at 37 C. Baseline acquisition wasperformed for 3 hours before addition of the α-synseeds, and recordings were continued for 12 hours.Cell culture and transfectionH4 neuroglioma cells from human (origin) were culturedin Opti-MEM GlutaMAX (Invitrogen, 51985-034)supplemented with 10% fetal bovine serum (FBS; Gibco,10100-147) at 37 C, passaged, and plated on chamberslides (Labted-II, Nalgen-Nunc, 154526) or glass coverslips. For intracellular α-syn aggregation experiments,H4 cells were seeded in 24-well plate (5 104 cells/well)24 h prior to transient transfection with SynT (C-terminal tagged form of WT α-syn) and synphilin-1 (Fig.S1). Equi-molar ratios of plasmids were mixed withFuGENE 6 (Promega, E2691) at a 1:2 mass volume ratio, and incubated for 15 min before the complex oftransfection reagent and plasmids was transfected intocells according to the manufacturer’s protocol (2 htransfection and 6 h recovery time). ALP modifiers wereincubated during the last 24 h before fixation and processing for immunocytochemistry and toxicity assessments. Co-transfection with an empty backbone-vector[pPAGFP-C1, Addgene, 11910] and mock transfectionwas used as control. Rapamycin (200 ng/ml, Sigma Aldrich, R0395) was prepared in DMSO, chloroquine diphosphate salt (50 mM, CQ, Sigma Aldrich, C6628) and3-methyladenine (10 mM, 3-MA, Sigma Aldrich,M9281) in water.ImmunocytochemistryFor drug treatment, 24 h post first transfection withSynT and synphilin-1, cells were further incubated withDHM, Sal B, Rapamycin or Chloroquine. Twenty-fourhours later, cells were fixed with 4% PFA for 10 min atroom temperature (RT), washed two times with PBS andsubjected to immunocytochemistry analysis. Briefly, cellswere permeabilized with 0.5% Triton X-100 in PBS for20 min at RT, blocked for 1 h at RT with 5% normal
Wu et al. Translational Neurodegeneration(2019) 8:18donkey serum in 0.1% Triton X-100 in PBS, incubatedwith primary antibody (mouse anti-α-syn 1:1000; BDBiosciences) at 4 C overnight followed by secondaryantibody incubation (1:1000, donkey anti-mouse IgGAlexa568, Jackson ImmunoResearch) for 2 h at RT, thenincubated for 10 min with DAPI 1:1000 in PBS(SIGMA-ALDRICH). Specimen analyses were performedwith a conventional epifluorescence microscope (NikonNi-E). Cells were subjected to microscopy analysis forLAMP-1/-2A and α-syn colocalization using laserconfocal microscope (Leica TCS SP8), followed by analysis using ImageJ software. Sequential multi-trackframes were acquired to avoid any potential crosstalkfrom adjacent fluorophore. For ThS labeling, transfectedH4 cells were fixed and incubated prior to IF labelingfor 10 min in 0.5 mg/ml thioflavin-S (Sigma, T1892),and washed in 85% absolute ethanol. At least 300 cellsfrom three independent wells were assessed for each experiment and the number of cells containing α-syn positive aggregates were quantified in the transfectionconditions by a random sampling survey. The percentage of the transfected cells containing α-syn positive aggregates compared with the total number was thenrecorded.Immunohistochemistry of transgenic miceSix- and nine-month old mice were housed (3-4 animals/cage) with food and water available ad libitumunder a 12-h light/dark cycle. All animal experimentsfollowed the Institutional Animal Care and all procedures were performed under the specifications set by theEthical Committee for Use of laboratory animals at LundUniversity, Sweden and at Northeastern University,China. Homozygous transgenic mice expressing WT human α-syn fused to green fluorescent protein (GFP),under control of the mouse α-syn promoter show anoverexpression of α-syn-GFP in the CS and the dopaminergic neurons of the SNpc. The formation of α-synaggregates in the brain of transgenic mice has beenshown to rise with increasing age [34]. DHM and Sal B(10mg/kg/day for two weeks) were utilized for intraperitoneal administration of nine-month old mice (n 8mice per group). Mice were then euthanized 6 weekslater. Brains were removed, post-fixed in 4% PFA and agradient sucrose sedimentation (10% - 30%) was performed. For mouse brains, 30 micrometer-thick freefloating coronal sections were cut on a freezing microtome (Leica, SM2010R), blocked in solution comprisingPBS 5% horse serum 0.25% Triton-X 100, and incubated with primary antibodies (mouse-anti-α-syn antibody 1:1000, Santa Cruz Biotechnology, sc-12767;mouse-anti-GFAP antibody 1:1000, MERCK MILLIPORE, MAB360; mouse-anti-Iba1/AIF1 antibody 1:1000,MERCK MILLIPORE, MABN92) overnight in a humidPage 3 of 15chamber at 4 C. Sections (incubated with anti-α-syn,anti-GFAP and anti-Iba1/AIF1) were then subsequentlyincubated with secondary biotinylated anti-mouse antibody (Vector Biolabs) followed by DAB staining usingthe ABC kit (Vector Biolabs) and DAB peroxidase substrate (Vector Biolabs) according to the manufacturer’sprotocol. For each animal, 3 sections were analyzed andall sections were processed under the same standardizedconditions. α-Syn , GFAP and Iba1 cells in the CS andSNpc were counted on a Nikon microscope using theNIS-Elements BR imaging system.Western blot analysisCytosolic fractions were obtained by manualhomogenization and incubation in ice-cold lysis buffercontaining 25 mM TRIS-HCl pH 7.4, EDTA 1 mM, protease inhibitor 0.1% SDS for 2 h, followed by centrifugation at 12000 rpm for 10 min. In the supernatant,equivalent amounts of LAMP-1/-2A protein samplewere loaded and separated by 8% SDS-PAGE gels, andtransferred to polyvinylidene difluoride (PVDF) membranes (Millipore) for 2 h at 4 C or overnight at 4 C.Membranes were blocked with 2.5% nonfat milk solutionin Tris-buffered saline with 0.1% Triton X-100 (TBST)for 1 h, and then incubated overnight at 4 C with mouseanti-LAMP-1 (Abcam, ab25630, 1:1000), rabbit antiLAMP-2A (Abcam, ab18528, 1:1000) or mouse anti-βactin (Sigma, A1978, 1:5000,), followed by HRP-linkedsecondary antibodies (CST, 7076S for anti-mouse IgGand 7074S for anti-rabbit IgG, 1:10000,) for 2 h at RT.Bands were detected using an ECL detection kit (CellSignaling Technology) and exposed to X-ray films.Bands were analyzed and normalized to the corresponding β-actin signal for comparison.Cytotoxicity assaysCell viability and α-syn cytotoxicity was evaluated by theMTT assay and LDH assay. H4 cells were plated on 96well plates in complete medium, transfected with SynTand synphilin-1, then co-transfected with a plasmid encoding for WT α-syn, or with empty plasmid. For theMTT assay, 10 μl MTT reagent and 100 μl detergent reagent were added into each well in sequence after incubation for twenty-four hours. The resulting intracellularpurple formazan can be solubilized and quantified byspectrophotometric means. For the LDH assay, aftertwenty-four hours transfection, culture media were collected and used to determine the levels of released Lactate dehydrogenase (LDH). After treatment, assays wereperformed following the manufacturer’s instructions(Promega, Madison, WI, USA). Results were expressedas the percentage of cell death.
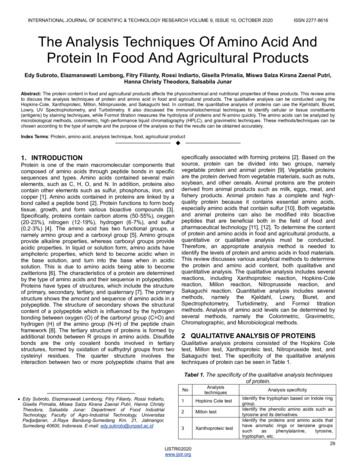
Wu et al. Translational Neurodegeneration(2019) 8:18Open Field AssayExploratory/locomotor activity of the animals (six-monthold and nine-month-old, n 8 mice per group) was assessedin an open-field paradigm equipped with a video trajectoryanalysis system (42 42 36 cm [d w h] plexiglassboxes) and analyzed using Smart 3.0 software (Panlab,Span). The mice were first allowed to explore the confinedarena for 15 min during each session, then their performance was recorded and ambulatory locomotor activity wasmeasured by offline analysis. Track paths were subsequently analyzed by an automatic system to assess the following parameters: distance traveled (cm), time spent inthe various sections of the arena and number of rears.Data analysis and statisticsStatistical analyses were performed using Prism 6(GraphPad Software). All data shown are representativefrom a minimum of three independent experiments unless otherwise stated. Statistical analysis for comparisonof groups in the in vitro experiments was performedusing the Student’s t-test. For both in vitro and in vivoexperiments, statistical significance of difference between groups was determined by the 2-tailed unpairedStudent t test of the means. Where values have beencompared with the normalized control, a one-sample ttest was used. In cases of multiple-group comparisons, aone-way ANOVA was used, with Scheffe’s post hoc testwhere values have been compared with the control.ResultsAggregation kinetics of α-synuclein in the presence of SalB and DHMWe first studied the aggregation kinetics of α-syn in thepresence of Sal B and DHM in increasing concentrationsusing the thioflavin T (ThT) fluorescence assay. ThT canbind to the β-sheet structure of α-syn and changes in thefluorescence signal of this dye are used to monitor the formation of α-syn fibrils. The inhibiting effects of Sal B orDHM on the aggregation kinetics of α-syn were monitored by starting the fibrillation process in the absenceand presence of Sal B or DHM while continually measuring the ThT fluorescence from the fibrillation processusing the plate-based assays with ThT dye (Fig. 1). Following addition of pre-formed fibrils (PFF) of α-syn, an increase in the ThT fluorescence indicates α-syn conversionfrom monomer to β-sheet rich aggregates (Fig. 1a, b). Theresults suggest that Sal B and DHM can effectively inhibitα-syn aggregation in a concentration-dependent manner(10μM and 50 μM for both Sal B and DHM).Alterations of CMA markers in an in vitro model of αsynuclein aggregation.In order to study alterations in α-syn aggregationin vitro, we performed a co-transfection of SynT andPage 4 of 15synphilin-1 in human neuroglioma cells (H4 cells) for atleast 48 h, leading to α-syn aggregation [35] (Additionalfile 1). As we reported previously, in this aggregationmodel we detected many large α-syn aggregates incontrast to wild-type (WT) α-syn transfected cells,where diffuse α-syn was present in the cytoplasm(Additional file 1Bi, Ci). In addition, the cells transfected with SynT exhibited large ThS positive aggregates, implying that α-syn aggregates consist of atypical β-sheet conformation in the cells (Additionalfile 1Bii). Small and diffused α-syn positive structureswere also found in each model but were not ThSpositive (Additional file 1Cii), in agreement with ourprevious findings [36].To further study the effects of DHM and Sal B on αsyn aggregate-degradation in the cells, we used an H4cell model expressing SynT-aggregation. First, we performed an MTT assay in a dose-dependent manner tooptimize the doses of DHM and Sal B. The optimaldoses were selected as 10 μM and 50 μM for DHM andSal B, respectively (Fig. 2a) and the optimal treatmenttime for both DHM and Sal B was 16 h (data notshown). Morphological analysis of immuno-labeled αsyn-positive structures revealed that larger inclusions (25 μm in diameter or larger, Fig.2b) were found in untreated cells than that in DHM or Sal B treated cells (1μm in mean diameter, Fig. 2c, d and e). Quantitativeanalysis of CMA marker expression in the SynTaggregation model by SDS-PAGE and Western blottingrevealed that LAMP-1 and LAMP-2A were significantlyincreased in DHM and Sal B treated cells compared tothe cells with empty vector, SynT and WT α-syn transfection (Fig. 3a, b and c), while the expression levels ofα-syn were significantly reduced by treatment withDHM and Sal B (Fig. 3a, d). No significant differencesfor WT α-syn levels were found in any of the cell modelsexcept for the SynT-aggregation model (Fig. 3a, d and e).Rapamycin can inhibit the mammalian target of rapamycin (mTOR) pathway and can activate the autophagylysosome pathway (ALP) [37]. Chloroquine (CQ) can reduce the fusion of autophagosomes with lysosomes andinhibit the ALP [38]. Therefore, we treated cells expressing SynT with either rapamycin or CQ as positive andnegative controls, respectively. We found that the expression pattern of WT α-syn, SynT, LAMP-1 andLAMP-2A were similar in rapamycin treated cells and inDHM and Sal B treated cells. In CQ treated cells, thelevels of WT α-syn, LAMP-1 and LAMP-2A were significantly reduced and the levels of SynT were significantly increased as compared to the DHM and Sal Btreated cells (p 0.05, Fig. 3). In order to test the involvement of DHM and Sal B in macroautophagy, we treatedthe SynT-transfected cells with 3-MA as an inhibitor ofmacroautophagy. The treatment with 3-MA alone
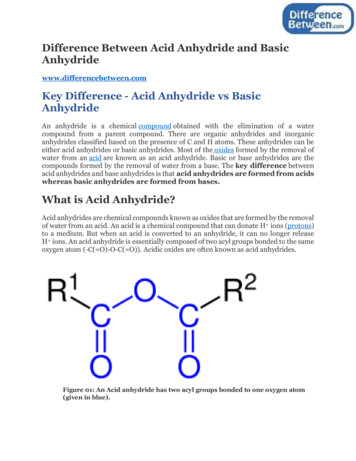
Wu et al. Translational Neurodegeneration(2019) 8:18Page 5 of 15Fig. 1 Sal B and DHM inhibit seeded aggregation of α-syn in a concentration dependent manner. Chemical structures of Sal B (a) and DHM (b)as used throughout the study. Seeded α-syn aggregation can be inhibited by addition of either Sal B (a) or DHM (b) in increasing concentrations.A baseline of ThT fluorescence was captured for both A and B for 3 hours. For both Sal B and DHM, a concentration of 1 μM slows theaggregation kinetics, while higher concentrations lead to a complete inhibition of aggregation process. Graphs are plotted as median of 3replicates ( 95% Confidence Interval)resulted in a reduction of LC3-II levels, whereas an increase in expression levels of LC3-II and LAMP-1/2Awas observed after DHM or Sal B treatment (Additionalfile 2). These findings suggest that DHM and Sal B leadto an up-regulation of the LC3-II and LAMP-2A proteins reflecting the involvement of CMA and macroautophagy after treatments with DHM and Sal B.Next, we examined the effects of DHM and Sal Bon α-syn aggregation and the interaction with LAMP1 and LAMP-2A. Interestingly, we observed that αsyn inclusions co-localized with LAMP-1 and LAMP2A in more defined regions in cells treated withDHM and Sal B (Fig. 4a, b and d), whereas the untreated cells showed much less co-localization between α-syn and LAMP-1 or LAMP-2A (Fig. 4d),suggesting a potential relationship between the α-syninclusions and the CMA pathway. Quantification ofthe signals of α-syn and LAMP-1/-2A revealed thatDHM and Sal B treatments increased the levels ofLAMP-1/-2A and mitigated α-syn aggregation. Quantification of the mean fluorescence intensity revealeda significant increase of around 60%-70% for LAMP1 ( 75% 10.5% SEM for DHM treated group; 58% 9.8% SEM for Sal B treated group) andLAMP-2A ( 63% 10.5% SEM for DHM treatedgroup; 52% 8.7% SEM for Sal B treated group)levels in the lysates of SynT-aggregation H4 cellscompared to the untreated group (Fig. 4c). The expression level of α-syn was reduced in the DHM andSal B treated cells (by 77% 14.1% SEM for DHMtreated group; 68% 11.8% SEM for Sal B treatedgroup) compared to the untreated group. Thus, thealtered levels of the lysosomal membranes (LAMP2A) support the association between α-syn aggregation and CMA pathway activation, particularly in response to DHM and Sal B administrations.
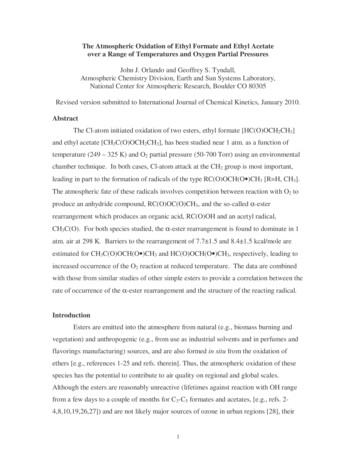
Wu et al. Translational Neurodegeneration(2019) 8:18Page 6 of 15Fig. 2 The effects of small molecule drugs on α-syn aggregation in H4 cells. (a) MTT assay was performed in a dose-dependent manner in SynTand synphilin 1 co-transfected H4 cells. IF labeling for α-syn (red) showed a greater quantity of large-sized aggregates in untreated cells (b) thanthat in DHM or Sal B treated cells (c, d, e). All data shown are representatives of at least three independent experiments (mean SD, *p 0.05,**p 0.01), Scale bar 5 μmCMA modulates α-synuclein aggregation and toxicity invitroThe findings above suggest that CMA modulation maybe a potential target for intervention in synucleinopathies. Thus, we investigated whether the effects of α-synaggregation and toxicity are regulated by CMA (Fig. 5).Although α-syn inclusions were present in approximately 50% of the SynT transfected H4 cells (Fig. 5a, c),the toxicity was not significantly increased comparedwith that observed in cells expressing WT α-syn (Fig.5b, d). Both DHM and Sal B treatments decreasedthe percentage of aggregate-containing cells (SynTtransfected H4 cells) from 52.1% ( 10.1% SEM) to18.2% ( 8.3% SEM, p 0.01, DHM) and 19.6% ( 6.7% SEM, p 0.01, Sal B), respectively, compared withrapamycin treated cells (to 33.8% 8.6% SEM, p 0.01) (Fig. 5e). This was paralleled by significant decreases in toxicity by 1.48-fold ( 0.28 SEM, DHM),1.65-fold ( 0.34 SEM, Sal B) and 1.78-fold ( 0.31SEM, rapamycin) compared to the SynT transfectionmodel (2.47 fold ( 0.32 SEM)) (Fig. 5f ). Thus, theseresults suggest that DHM and Sal B have ameliorativeeffects on α-syn aggregation and attenuate toxicity foraggregation-prone α-syn species.DHM and Sal B treatments activate CMA pathways anddegrade α-syn aggregates in vivo.To validate the effects of DHM and Sal B treatments invivo, we administered them to Bacterial ArtificialChromosome (BAC) transgenic mice, expressing WThuman α-syn fused to green fluorescent protein (GFP)under the control of the endogenous α-syn promoter[34]. We observed a widespread expression of α-synGFP in multiple brain regions, including the corpus striatum (CS) and substantia nigra pars compacta (SNpc).To study the effects of DHM and Sal B on mouse behavior, we assessed locomotor activity in an open field testusing 6 and 9-month-old mice. Upon administration ofDHM (10 mg/kg/day), Sal B (10 mg/kg/day) or vehiclefor two weeks, we did not observe any significant differences in ambulatory movements among the groups ofWT vs transgenic mice (treated with DHM, Sal B or vehicle) (Additional file 3). We then examined the expression of α-syn and LAMP-1/-2A in DHM and Sal B
Wu et al. Translational Neurodegeneration(2019) 8:18Page 7 of 15Fig. 3 Expression of LAMP-1 and LAMP-2A in α-syn transfected H4 cells. A control group without any transfection was performed as a ‘mock’while another group with an ordinary wildtype α-syn plasmid transfection was performed as ‘WT α-syn’. SynT and synphilin 1 co-transfectedgroup was performed as the experimental group with DHM, Sal B, Rapamycin or Chloroquine treatments. The expression levels of LAMP-1/-2A,SynT or endogenous α-syn were detected by Western blot (a). Quantitative analyses of α-syn (SynT) and LAMP-1/-2A normalized to β-actin (B-E)(n 5). Expression of LAMP-1 (b) and LAMP-2A (c) was significantly increased after treatment with DHM or Sal B, as compared with WT α-syntransfected cells, rapamycin treated cells or CQ treated cells (after normalization to untreated cells). (d) SynT levels were decreased in both DHMand Sal B treated cells as compared to the SynT-aggregation model or (CQ) treated cells. (e) WT α-syn expression levels were increased in DHM(10 μM) or Sal B (50 μM) treated cells as compared with the SynT-aggregation model. All data shown are representative of at least threeindependent experiments (mean SD, *p 0.05, **p 0.01)treated groups compared to the saline treated group inthe BAC-α-syn-GFP transgenic mice. Morphologicalanalyses with IF and immunohistochemical (IHC) preparations revealed that in the CS and SNpc, the levels ofα-syn-GFP (IF) (Fig. 6a-d, g-j) and α-syn (IHC) (Fig. 6e,f, k, l) significantly decreased upon administration ofDHM and Sal B, while the levels of LAMP-1 (Fig. 6a, b,g, h) and LAMP-2A (Fig. 6c, d, i, j) significantly increased, compared with the saline control group (p 0.05) (Fig. 6a-f, left column), suggesting that DHM (Fig.6a-f, middle column) and Sal B (Fig. 6A-F, right column)treatments activated CMA pathways in the brains oftransgenic mice. Furthermore, we found that LAMP-1,LAMP-2A and α-syn-GFP exhibited a co-localized
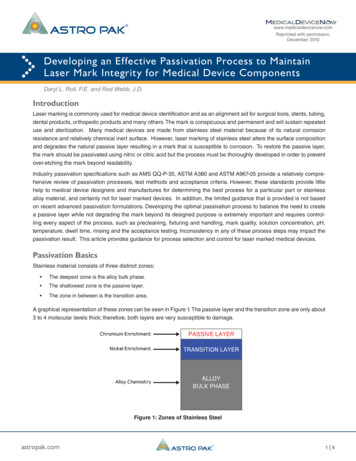
Wu et al. Translational Neurodegeneration(2019) 8:18Page 8 of 15Fig. 4 Drug effects on α-syn aggregates and co-localization of LAMP-1, LAMP-2A in the SynT-aggregation model. H4 cells were co-transfectedwith SynT and synphilin-1. (a-b) Cells were fixed 48 h post-transfection and subjected to IF for α-syn (red) and LAMP-1/-2A (green) followed byconfocal microscopic analysis. (c) LAMP-1 and LAMP-2A showed an increased expression level in SynT transfected H4 cells following treatmentwith DHM (10 μM, 48h) and Sal B (50 μM, 48h), compared to untreated cells. The fluorescence density levels of α-syn were decreased in DHMand Sal B treated cells compared with the control. (d) The co-localization levels of LAMP-1/-2A with α-syn in intracellular aggregates wereincreased in DHM and Sal B treated cells. All data shown are representative of at least three independent experiments (mean SD, *p 0.05, **p 0.01), Scale bar 5 μmdistribution in some subcellular compartments in theDHM and Sal B treated mice (Additional file 4), furtherindicating increased degradation of α-syn aggregates viathe CMA pathway.To further explore alterations of α-syn as well asLAMP-1 and LAMP-2A levels in BAC-α-syn-GFP transgenic mice, we performed SDS-PAGE and Western blotting (Fig. 7). We observed that levels of LAMP-1 andLAMP-2A were significantly up-regulated in DHM (Fig.7a, c) and Sal B treated mice (Fig. 7b, d) in the CS andSNpc compared to the saline treated group, whereaslevels of α-syn-GFP were significantly down-regulatedfollowing DHM and Sal B treatments. In addition, nochanges were observed in the levels of the endogenousmouse α-syn.DHM and Sal B treatment lead to decreased astrogliosisand microgliosis in vivoTo investigate the effects of DHM and Sal B on inflammatory responses in the CS and SNpc, we examined thedensity and quantity of activated Iba1- and GFAP- positive cells in the substantia nigra and the striatum afterDHM and Sal B treatments in BAC-α-syn-GFP transgenic mice. We observed a reduction in astrogliosis andmicrogliosis in both the CS and SNpc (Fig. 8a, b) byquantifying the number of activated astroglial cells andmicroglial cells as well as the astroglial and microglialdensity of IF staining results in BAC-α-syn-GFP transgenic mice (Fig. 8c, d). Quantification of the Iba1 (Fig.8e, f ) and GFAP (Fig. 8g, h) signal intensity of IHCstaining also revealed a deactivation of astroglia and
Wu et al. Translational Neurodegeneration(2019) 8:18Page 9 of 15Fig. 5 Molecules modulate the cytotoxicity of α-syn aggregation in cells transfected with WT α-syn or co-transfected with SynT and synphilin-1.Transfection with WT α-syn did not induce clear aggregat
Results: In the present study, we investigated the effects on the CMA pathway and α-synuclein aggregation using bioactive ingredients (Dihydromyricetin (DHM) and Salvianolic acid B (Sal B)) extracted from natural medicinal plants. In both cell-free and cellular models of α-synuclein aggregation, after administration of DHM and Sal B, we