Transcription
CHARTER SCHOOL OFFICE2017-18STATE CHARTER REPORT
2 Page
Table of ContentsReport Overview .4General Charter School Information .5Charter School Enrollment .6Revenue and Expenditure Comparison.8Charter School Performance Framework.16Academic Performance Data .16Charter School Academic Performance SY17/18.19Beyond the Achievement Data: Conclusions .23Organizational Performance Framework .242017-18 Overall Ratings - Organizational Performance Framework .25Beyond the Organizational Performance Framework Data: Conclusions .32Financial Performance Framework .332017-2018 Overall Financial Performance ratings .342017-2018 Near-Term Indicators .342017-2018 Sustainability Indicators .35Beyond the Financial Performance Framework Data: Conclusions .37Innovation and Collaboration .38Policy Recommendations.54Appendix A .553 Page
Report OverviewAs required by Del. C., Title 14, Ch. 5 § 514, the Department prepares an annual report for theGovernor, the General Assembly, and the State Board of Education on the success or failure ofcharter schools and proposes changes in state law necessary to improve or change the charterschool program. This report contains: a comparison of the per student expenditures of charter schools, considering all sourcesof such expenditures, with those of other public schools;recommendations relating to, and proposed changes relating to Delaware educationlaws, in light of the content of annual reports submitted pursuant to § 513 of this title;and,the assessment of specific opportunities and barriers relating to the implementation ofcharter schools' innovations in the broader Delaware public education school system.14 DE Admin. Code 275 further defines the requirements of this report to include an analysis ofall charter schools in relationship to the Performance Framework.4 Page
General Charter School InformationDuring the 2017/2018 school year, there were twenty-four charter schools in Delaware. Twentytwo of these charter schools were authorized by the Department of Education with the assent ofthe State Board of Education and two charter schools were authorized by the Red ClayConsolidated School District. The charter schools in operation during the 2017/2018 school yearare listed below along with the year that they opened:School NamePositive OutcomesEast Side Charter SchoolCampus Community Charter SchoolThomas Edison Charter SchoolSussex AcademyKuumba AcademyNewark Charter SchoolMOT Charter SchoolProvidence Creek AcademyAcademy of DoverFamily Foundations Charter SchoolDelaware Academy of Public Safety andSecurityLas Americas Aspira AcademyGateway Lab SchoolOdyssey Charter SchoolAcademia Antonio Alonso Charter SchoolEarly College High SchoolFirst State MontessoriDesign Thinking AcademyFirst State Military AcademyFreire Charter SchoolGreat Oaks Charter SchoolRed Clay SchoolsCharter School of WilmingtonDelaware Military AcademyDate OpenedSeptember 1996September 1997September 1998September 2000September 2000September 2001September 2001September 2002September 2002September 2003September 2006August 2011 (Closed as ofSeptember, 2018)August 2011August 2011August 2011August 2014August 2014August 2014August 2015August 2015August 2015August 2015September 1996September 2003*There are no new charter schools opening for school year 2018-2019. Sussex MontessoriSchool is scheduled to open in the fall of 2020.5 Page
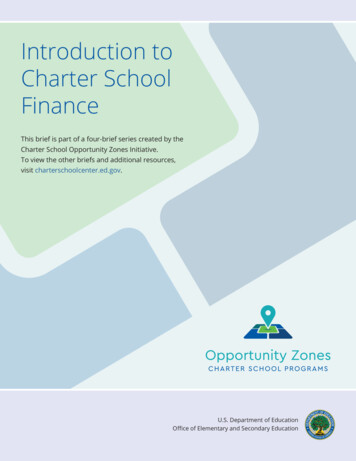
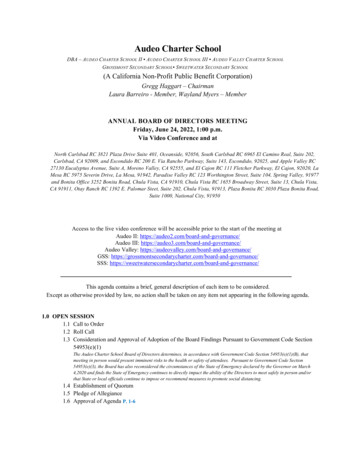
Charter School EnrollmentCharter schools are independent public schools designed and operated by educators, parents,community leaders, educational entrepreneurs and others. They are sponsored by designatedlocal or state educational organizations, who monitor their quality and effectiveness but allowthem to operate outside of the traditional system of public schools. Delaware has seen a 0.9%increase in students attending charter schools SY17/18 in comparison to SY16/17.Total Charter / Traditional Public SchoolEnrollment 1122489Percentage of Students in Charter 20152015-20162016-20172017-20186 Page
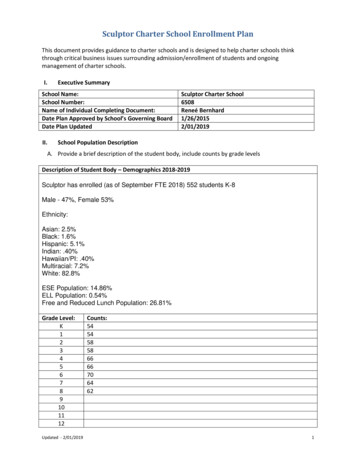
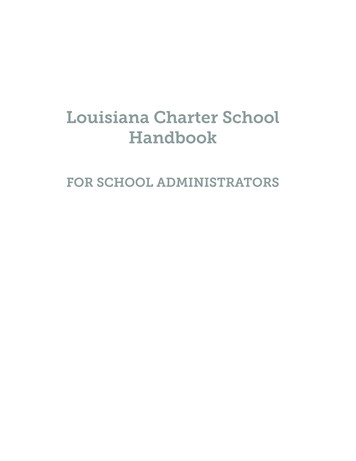
There is a disparity over the last six years in the number of students enrolled in charters acrossthe three counties. This disparity correlates to the number of charter schools located in NewCastle County as compared to other counties. The number of students enrolled overall in charterschools has not varied greatly over the last three years. Similar to the enrollment there is adisparity over the last six years in the number of students enrolled in charters across the threecounties. This disparity correlates to the number of charter schools located in New Castle Countyas compared to other counties. The number of students enrolled overall in charter schools hasnot varied greatly over the last three years. Similar to the enrollment by county, there have alsobeen slight variances in demographics of charter schools that align with demographic trends innon‐charter schools. Data was reviewed in relationship to demographics, which showed thatboth charter and non‐charter schools followed a similar enrollment trend over the last six schoolyears.Enrollment By sexCountyCharterSussexCountyTraditionalKent CountyCharterKent CountyTraditionalNew CastleCountyCharterNew 20152012-20132015-20162016-20172017-20187 Page
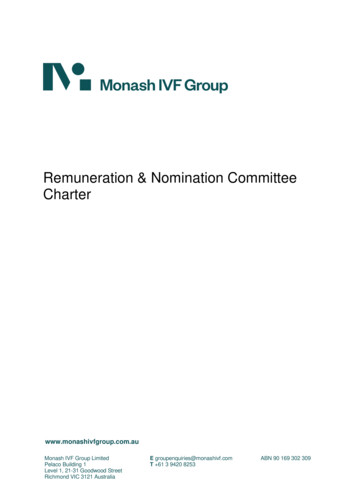
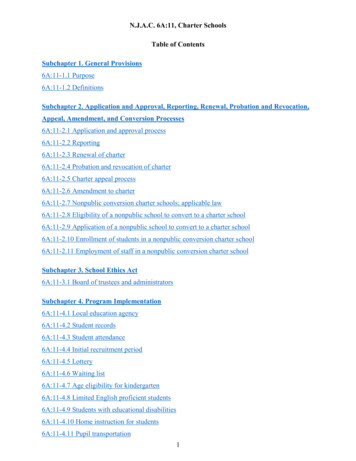
Revenue and Expenditure ComparisonAnnually the Department of Education produces educational statistic reports. The tables belowwere produced as a part of the annual fiscal reporting completed by the Department of Educationfor 2016-2017 and can be found at https://www.doe.k12.de.us/Page/3843. It is essential to notethat the financial data for this report is lag data. The 2017-2018 report will not be available untilMarch/April when fiscal monitoring is completed.In school year (SY) 2016-2017 there were 25 charter schools servicing 15,030 students. Publiccharter school revenue is comprised of federal, state, and local dollars. There were slightdifferences in funding revenue from SY2015-2016 that seem to correspond with the increase inenrollement. In SY 2015-2016, 13,897 students were enrolled in charter schools In SY 2015-2016,charter school revenue equated to 7,411,260.22 in federal funds, 106,131,389.63 in statefunds, and 60,548,741.05 in local funds1. In SY 2016-2017, 15,030 students were enrolled incharter schools. In SY 2016-2017, charter school revenue equated to 7,965,611 in federal funds, 116,828,254 in state funds, and 66,495,630 in local funds 2. The charts below (figure 1)provides a comparison of all state sources of educational revenue to charter school sourcesrevenue.Revenue Source Comparison 1,600,000,000 1,400,000,000 1,200,000,000 1,000,000,000 800,000,000 600,000,000 400,000,000 200,000,000 0Federal2015/2016 StateSource ofEducationalRevenue 193,191,2802016/2017 StateSource ofEducationalRevenue 194,239,2732015/2016 CharterSchools Source ofEducationalrevenue 7,411,2602016/2017 CharterSchools Source ofEducationalRevenue 7,965,611State 1,234,161,403 1,417,646,754 106,131,389 116,828,254Local 639,016,047 775,227,692 60,548,741 66,495,630Federal12StateLocalReports can be located at: https://www.doe.k12.de.us/Page/3843Reports can be located at: https://www.doe.k12.de.us/Page/38438 Page
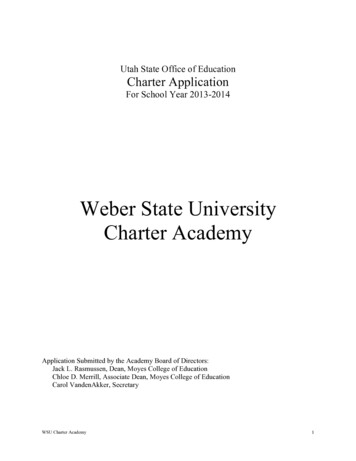
Average per pupil expenditures increased from SY 15/16 to SY 16/17 (figure 2). Historically, thisdata was reported anually on the Delaware School Profiles website. It can currently be found onthe Delaware Report Card Website. Per pupil expendature reports are broken down by county,by school districts, and by charter schools. Comparison of the two year trends indicates anincrease of per pupil expenditures for districts and Kent and New Castle counties ranging from 408 to 828 dollars. Per pupil expenditures in Sussex County decreased by 106. Charter schoolper pupil expenditures included a 121 decrease for Sussex County, a 386 increase for KentCounty, and an increase of 706 in per pupil expenditures for New Castle County. The decreasein the overall pupil expenditure in Sussex County charter schools married the decrease inexpenditures for Sussex County, overall, and resulted from an increase in enrollment and thedecrease in overall funding. Figure 7 (Table 34) of this report provides a breakdown in the perpupil revenue.Average Per Pupil Expenditure SY15/16 and SY 2017Charters2015-2016County Total2016-2017County 1295412262123681252812914New Castle140111483912104122271377114477State Average136101413212066121571346913935SussexKentNew CastleState AverageActual expenses for Districts and Charters are captured in the graphics below.9 Page
Districts (figure 3):10 P a g e
Charters (figure 4):11 P a g e
Figure 5 provides a comparison of the per student expenditures of all charter schools, consideringall sources of such expenditures, with those of other public schools. Figure 6 provides a similaranalysis for individual charter schools only.Figure 5: Summary of expenditures per pupil, by district.12 P a g e
Figure 6: Summary of expenditures per pupil, by charter school.13 P a g e
Figures 7 and 8 provide a comparison of district and charter revenue based on September 30,2016 enrollment.Figure 7: District and all charter revenue based on September 30, 2016 enrollment.14 P a g e
Figure 8: District and all charter revenue based on September 30, 2016 enrollment.15 P a g e
Charter School Performance FrameworkCharter schools are evaluated annually for their academic, organizational, and financialperformance using three separate performance frameworks.On October 13, 2016, the State Board of Education approved revisions to the Charter SchoolOrganizational and Financial Performance Frameworks with the goal to: Clearly communicate standards and expectations to schools;Conduct a transparent, consistent, and predictable oversight process;Conduct an oversight process that is respectful of charter schools’ autonomy;Focus on student outcomes; andProvide evidenced-based feedback to schools and communities indicating where schoolsstand relative to performance framework expectations and standards.These changes went into effect SY2016-2017.Included in this report is the historical, summative data for all charter schools for each of theperformance frameworks as well as the individual measures included within the frameworks.Academic Performance DataIn December 2015, Congress reauthorized the Elementary and Secondary Education Act (ESEA),the main federal law governing funding of public education, as the Every Student Succeeds Act(ESSA). In a post-No Child Left Behind era, ESSA gives states more flexibility and provides morestate and local control as well as the opportunity to advance Delaware’s public schools byenabling all students to succeed. ESSA also requires states to have a plan for spending federalfunds, for measuring the skills students learn, and for supporting students in making academicprogress. Delaware’s ESSA plan is an important component of Delaware’s overall educationsystem. ESSA implementation began in 2017-18 school year. On November 7, 2018, the DelawareDepartment of Education (DDOE) released results of the Delaware School Success Framework(DSSF) for the first time under ESSA.The DSSF, a component of the Performance Framework, is a comprehensive accountabilitysystem that measures and publicly reports on multiple areas of school success, applies to allpublic schools, including charter schools and career technical schools that are subject to thecalculation and reporting of AYP as prescribed by the Federal Elementary and SecondaryEducation Act (ESEA), 20 U.S. C.A. §6301 et seq. and 14 DE Admin. Code 103 Accountability forSchools, Districts and the State. The DSSF measures the following five indicators of schoolsuccess:1. Academic Achievement2. Academic Progress3. School Quality/Student Success4. Graduation Rates5. English Language Proficiency16 P a g e
These five indicators are comprised of ten individual measures (see below).The indicators of the DSSF are aggregated on a 500-point scale reflecting different values forelementary/middle, high schools, and high schools that serve grades beyond 9-12 (e.g., a grades6-12 school). Each indicator (e.g., Academic Achievement), will receive a text-based rating basedon the aggregated performance on the measures in that particular area. The ESSA-approvedindicator weights for ES (K-5), MS (6-8), HS (9-12) and HS Plus (for schools that serve additionalgrades beyond 9-12, i.e. 6-12) and associated points are as follows. High School weighting will beapplied to single high school districts as well as districts serving multiple high schools servinggrades 9-12 only. High School Plus weighting will be applied to all other districts.17 P a g e
18 P a g e
Overall summative ratings are calculated by taking the actual points earned by the school overall(true points) and dividing by the total number of overall index points possible. If performancedata for a measure or indicator are missing or nonexistent (i.e. school does not meet minimum nof 15), the points for the missing measure or indicator are removed from the overall index andan overall score is calculated based on the actual points earned divided by the total pointspossible. By using the percentage of total points earned, schools are able to be evaluated on theindicators/measures for which they truly earn points and allows all schools to be measuredagainst the rating scale for continuous improvement. Text-based descriptors replace the starratings used in prior years (see below). Exceeds ExpectationsMeets ExpectationsBelow ExpectationsWell Below ExpectationsCharter School Academic Performance SY17/18The Charter School Office conducts an analysis of charter school academic achievement lookingfor trends in data that include information collected through site visits and annual reports. Asnoted above, in SY17/18 the DSSF was significantly revised and enhanced to align with the provisionsof the Every Student Succeeds Act (ESSA). Due to these changes, prior year’s data could not bealigned with the current DSSF.In SY17/18 43% of the twenty-one state authorized charter schools received an overall rating ofMeets or Exceeds Expectations, while 32% achieved a rating of Below Expectations and 26%achieved a rating of Well Below Expectations. (Note: Gateway Lab School and Positive OutcomesCharter School are approved to be assessed with the Delaware Alternative Academic Frameworkwhich does not generate overall ratings.)19 P a g e
The chart below provides a breakdown of the number of schools based on their overall ratings inSY17/18.2017-18 Overall DSSF Ratings66543210652EXCEEDS EXPECTATIONSMEETS EXPECTATIONSExceeds Expectations2Meets Expectations6BELOW EXPECTATIONSBelow Expectations6WELL BELOWEXPECTATIONSWell Below Expectations5The charts below illustrate academic charter school results by DSSF indicator. Seven of thetwenty-one charter schools (33%) achieved ratings of Meets or Exceeds Expectations in theAcademic Achievement indicator. Fourteen of the twenty-one charter schools (66%) achievedratings of Below or Well Below Expectations.2017-18 DSSF Academic Achievement876347420EXCEEDS EXPECTATIONSSeries1Exceeds Expectations3MEETS EXPECTATIONSMeets Expectations4BELOW EXPECTATIONSBelow Expectations7WELL BELOWEXPECTATIONSWell Below Expectations720 P a g e
Eleven of the twenty-one charter schools (52%) achieved ratings of Meets or ExceedsExpectations in the Academic Progress indicator. Additionally, there were no charter schools thatachieved a rating of Well Below Expectations for this indicator.2017-18 DSSF Academic Progress786420740EXCEEDSEXPECTATIONSMEETS EXPECTATIONSBELOWEXPECTATIONSExceeds ExpectationsMeets ExpectationsBelow Expectations477Series1WELL BELOWEXPECTATIONSWell BelowExpectations0Eighteen of the twenty-one charter schools (86%) achieved ratings of Meets or ExceedsExpectations in the School Quality/Student Success indicator. Additionally, there were no charterschools that achieved a rating of Well Below Expectations for this indicator.2017-18 School Quality/ Student Success151510350EXCEEDSEXPECTATIONSSeries13MEETS EXPECTATIONS0BELOWEXPECTATIONSExceeds ExpectationsMeets ExpectationsBelow Expectations1533WELL BELOWEXPECTATIONSWell BelowExpectations021 P a g e
Four of the four charter high schools (100%) with sufficient data to generate graduation rate dataachieved Exceeds Expectations in the Graduation Rate indicator.2017-18 DSSF Graduation Rate4432100EXCEEDSEXPECTATIONSSeries1MEETS EXPECTATIONSExceeds Expectations4Meets Expectations00BELOW EXPECTATIONSBelow Expectations00WELL BELOWEXPECTATIONSWell Below Expectations0Four of the seven charter schools (57%) with sufficient data to generate English Proficiency dataachieved ratings of Meets or Exceeds Expectations in the Progress toward English Proficiencyindicator. Three of the seven charter schools (43%) achieved ratings of Below or Well BelowExpectations for this indicator.2017-18 DSSF Progress toward XPECTATIONSExceeds Expectations2MEETS EXPECTATIONSMeets Expectations2BELOW EXPECTATIONSBelow Expectations1WELL BELOWEXPECTATIONSWell Below Expectations222 P a g e
Beyond the Achievement Data: ConclusionsThe CSO reviews the data collected beyond DSSF for our high performing schools and thoseschools demonstrating substantial growth for common trends or practices that can be replicatedacross schools throughout Delaware. The trends in the high performing schools this year include:1. Creating and sustaining a culture of learning where students are empowered to beadvocates for themselves and others in need;2. Fostering relationships between among teachers, students, families, and the largercommunity;3. A consistent, well-developed, and responsive curricula that is implemented with fidelityand supported by professional development;4. A rigorous system for Response to Intervention (RTI) that includes clearly developedsystems of identifying student needs and tracking student progress;5. A curricula for RTI that is implemented and supported by professional development; and6. Strong site-based management.There are many factors that make schools successful, which includes establishing a climate andculture of success, consistent and effective school leadership, and a high functioning system ofschool governance that advances the aims of the school’s annual goals and strategic plan. Thesefactors will be covered in the Organizational Performance Framework.23 P a g e
Organizational Performance FrameworkThe purpose of the Organizational Performance Framework is to provide each charter school andthe public a useful annual assessment of the school’s organizational soundness, publicstewardship, and fulfillment of essential legal obligations. The Organizational PerformanceFramework reflects expectations the charter school is required to meet through state and federallaw, the charter performance agreement, and seeks to provide information regarding these keyquestions: Is the school organizationally sound and well operated?Is the school fulfilling its legal obligations, fiduciary duties, and sound public stewardship?Is the school meeting its obligations and expectations for appropriate access, education,support services, and outcomes for students with disabilities?As much as possible, the Organizational Performance Framework seeks to focus on: Outcomes rather than process or inputs (except where the law dictates particularcompliance processes or requirements); Matters that are material or significant to a school’s organizational health andeffectiveness; and Measures that can be objectively judged or determined.The overall Organizational Performance Framework is broken down into four metrics orindicators that include ten separate measures. These metrics/indicators and measures include:1. Education Programa. Mission Fidelityb. Applicable State and Federal Requirementsc. Students with Disabilities (SWDs)d. English Learners (ELs)2. Governance and Reportinga. Governance and Public Stewardshipb. Oversight of School Managementc. Reporting Requirements3. Students and Staffa. Student Rightsb. Requirements on Teacher Certification and Hiring Staff4. Facilities, Transportation, Health, and Safety24 P a g e
2017-18 Overall Ratings - Organizational Performance FrameworkIn SY17/18, there were no schools that earned an overall rating of Far Below Standard on theOrganizational Performance Framework, but seven schools earned a rating of ApproachingStandard. Although fourteen schools earned ratings of Meets Standard, the total number ofschools decreased from seventeen (77%) to fourteen (66%) since the previous year (see chartbelow). In SY17/18, a number of schools lost points on the Governance and Reporting indicator.Organizational Performance FrameworkOverall Ratings181614121086420MEETS STANDARD (M)APPROACHINGSTANDARD (AS)FAR BELOW STANDARD(F)2016-17Meets Standard (M)17Approaching Standard (AS)5Far Below Standard (F)02017-1814702016-172017-18In SY17/18, all schools earned Meets Standard ratings for the mission fidelity measure (see chartbelow). In SY16/17, two schools did not Meet Standard for this measure. Mission fidelity is a goalcreated by the school, and approved by the CSO, to measure implementation of the school’smission.25 P a g e
Education ProgramMission Fidelity2520151050MEETS STANDARD (M)APPROACHINGSTANDARD (AS)FAR BELOW STANDARD(F)2016-17Meets Standard (M)20Approaching Standard (AS)2Far Below Standard (F)02017-1821002016-172017-18In SY17/18, twenty of the twenty-one schools (95%) earned Meets Standard ratings forcompliance with Applicable State and Federal Requirements, similar to SY16/17 results (seechart below).Education ProgramApplicable State & Federal Requirements2520151050MEETS STANDARD (M)APPROACHINGSTANDARD (AS)FAR BELOW STANDARD(F)2016-17Meets Standard (M)21Approaching Standard (AS)1Far Below Standard (F)02017-1820102016-172017-1826 P a g e
In SY17/18, nineteen of the twenty-one schools (90%) earned Meets Standard ratings forcompliance with serving students with disabilities (see chart below). SY17/18 performanceimproved since SY16/17 where fewer schools (59%) met compliance requirements for thismeasure.Education ProgramStudents with Disabilities20151050MEETS STANDARD (M)APPROACHINGSTANDARD (AS)FAR BELOW STANDARD(F)2016-17Meets Standard (M)13Approaching Standard (AS)9Far Below Standard (F)02017-1819202016-172017-1827 P a g e
In SY17/18, eighteen of the twenty-one schools (86%) earned Meets Standard ratings forcompliance with serving English Learners (see chart below). Two schools earned ratings ofApproaching Standard and one school that earned a rating of Far Below Standard. The issuesidentified have since been resolved. In SY16/17, more schools (95%) met compliancerequirements for this measure.Education ProgramEnglish Learners2520151050MEETS STANDARD (M)APPROACHINGSTANDARD (AS)FAR BELOW STANDARD(F)2016-17Meets Standard (M)21Approaching Standard (AS)0Far Below Standard (F)12017-1818212016-172017-18In SY17/18, fifteen of the twenty-one schools (71%) earned Meets Standard ratings forcompliance with Governance and Public Stewardship requirements (see chart below). Therewere no schools that earned ratings of Approaching Standard and six schools that earned a ratingof Far Below Standard. The majority of schools that failed to meet standards were due toimproper posting of school board meeting minutes, and failing to obtain board governanceand/or financial training. SY17/18 performance improved since SY16/17 where fewer schools(50%) met compliance requirements for this measure.28 P a g e
Governance and ReportingGovernance & Public Stewardship151050MEETS STANDARD(M)APPROACHINGSTANDARD (AS)FAR BELOWSTANDARD (F)2016-17Meets Standard (M)11Approaching Standard (AS)7Far Below Standard (F)42017-1815062016-172017-18In SY17/18, all schools earned Meets Standard ratings for compliance requirements for Oversightof School Management (see chart below). In SY16/17, the results were the same.Governance and ReportingOversight of School Management2520151050MEETS STANDARD(M)APPROACHINGSTANDARD (AS)FAR BELOWSTANDARD (F)2016-17Meets Standard (M)22Approaching Standard (AS)0Far Below Standard (F)02017-1821002016-172017-18In SY17/18, all schools earned Meets Standard ratings for compliance with ReportingRequirements (see chart below). In SY16/17, the results were the same.29 P a g e
Governance and ReportingReporting Requirements2520151050MEETS STANDARD(M)APPROACHINGSTANDARD (AS)FAR BELOWSTANDARD (F)2016-17Meets Standard (M)22Approaching Standard (AS)0Far Below Standard (F)02017-1821002016-172017-18In SY17/18, eighteen of the twenty-one schools (86%) earned Meets Standard ratings forcompliance requirements related to protecting the legal rights of all students (see chart below).There were three schools that earned ratings of Approaching Standard and no schools thatearned a rating of Far Below Standard. The three schools that earned Approaching Standardratings lost points for compliance with the Accountability Student Verification Process and havetaken steps to be in compliance going forward. In SY16/17, more schools (100%) met compliancerequirements for this measure.Students and StaffStudent Rights2520151050MEETS STANDARD(M)APPROACHINGSTANDARD (AS)FAR BELOWSTANDARD (F)2016-17Meets Standard (M)22Approaching Standard (AS)0Far Below Standard (F)02017-1818302016-172017-1830 P a g e
In SY17/18, all schools earned Meets Standard ratings for compliance with Teacher Certificationand Staff Hiring requirements (see chart below). In SY16/17, the results were the same.Students and StaffRequirements on Teacher Certification & HiringStaff2520151050MEETS STANDARD(M)APPROACHINGSTANDARD (AS)FAR BELOWSTANDARD (F)2016-17Meets Standard (M)22Approaching Standard (AS)0Far Below Standard (F)02017-1821002016-172017-18In SY17/18, nineteen of the twenty-one schools (90%) earned Meets Standard ratings forcompliance with school facilities, transportation, and health and safety requirements (see chartbelow). There were two schools that earned ratings of Approaching Standard and no schoolsthat earned a rating of Far Below Standard. One school earned a rating of Approaching Standarddue to errors in documentation for nursing services that has since been corrected. The otherschool resolved an issue identified during its cafeteria evaluation. In SY16/17, more schools (95%)demonstrated compliance with facilities, transportation, and health and safety requirements.31 P a g e
Facilities, Transportation, Health & Safety2520151050MEETS STANDARD(M)APPROACHINGSTANDARD (AS)FAR BELOWSTANDARD (F)2016-17Meets Standard (M)21Approaching Standard (AS)1Far Below Standard (F)02017-1819202016-172017-18Beyond the Organizational Performance Framework Data: ConclusionsSY17/18 was the second year of implementation for the revised Organizational PerformanceFramework. Additionally, the corresponding guidance document has allowed the Charter SchoolOffice to provide schools with clearly defined metrics and measures. These tools have allowedthe CSO to enhance its current data collection and compliance verification system to assess andidentify schools that are struggling with issues relating to compliance and inform prospectivestrategies to support schools.32 P a g e
Financial Performance FrameworkCharter schools have the autonomy to manage their finances consistent with state and federallaw; however, auth
Sussex County Charter Sussex County Traditional Kent County Charter Kent County Traditional New Castle County Charter New Castle County Traditional 2012-2013 340 24614 1529 28459 8569 68002 2013-2014 412 25327 1536 28718 9130 68336 2014-2015 498 25889 1643 28884 9130 67628 2015-2016 594 26292 1928 28557 11375 67281 2016-2017 692 26742 2062 .