Transcription
Solar-Storm/Lunar Atmosphere Model (SSLAM): An Overview of the Effort andDescription of the Driving Storm EnvironmentW. M. Farrell , J. S. Halekas, R. M. Killen, G. T. Delory, N. Gross, L. V. Bleacher, D. KraussVarben, D. Hurley, M. I. Zimmerman (others TBD).122611Abstract: On 29 April 1998, a coronal mass ejection (CME) was emitted from the Sun that had asignificant impact on bodies located at 1 AU. The terrestrial magnetosphere did indeed becomemore electrically active during the storm passage but an obvious question is the effect of such astorm on an exposed rocky body like our Moon. The solar-stonn/lunar atmosphere modelingeffort (SSLAM) brings together surface interactions, exosphere, plasma, and surface chargingmodels all run with a common driver - the solar storm and CME passage occurring from 1-4May 1998. We present herein an expanded discussion on the solar driver during the 1-4 May1998 period that included the passage of an intense coronal mass ejection (CME) that had 10times the solar wind density and had a compositional component of He' ; that exceeded 20%. Wealso provide a very brief overview oflhe SSLAM system layout and overarching results. Oneprimary result is that the CME driver plasma can greatly increase the exospheric content viasputtering, with total mass loss rates that approach 1 kg/s during the 2-day CME passage. Byanalogy, we suggest that CME-related sputtering increases might also be expected during aCMEpassage by a near-earth asteroid or at the Mars exobase, resulting in an enhanced loss of material.I.IntroductionWhile the geo-effectiveness of solar storms and associated coronal mass ejectionsincident on the terrestrial magnetosphere are well-studied, the effect of such storms on exposedrocky bodies like the Moon has not been thoroughly examined. In 2008, a dedicated lunarscience institute called the 'Dynamic Response oflhe Environment At the Moon (DREAM)' was
formed specifically to advance the undcrstanding of the solar-lunar connection. Onc of theprimary objectives of DREAM is to examine the response of the lunar exosphere, exoionosphere, and surface-plasma interactions during the passage of a solar stonn/CME by theMoon; this using a combination of existing spacc weather data sets (from Wind, ACES, andLunar Prospector spacecraft) as inputs to a set of interconnected models. This focused DREAMinstitute study has been called the solar storm-lunar atmosphere modeling (SSLAM) effort whichcommenced the summer of2010 and resulting in a workshop in June 2011.In the effort, institute team members attempted to advance the understanding of theradiation-plasma-surface interaction at the Moon during an extreme solar event. In this specificpaper, we focus on the description of the prevailing, disturbed solar radiation and plasmaenvironment flowing past the Moon between I to 4 May 1998; this infom1ation being used as theobservational input to the SSLAM system. During this time, the Sun was very active, producinga series of CMEs that propagated past a Moon that was fully exposed and unprotected by thegeomagnetic tail( firstquarter phase). The detailed lunar response that is predicted by SSLAMis presented by other papers in this special issue (Killen et a!. [2011], Zimmerman et a!. [2011],Stubbs et a!. [2011], Hurley et a!. [2011], Krauss-Varben et a!. [2011]). In this work weemphasize the description of the solar driver.The primary objective of SSLAM is to answer the question: How does energy and matterin a solar storm affect the exposed, unprotected lunar surface and its corresponding volatile,plasma, and dust environment. Specifically, how much mass is lost during a CME passage? Howlong do affects from the storm linger in the environment? Can spacecraft like Lunar Atmosphereand Dust Environment Explorer (LADEE), Acceleration, Reconnection, Turbulence and2
Electrodynamics of the Moon's Interaction with the Sun (ARTEMIS), and LunarReconnaissance Orbiter (LRO) detect the effects of the storm?Figure 1 illustrates the general aspects of the solar-lunar radiation and conductiveconnection. The Moon is immersed in a st·eam of solar energy and matter including solar windions and electrons, solar photonic radiation, and high energy charged particles. This solar energyhas the ability to energize/activate the lunar surface to create desorbed atomic species that formthe neutral exosphere, sputtered neutral and ion species, charged surfaces, and electricallyinduced lofted dust. Micro-meteoroids in the inner heliosphere also continually bombard thesurface creating secondary impact particulate ejecta (small dust), neutral vapor, and plasmaimpulses. In essence, the solar energy and heliospheric matter continually erodes the surface ofthe Moon (at a rate of 10's of g/s [Stern, 1999]) with the eroded products forming a dustyplasma and neutral super-surface that extends 10-100 km about the Moon.During a storm and CME passage, the solar drivers of photonic radiation, fast movingcharged particles, and cooler dense plasma, all intensify greatly. Within a CME, the plasmadensities increase, but the plasma also becomes He-rich, temporarily increasing the mass-fluxincident at the Moon. It is thus reasonable to expect that the lofted dust layer, plasma interactionregion, and neutral exosphere about the Moon might also all intensify in cadence. The exactnature and extent of this storm-time intensification is the motivation for the SSLAM effort.The solar drivers associated with a solar stonn include photonic UV and x-ray emissionthat propagates at the speed of light, this initiated at the time the CME is released from the Sun.High energy radiation from the CME (shock region) is also continuously emitted as the drivergas propagates at - 500-1000 km/s from the Sun to the Earth-Moon system. After a few days, theCME driver gas, itself, is finally incident at 1 AU. Compared to the nominal solar wind, the3
density of the eME wind is inereased by a faetor of 10 and the fractional content of He" in theeME wind can increase from the nominal 2% to over 20% [Skoug et aI., 1999].Figure 1 illustrates the response of the Moon to these drivers. Solar photonic radiationincident on the days ide creates thermal and photon desorption of surface volatiles [Stem, 1999]and releases photo-electrons that charge the surface with a net positive potential of a few volts[Manka, 1973] . Solar wind plasma protons at -1 keY will sputter atoms from the surfaceregolith [Johnson, 1990]. Together, these processes create a neutral gas exosphere (i.e., acollisionless atmosphere) which is expected to intensify when the massive driver gas is incidenton the surface. The plasma also creates surface charging: positive on the dayside due to thedominance of photoelectron emission and negative on the nightside as that surface balancesplasma electron and ion flux level [Manka, 1973; Farrell et a1.,2007]. There is also the formationof a trailing lunar wake region, where the body has absorbed solar wind ions leaving plasmadensities as low as 0.1 % of ambient solar wind levels [Halekas ct aI., 2005]. The polar regionshave special environments and plasma inflow into permanently shadow craters may affect theretention of volatiles in these cold traps [Zimmerman et aI., 2011a]The general evolution of a solar storm/eME release has the following stages: 1) Inassociation with the commencement of a eME, a solar flare emits intense x-rays, EUV, radioemission, and high energy charged particles from a process called magnetic reconnection of thesolar magnetic field. The rearrangement of the solar magnetic field hom reconnection convertsmagnetic energy into energetic particle energy. Some of these high energy particles are directedback toward the surface resulting in the x-ray emission. 2) As the eME propagates outward at aspeed faster than the Alfven wave speed in the interplanetary medium, a collisionless shockforms that also accelerates particles to high energies to form a solar energetic particle (SEP)4
event [Reames, 1990; Gopalswamy et aI., 2002]. If the CME and shock are directed Earthward,they will take approximately 2-4 days to reach I AU, and during this interval the IP shock emitsSEP electrons and ions, and will radiate radio emission. 3) After propagating in theinterplanetary medium, the shock will pass by the Earth-Moon system, and this passage has aclear signature in the plasma character as an abrupt increase in magnetic field strength andplasma density that are consistent with conditions across an magneto-hydrodynamicdiscontinuity [Gumett and Bhattachatjee, 2005]. For -lOs of hours, the observation point isthen immersed in a post-shock wann plasma (often called the 'sheath' but we will refer to it as'post-shocked plasma) where the plasma temperature has increased to 300000-500000K (30-50e V). The plasma flow velocity will also increase after crossing the interplantery shock, whichmay initially seem counter-intuitive. However, in the frame ofreference of the shock (movingoutward at a speed faster than the upstream solar wind), the flow now has a sub-Alfvenicvelocity. 4) A magneto-hydrodynamic discontinuity passes by the Moon, marking the transitionof warm post-shocked plasma to cold plasma that is associated with driver gas of the CM . Inthis region, the magnetic field will display a characteristic twist in association with being in anMHO force-free equilibrium. Within this region, the driver gas densities can be a factor of 10-15times the ambient solar wind levels and He" concentrations will increase by 10 times overnominal solar wind levels (to become 20% of the ambient ion concentration) [Skoug et aI.,1999]. As we describe in section V, such heavy ions can be a sputtering source.The presentation herein will describe the SSLAM system (Section II), describe in detailan ideal CME event for focused storm-lunar interaction study on 1-4 May 1998 (Section III),present very unusual surface charging observations provide by Lunar Prospector during thisperiod (Section IV), give an short overview of the resulting modeling effort (Section V), and5
then provide conclusions on the effort, including the analog at near-Earth astcroids and Marsexobase. More detailed reports on the effect of the storm are found in Killen et al. [2011],Zimmerman et al. [2011], Stubbs et al. [2011], Hurley et al. [2011], Farrell et a!. [2011], andKrauss-Varben et a!. [20 II J.II.Solar Storm-Lunar Atmosphere Modeling SystemFigure 2 shows a block diagram of the cross-integrating SSLAM system. Individualblocks represent separate codes (or sets of interconnected codes); each run on separate platformsand managed by a model curator (usually the model/code developer). The connecting lines showthe flow of model data products between the codes. The set of models have a common input (1-4May 1998 storm period) and exchange products in a specific sequence. As a consequence, thesynthesized component-level models act quasi-coherently to form a system-level model thatexamines the solar-lunar connection in a way that has not been done previously.In order to identify a common event trigger, an Extreme Event Selection Committee wasformed that included a subset of team members from the DREAM science team. Their objectivewas to examine existing data sets and find a candidate solar storm/CME event with the criteriathat: 1) the Moon be external to the telTestrial geomagnetic tail and magnetosheath, 2) there be acomprehensive set of upstream plasma and high energy particle observations obtained by solarwind monitoring spacecraft like Wind or Active Cornposition Explorer (ACE), 3) the event berich in the multi-charged heavy ion He'; ,4) a lunar landed or orbital plasma sensing asset beavailable, 5) the event be well-studied by the space weather/terrestrial magnetospherecommunity.6
During the Apollo era, there were landed plasma sensing assets like the Suprathermal IonDetector Experiment (SIDE) that could correlate storm activity wi th surface charging. However,there was a lack of comprehensive solar wind and SEP observations during thi s period. Thus,CMEs'from the modern period were considered better suited for study. An ideal period wasfound in 1998, at the start of the peak active period of solar cycle # 23. During this time, therewas both a large number of upstream solar wind monitors and a plasma sensing system in lunarorbit: the magnetometer and electron rel1ectometer (MAG/ER) onboard the Lunar Prospector(LP) spacecraft. CMEs that were rich in He" were found in early May, August and Septemberof 1998.The May 1998 event was also pan of the space weather SHINE campaign, and thus thefocus of previous study. A such, the May 1-4 1998 event was selected as the driver for the study.The observations from the upstream monitors Wind, ACE and Solar HeliophysicsObservatory (SOHO) for 1-4 May 1998 form a common input database for a set of DREAMmodels. These models included a Monte Carlo lunar exosphere model [Hurley et aI., 2000],global hybrid plasma simulation [Travnicek et aI., 2005], surface charging and dust loftingsystem [Stubbs et aI. , 2006] , polar crater plasma expansion [Farrell et aI., 2010; Zimmerman etaI., 20 1I a], polar crater resource calcu lat ion based on Johnson [1990], and roving objectcharging model [Jackson et aI., 2011]. These existing components were modified and initiallyrun in the sequence shown in Figure 2.A key exchange was the transfer of sputters ion activity to the global hybrid plasmasimulation. The output of the sputtering model was used as the input for the plasma simulationthat is specifically designed to self-consistently trace the trajectory of the new Kaguyadiscovered rel1ected ions [Saito et aI. , 2009] and sputtered ions during storm time conditions.Another key exchange was between the polar crater plasma expansion simulation [Zimmerman7
et ai, 2011a] to the object charging model [Jackson et aI., 2011 ]. In this case, the local plasmaenvironment existing at the bottom of a crater floor was used as an input into the electricaldissipation of a moving system being charged by contact electrification (tribo-charged).III.The Disturbed Sun and Interplanetary MediumThe CME that arrived at the Earth-Moon system on 2 May 1998 was initiated in associationwith an M8 flare that occurred on 29 April at 16:30 UT. Figure 3 shows the GOES X-ray fluxfrom 29 April to 7 May with the strong flare event clearly observed (shaded circle on the lefthand side of the figure). SEP electron flux was observed by instruments on board the CgJacecrafi in association with the Earthward-directed CME, with flux levels gradually increasingby a factor of 10 to peak near 30 April. The peak in energetic electron flux activity thenprogressively decreased to return to nominal levels at the start of 2 May. The SEP ion flux levelsshowed a similar initial behavior, but after peaking remained at steady, high levels to moreabruptly decrease near the start of 2 May. The SEP electron flux activity was consideredmoderate, especially in comparison to the X3 flare event on 6 May where subsequent SEPelectron flux levels were observed to abruptly increase by over a factor of 250.The low energy plasma associated with the 29 April flare arrived at the Earth-Moon systemat the end of the day on I May. The time-averaged speed of the CME can be derived from the IAU distance traveled in about 53.5 hours, corresponding to an average speed of about 780kin/sec. Figure 4 shows the CE lasma measurements from I to 5 May, including the plasmadensity, temperature, flow speed and absolute value of the magnetic fi eld.We divide the CME passage into 4 clearly-defined intervals: I) Interval I is the period oftime the Moon is immersed in nominal solar wind with a fl ow speed of about 450 lan/sec (as8
observed at the end of the interval). 2) Interval 2 is defined by the period the Moon is immersedin a post-shock plasma. At the start of interval 2, the interplanetary shock that forms at the frontof the CME passes the Moon. In association with this passage, the plasma density abruptlyincreases by a factor of 4, the plasma temperature increase by a factor of - 3, and the flow speedalso increases to 600 km/sec (to appear at a substantially slower speed of only 50 km/sec in theframe of reference of the faster CME). 3) Interval 3 defines the period the Moon is immersed inan 'early CME' cold plasma. At the start ofInterval 3, the Moon passes through an MHDdiscontinuity to then become immersed in the CME driver plasma. This early CME plasma ismoving near 650 km/sec, is substantially cooler than the post-shock plasma, and has a densitycomparable to the nominal solar wind value. We note that the measured velocity of 650 km/secis below the overall average velocity value from the CME transit time, suggesting that the CMEwas ejected at substantially faster speeds and then progressively slowed as it moved towardsEarth. 4) Interval 4 is defIned as the period when the Moon becomes immersed in the very denseplasma in the later part of the CME. Admittedly, this boundary is somewhat arbitrary since thereis not a clear MHD discontinuity associated with the passage. However, the character of theplasma in this late CME is distinctly different, having densities that are -10 times that of thenominal solar wind. As indicated in Skoug et aI., [1999], the concentration of heavy, multicharged ions (He' ') substantially increased from a few percent in the nominal solar wind to havevalues lie between 20-30% in this late CME plasma. Thus, the plasma in this late CME periodis not only denser, but also contains higher relative proportions of heavy, multi-charged ions.Table 1 captures the key plasma parameters of the 4 intervals. Many of the SSLAM studies willpresent simulation runs from each interval as separate slices, since some models cannot be runover the entire 4 day period.9
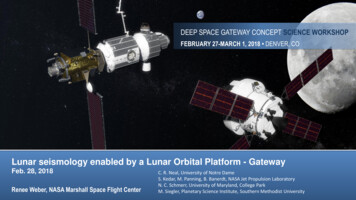
A close inspection of Figure 3 reveals that in the middle of the passage of the CME drivergas, at 13:13 UTon 2 May, the Sun once again released a CME and flare-related energeticparticles. While the CME would not arrive until after 3 May, the energetic electrons moving atrelativistic speeds arrived at the Moon in association with the X 1 flare event. Figure 5 shows thealTival of the SEP events in the collated WIND, SOHO and ACE high energy particlemeasurements [Halekas et ai., 2009]. Note that the tan lines are indicative of the highest energypal1icles (4.4 MeV for electrons, and 33 MeV for ions) and these show a distinct and abruptincrease in association with the flare event. Some SSLAM studies incorporated this anomalousSEP event into their models to understand the effect such radiation might have on surfacecharging [Stubbs et ai., 2011] and the plasma sheath [Fanell et ai., 2011].IV. Luuar Prospector ObservationsThe Lunar Prospector (LP) spacecraft provided a birds-eye view of the interaction of solarstorms with the lunar environment, from its orbit at an altitude of -100 km in 1998. LP hadplasma instrumentation consisting of the Electron Reflectometer (ER) and Magnetometer (MAG)instruments. The ER was a top-hat electrostatic analyzer that measured full 3-D electrondistribution functions. During the time period considered in this study, the ER energy sweepcovered energies from 38 eV-17 keV. The MAG, meanwhile, was a 3-axis fluxgatemagnetometer, providing observations of magnetic field vectors at 9 Hz. We also use datacollated from Wind, SOHO, and ACE [Muller-Mellin et al., 1995; von Rosenvinge et ai., 1995;Gold et al., 1998; Stone et al., 1998] to characterize the energetic fluxes, as described in Halekaset ai. [2009], like that shown in Figure 5.10
Bya lucky happenstance, the LP ER serendipitously proved capable of measuring surfacenegative electrostatic potentials, by inferring the potential drop using the energy dependence ofthe electron loss cone, and the energy of secondary and/or photoelectrons accelerated up to thespacecraft from a negatively charged surface. This technique was applied in an approximatefashion to both quiet time and solar energetic particle events [Halekas et aI., 2007], and then laterrefined to include approximate cOlTections for spacecraft charging, as described in detail inHalekas et ai. [2008] and Halekas et ai. [2009].The solar storms in May 1998 have been studied in detail by numerous authors [Burlaga etaI., 2001; Farrugia et aI., 2002; Torsti et aI., 2004]. For our purposes, it is sufficient to know thata CME shock passed the Moon late on May 1", followed by a magnetic cloud filled with coldplasma, with high fractions of heavy ions. As this dense plasma propagated through the solarsystem, a solar energetic particle event injected very energetic charged pmticles into the cloudstructure. These events had a significant impact on the lunar environment, as shown in Fig. 6.Panel band c of Figure 6 shows an energy spectrogram for electrons, focusing on thoseelectrons that are propagating up and down a magnetically-connected field line to the Moon. Theconsistent patches of red in the spectrogram are associated with locally generated photoelectrons, and thus indicate times when LP is in direct sunlight. However, between those times,the spacecraft is in shadow and connected to the nightside lunar surface, as indicated in panel ewhich shows large solar zenith angles at these times. Since the nightside surface is generallycharged negative, beams of secondary electrons are ejected hom the surface at energies near thelocal lunar surface potential. As such, these electron beams allow the remotely flying LPspacecraft to directly infer the surface potential. This potential derived from the surface-11
accelerated secondary electron beams is shown in panel (d) which has been quantitativelydetermined using previously developed procedures [Halekas et aI., 2008, 2009],The derived lunar surface potential in panel (d) follow a clear trend with surface solar zenithangle, with most large negative potentials observed on the night side, and the largest potentialsseen in the central wake, The reason for this dependence is clear; low energy plasma does noteasily enter the wake at low altitudes, while higher energy particles have large gyroradii,allowing them to easily penetrate the wake, Therefore, energetic particles dominate in thecentral wake, allowing the surface to charge to large negative values,Though the elevated fluxes of energetic electrons during this time period clearly have asignificant affect on the magnitude of the surface charging, it is also apparent that they do notalone control the surface potential, since we observe elevated levels of charging even before thelargest energetic particle injection at -14:00 on May 2'''', Indeed, nightside surface potentialsincrease significantly soon after the passage of the shock (the large magnetic field amplificationat -22:00 on May 1"), The very low temperature plasma in the magnetic cloud provides a likelyexplanation for this elevation in charging, First, since the low temperature of the plasma impliesthat the thermal surface charging currents go down, any energetic particles present have acommensurately larger effect on surface charging during the magnetic cloud's passage, Inaddition, the secondary emission from the surface decreases significantly when the plasmatemperature is vcry low, removing a factor that tends to mitigate large negative surface chargingat other times, Therefore, the conditions during the passage of the cold CME plasma stronglyfavor the development of large surface potentials, and the subsequent injection of energeticparticles enhances things even farther.12
Though not the main focus of this paper, the dayside effects seen by LP are also of note (inpanel e, where the SZA is below 90 ). Fig. 6 shows the presence of highly variable "spiky"upward-going electron fluxes during this time period, together with unusually high levels ofmagnetic field fluctuations. The upward-going electron fluxes most likely indicate reflectionfrom crustal magnetic fields on the surface, with some amplification of upward-going fluxes dueto the effects of reflection from an obstacle in motion with respect to the plasma frame [Halekaset aI., 2011). These upward-going electrons most likely drive the high levels of magnetic fieldfluctuations, and can even affect the upstream plasma, thennalizing and diffusing the highlyanisotropic fluxes incident on the Moon during the SEP injection, as described by Halekas et al.[20 I 0).v.Descriptive Overview of SSLAM ResultsThe SSLAM effort commenced in mid-year 20 I O. As indicated in Figure 2, specializedteams were fonned to address the CME effects on the exosphere, surface charging, plasmainteractions, and the polar environment. Model outputs were discussed, refined, and exchangedbetween the model curators. This aetivity continued to June of 2011 when a lunar extremeworkshop was held to examine model results and to form conclusions. The workshop alsoincluded participation from 10 high school students and two teaehers from localBaltimore/Washington high schools as part of the institute's education effort. Prior to theworkshop the student participated in a 16-week custom-designed course on the solar-lunarconnection (see hln)1). We review some ofthe topics and key results below, identifying the a subset of SSLAM paper that described theeffects in greater detail.13
Killen et al. (2011) found that the sputtering flux for neutral and ion species increases bymany factors of 10 withi n the He " -rich driver plasma of a CME as compared to nominal solarwind levels. This result can be understood by recognizing that, in general, sputtering yields varywith the linear energy transfer (dE/dx) of an ion within a given substrate, with Y - (dE/dx)",where n varies from I to 1.6 (see Eq. 3.27 of Johnson (1990) and Elphic et aI., [1 991)). ThisdE/dx varies directly with the mass of the incident ion, M (in units of proton mass) and is alsoproportional to the square of the charge of the incident ion, Z' [Johnson, 1990). As such, oneshou ld expect yields for heavy, multi-charged ion species ncar I keV to vary approximately asYJ Yp- (M,Z/)" where, Yp is the proton yield, and Y, is yield for the heavier species. Barghoutyet al. [20 II) recently provided detailed yie ld va lues from lunar-type regolith undergoingbombardment from heavy multi-charged ions including He" like those expected in a so lar w indlike plasma.Motivated by this scaling effect of the sputtering yields, Killen et al. [20 II) created aweighted yield appropriate for the CME driver plasma in 2-3 May 1998, and found that CMEsputtering becomes the dominant process in releasing material from the Moon with both volatileand refractory species have increased dayside source rates at 20-80 times higher than in thenominal solar wind. Hence species like Si, Fe, and Ti begin to populate the exosphere and escapethe Moon. Over the course of the 2-day passage of the CME driver gas, there could be as muchas 100 tons of mass eroded from the Moon via CME sputtering. While this loss is surpri singlylarge, we note that the CME itself also delivers about the same amount of material to the surfacein the form of the driver-gas protons and heavy ions.The results of the sputtered ion modeling [Killen et aI, 20 11) were then used as theinput to a multi -dimensional hybrid plasma simulation [Krauss Varben et al. 2011) of the ion and14
electron environment during the highly disturbed solar wind conditions in early May 1998. Theresults of this modeling, describe further in Krauss Varben et a1. [2012] show that there is anenhanced eME storm time ion component oflunar origin that can propagate upstream to form aprecursor layer during the eME passage.Stubbs et a1. [2012] reports that the surface charging at the equator and terminatorregions is modified as the eME passes. Farrell et aI., [2012] provides simulations showing thatthe dayside plasma sheath that traps photo-electrons in nominal solar wind conditions actuallybecomes less efficient in trapping during the passage of the eME, consistent with Stubbs et a1.[2012] reduced dayside surface potential. Polar crater regions are also found to undergo verycomplex electrical interactions during the passage of a eME [Zimmerman et aI, 2012]. Since theplasma expansion from the surface on to the crater floor scales with electron temperature, ionswill more easily flow onto the crater floor while the Moon is immersed in the warm post-shockplasma. The large currents in the latc part of the eME also find their way to the crater floor,where that can affect sputtering and the loss of volatiles. Ion sputtering losses affect the longterm stability of volatiles that become trapped within these cold regions and these modelsprovide a guide to quantify the loss of material from the crater floor. Using a modeling tooldeveloped previously [Jackson et aI., 2011], it was found that a tribocharged object inside thecrater will easily dissipate accumulated charge when the warm sheath plasma passes the Moon,but will have greater relative difficulty dissipating negative charge in the early portion of theeME (Interval 3) with the substantially reduced ion influx to the crater floor.Conclusions15
We model the response of the lunar surface during the highly disturbed solar plasmaand radiation environment at the Moon during the I -4 May 1998 CME passage. Using theobservational data sets from upstream plasma monitors (Wind,ACE, and SOHO) as commoninputs/initial conditions, we considered the effect of the storm time solar energy and matter hason the surface charge, exosphere, within polar craters, and on the passing plasma flow. Thedriving solar energy is described in this work while the predicted responses are detailed in Killenet al. [2012), Zimmerman et al. [2012), Stubbs et al. [20 I 2], Hurley et al. [2012], Krauss-Varbenet al. [2012] and Farrell et al. [20 I 2].The key element to the SSL
Lunar Prospector spacecraft) as inputs to a set of interconnected models. This focused DREAM institute study has been called the solar storm-lunar atmosphere modeling (SSLAM) effort which commenced the summer of2010 and resulting in a workshop in June 2011. In the effort, institute team members attempted to advance the understanding of the