Transcription
HindawiJournal of Advanced TransportationVolume 2020, Article ID 7194342, 12 pageshttps://doi.org/10.1155/2020/7194342Research ArticleVideo-Based Detection Infrastructure Enhancement forAutomated Ship Recognition and Behavior AnalysisXinqiang Chen ,1 Lei Qi,1 Yongsheng Yang,1 Qiang Luo,2 Octavian Postolache,3Jinjun Tang ,4 and Huafeng Wu51Institute of Logistics Science and Engineering, Shanghai Maritime University, Shanghai 201306, ChinaSchool of Civil Engineering, Guangzhou University, Guangzhou 510006, China3ISCTE – Instituto Universitário de Lisboa, Lisbon University Institute, Lisbon, Portugal4School of Traffic and Transportation Engineering, Central South University, Changsha 410075, China5Merchant Marine College, Shanghai Maritime University, Shanghai 201306, China2Correspondence should be addressed to Jinjun Tang; jinjuntang@csu.edu.cnReceived 31 July 2019; Revised 5 October 2019; Accepted 28 October 2019; Published 20 January 2020Guest Editor: Hao YuCopyright 2020 Xinqiang Chen et al. This is an open access article distributed under the Creative Commons Attribution License,which permits unrestricted use, distribution, and reproduction in any medium, provided the original work is properly cited.Video-based detection infrastructure is crucial for promoting connected and autonomous shipping (CAS) development, whichprovides critical on-site traffic data for maritime participants. Ship behavior analysis, one of the fundamental tasks for fulfillingsmart video-based detection infrastructure, has become an active topic in the CAS community. Previous studies focused on shipbehavior analysis by exploring spatial-temporal information from automatic identification system (AIS) data, and less attention waspaid to maritime surveillance videos. To bridge the gap, we proposed an ensemble you only look once (YOLO) framework for shipbehavior analysis. First, we employed the convolutional neural network in the YOLO model to extract multi-scaled ship featuresfrom the input ship images. Second, the proposed framework generated many bounding boxes (i.e., potential ship positions) basedon the object confidence level. Third, we suppressed the background bounding box interferences, and determined ship detectionresults with intersection over union (IOU) criterion, and thus obtained ship positions in each ship image. Fourth, we analyzedspatial-temporal ship behavior in consecutive maritime images based on kinematic ship information. The experimental resultshave shown that ships are accurately detected (i.e., both of the average recall and precision rate were higher than 90%) and thehistorical ship behaviors are successfully recognized. The proposed framework can be adaptively deployed in the connected andautonomous vehicle detection system in the automated terminal for the purpose of exploring the coupled interactions betweentraffic flow variation and heterogeneous detection infrastructures, and thus enhance terminal traffic network capacity and safety.1. IntroductionSHIP behavior recognition and prediction is very importantfor the early warning of risky behavior, identifying potentialship collision, improving maritime traffic efficiency, etc., andthus is a very active topic in the intelligent maritime navigationcommunity. Currently, we primarily rely on the AIS data toexplore traffic flow knowledge under varied maritime trafficsituations. The large-scale available AIS data support researchof probing maritime spatial-temporal traffic patterns, and recognizing ship behaviors by inferring from ship locations, shipheading directions, ship speeds (i.e., speed over ground andspeed over water), etc. Wang et al. obtained the spatial-temporal traffic tensors by mining the high-resolution AIS data,and then employed a sparse multi-linear decompositionmethod to predict ship behaviors [1]. Li et al. developed amulti-dimension scaling model to explore spatial similarityamong extensive ship trajectories, and then an improved density spatial clustering algorithm is proposed to acquire theoptimal AIS clusters and recognize potential abnormal shipbehaviors at a fixed time interval [2]. Zhao et al. combined theDouglas-Peucker-based compression model and density clustering method to discover maritime traffic patterns [3].Arguedas et al. proposed a two-layer artificial neural networkto represent structured maritime traffic patterns, which provide maritime regulators a high-efficiency tool for perceivingreal-time maritime situation, and fulfill the automatic maritime traffic monitoring task [4].The AIS data can efficiently model ship trajectories at sea,and help maritime relevant participants (maritime officials,
2ship crew, etc.) take early actions to avoid potential accidents.Zhang et al. proposed different frameworks to recognize possible near miss ship-ship collisions from AIS data [5, 6]. Byeet al. analyzed maritime accidents by mining the inshore shipAIS data considering varied maritime static and kinematicinformation, such as sailed nautical miles, accumulated engineworking hours, port call number, ship type, flag state, grosstonnage, etc. [7]. Integrating the AIS data with other maritimesources (synthetic aperture radar (SAR), radar, etc.) to fulfillaccurate ship behavior recognition task have shown numeroussuccesses. Mazzarella et al. fused the space-borne SAR imagesand AIS information to explore maritime traffic knowledgeby deeply exploiting historical ship trajectories, cross-validateship positions detected in satellite imagery and recognize thoseships that deliberately hide their sailing information [8].Habtemariam et al. developed a measurement-level fusionalgorithm by merging radar data and AIS messages with anovel joint probabilistic data association framework [9]. Thedata fusing relevant methods obtain comprehensive information for both, on and off-site maritime traffic, and supportrobust ship behavior exploration.Though the AIS dataset contains rich information forensuring maritime safety, security and efficiency, the followingcritical weaknesses reduce AIS based techniques performancewhen analyzing ship behaviour: (1) Some ships (e.g., fishingboats) may not be equipped with AIS relevant facility, andsome ships sailing at sea may attempt to deactivate (or evenshut down) their AIS transmitters (smuggling ships, warships,etc.) [10]. (2) AIS equipment broadcasts the host ship staticand kinematic information at a fixed frequency (usually variedfrom 2 to 10 seconds) when the ship is sailing at coastal channels, and the data broadcasting interval can extend to 3 minutes when the ship is in anchoring state, which leads tosignificant challenge of formatting AIS database (creating,retrieving, updating and deleting operations). (3) We canhardly obtain the visual spot traffic information straightforwardly from AIS system. More specifically, we need to manually recover the original maritime traffic situations byinferring from ship trajectories with the support of historicalAIS data, which is very time consuming and labor-intensive.The Long Range Identification and Tracking (LRIT) techniqueis another useful method for obtaining ship positions. But, theLRIT data is private and confidential, and thus it is not easyfor the public to access the data.The extensive deployment of maritime sensors and rapiddevelopment of computer vision techniques help us easilycollect, store and analyze the on-site maritime transportationdata. Currently, public accessible maritime image sourcesinclude SAR image, infrared data, and closed-circuit television(CCTV) videos. The SAR images sharply scale down the original ship-to-ship distances as it shoots maritime images at avery high attitude (approximately 5000 km above the earth).The image quality may be severely degraded by strong clouds,and thus may fail to provide us high-resolution imageries forconducting accurate maritime traffic situations analyses [11].The infrared image resolution is not high due to the intrinsicinfrared imaging technique bottlenecks, which impose greatchallenge of extracting high-fidelity traffic information foranalyzing the small ship (i.e., ship size in images are small)Journal of Advanced Transportationbehaviours [12]. Besides, the performance of infrared basedtechniques is easily interfered by the wave and ship enginetemperature variations [13].The CCTV data sources provide us rich and real timeon-spot traffic information (traffic volume, ship speed, heading angle, etc.), and thus support high-fidelity ship behavioranalysis researches. Valsamis et al. employed traditionalmachine learning algorithms to extract ship trajectories fromCCTV videos [14]. Ship tracking and detection are the twopopular topics for implementing ship behaviors recognitiontask via CCTV data sources. Zhang et al. presented a shipdetection framework to remove vibration interference generated by non-stationary surface platform (buoys, sailing ships,etc.), and yielded trustable visual maritime surveillance results[15]. Yao et al. proposed a local visual saliency map to detectships from GF-4 satellite sequential images, and the local peaksignal-to-noise ratio indicator was introduced to quantitativelyevaluate the model performance [16]. Kang et al. proposed aself-selective correlation filtering method to solve the shipscale variation challenge for the purpose of ship tracking [17].The deep learning methods have shown great potential inobject detection and tracking field, which were pre-trained bythe public-access benchmarks, and the models were then finetuned with customized data to obtain satisfactory ship behavior recognition performance. Woo et al. developed a longshort-term memory based recurrent neural network structureto detect and predict kinematic behaviors of unmanned surface vehicles [18]. Gao et al. developed an online real-timeship behaviour prediction model by constructing a bidirectional long short-term memory recurrent deep learning neuralnetwork [19]. Similar researches can be found in [20–22].After carefully reviewing the previous ship behaviorrelated studies, we found the following disadvantages significantly challenge the ship behavior recognition performance(from maritime video data): (1) ships sailing far from monitoring camera can be severely interfered by background imaging pixels, especially for the ships have similar intensity withbackground. More specifically, the ship visual features may becontaminated by background, which may not be easilyextracted by the feature detectors; (2) ships in the maritimeimages are quite easily sheltered by obstacles (such as sea clutters, neighboring ships), leading to a big challenge of accurateextracting high-fidelity ship imaging positions. To address theissue, we proposed a novel framework to achieve accurate shipbehavior recognition with four consecutive steps. More specifically, the ensemble YOLO framework was developed toaccurately determine ship positions in consecutive maritimeimages, and then ship trajectories was modeled and recognized based on geometry knowledge.The findings in the research provide us on-site ship kinematic information which significantly benefits automatedterminal data stream interaction for enhancing terminal logistics efficiency. More specifically, the ship, port, and vehicles interminal districts (e.g., container truck, automated guidedvehicle) are closely connected for the purpose of safe and efficient cargo container trafficking. After obtaining ship kinematic information (displacement, moving speed, sailing angle,etc.) via maritime surveillance video, maritime participantscan take early initiative activities to identify (and avoid)
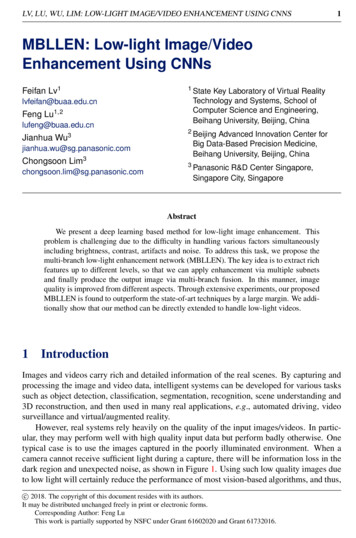
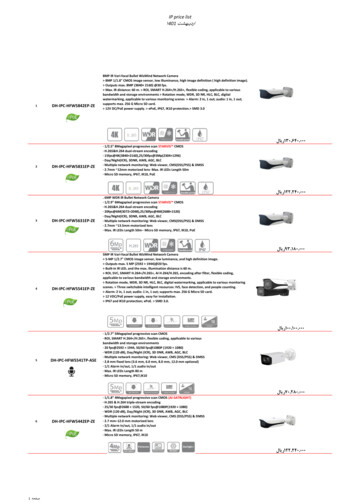
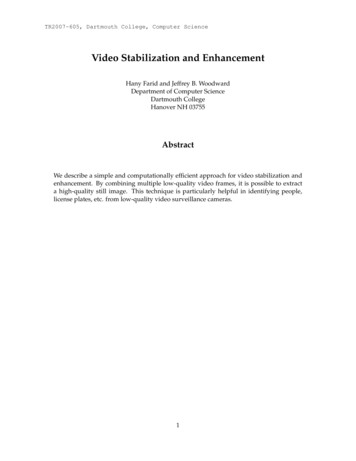
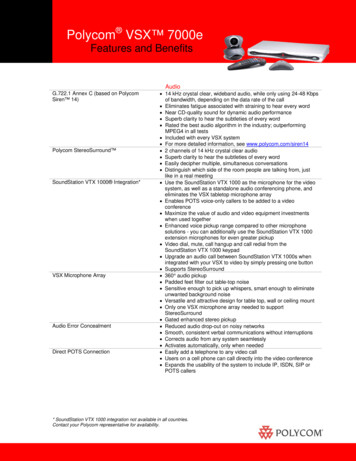
Journal of Advanced Transportationpotential traffic collision through the manner of maneuveringships, sending out risky information, etc. Meanwhile, theautomated terminal management center can generate production planning and scheduling solution in advance, and thenthe autonomous vehicles are dispatched to the ship anchoringarea to prepare for unloading the on-board containers andtransmitting cargos to destinations (terminal yard, cargoreceiver, etc.).Our primary contributions were summarized as follows:(1) we have analyzed the pros and cons of automated shiprecognition and ship behavior analysis via varied maritimedata sources (AIS, LRIT, maritime surveillance videos, etc.).It is found that the video based methods provide us with morehigh-fidelity immediate and understandable on-site trafficsituation awareness information in realistic applications compared to the other popular maritime data; (2) we employed aYOLO based ensemble framework to collect ship spatial-temporal dataset from maritime videos. More specifically, weextract high-fidelity ship kinematic information (i.e., movingdisplacements, speeds, course angle, accelerations) from maritime videos, which provides instantaneous traffic informationto the maritime involved participants for taking early-warningmeasurements to avoid potential ship collisions; (3) we havecollected ship video clips on two typical traffic scenarios (i.e.,irregular ship turning motion, moving straight), from whichwe can extract both of microscopic and macroscopic maritimedata supporting further maritime traffic flow knowledge discovery. Considering, a few ship video benchmarks are openfor public, we are willing to share the collected ship videoswith potential interested readers (by sending request email tojinjuntang@csu.edu.cn).2. Data DescriptionThe lack of public accessible ship videos (due to the data confidential and sensitivity) imposes additional challenge of evaluating performance of ship behavior recognition framework.To this end, we have shot several maritime surveillance videosfrom coastal areas near Shanghai terminal in China. The collected ship images are denoted as case-1 and case-2 scenarios,which are classified with ship sailing directions. More specifically, the first scenario focuses on ship moving-straight situation, and the second case involves with consistently irregularship turning situation. It is noted that ships moves far awayfrom camera may be very difficult to be recognized by humanbeings, and thus the small size ships (cannot be recognized byhuman beings) in maritime images are suppressed for furtheranalysis. Readers are recommended to refer to [23] for thesmall size ship definition.To enhance the framework generalization performance,we employed data augmentation techniques to generate moreship images by applying common augmentation operations.More specifically, we can obtain 20 variant ship images foreach input training image with the help of data augmentationtechnique (with operations of translation, rotation, color shifting, etc.). The ship variant samples are manually selected fromthe generated 20 images where the visual ship features (edges,contours, color, etc.) obviously differ from the original input3image (see Figure 1). We have collected 970 maritime framesin the case-1 and 2030 images in case-2. Overall, the ship datasets (for the two video clips) have 3000 maritime surveillancepictures, with 70% of them being used for training sets, andthe rest as a validation set. More specifically, we select 679frames in case-1 and 1421 images in case-2 for model trainingpurpose, while the remaining 291 and 609 frames in case-1and case-2 are used for the test purpose. Following the rulesin the previous studies [24], we manually rectified trainingimage resolutions into 720 480, and the ship image resolutions in the validation dataset were formatted into 416 416.The frame rate of each video is 30 frames per second (fps). Theground truth ship positions in each frame are manually labeledby our group member (i.e., undergraduate and graduatestudents).3. MethodologyThe overall framework developed for recognizing ship behaviors includes four steps: ship feature extraction, bounding boxgeneration, ship position identification, and ship behavioranalysis. The first step employs the YOLO network to extractship features from the input training data at different scales.In the second step, our framework predicts a bunch of bounding boxes which are considered as potential ship positions ineach image. The third step aims to remove the interferencefrom irrelevant bounding boxes, the K-means method is introduced to obtain anchor boxes (i.e. potential ships), and thebinary cross-entropy cost function is then solved to determinethe final ship detection results. The third step employs geometry theory to recognize consecutive ship positions in eachimage (i.e., positions from same ship), and determine shipbehaviors by analyzing the ship sailing angle variation. Theflowchart of the proposed framework is shown in Figure 2.3.1. Ship Feature Extraction. The YOLO model is introducedto learn the distinct ship features from input images by usinga convolution neural network [24, 25]. More specifically, theYOLO model is introduced to explore ship features at differentscales by varied scaled filters and obtain ship feature pyramids,which are composed by the high-resolution features (finegrained level features). The convolutional neural networkin the proposed ensemble YOLO framework is nested withconvolutional layers, and the deeper layers in the nestednetwork can exploit more discriminative ship features thanthose in the previous layers, which greatly benefits shipdetection accuracy for the ensemble YOLO model. Theobtained ship feature is shown as a matrix as follows:𝑡𝑠𝑓v𝑡 𝑓( 𝑆𝑘𝑡 1 𝜌𝑘v 𝑊v𝑡 ),𝑘(1)where 𝑆𝑘𝑡 1 is the 𝑘th input ship features from the (𝑡 1)th𝑡convolutional layer, 𝜌𝑘vis the weight matrix between the vthand the 𝑘th ship feature layer. The parameter 𝑊v𝑡 is the bias ofthe vth output ship features at the 𝑡th convolutional networklayer, and 𝑓 represents the activation model used for activating
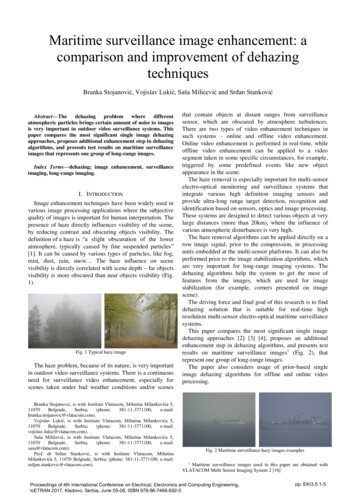
4Journal of Advanced TransportationRandom center cropMirror versionOriginal imageColor shiftingGray scaleColor shiftingRed channelRandom center cropMirror versionRandom center cropMirror versionSalt & pepper noise addedResize imageColor shiftingGreen channelRandom center cropMirror versionGaussian noise addedRotate imageColor shiftingBlue channelFigure 1: The original collected and data-augmentation generated ship images (the output images are labeled by red rectangle).neurons at the 𝑡th layer. The 𝑠𝑓v𝑡 is the vth output features atsame layer.𝑏𝑥𝑝 𝜎(𝑡𝑥𝑝 ) v𝑥 ,𝑏𝑦𝑝 𝜎(𝑡𝑦𝑝 ) v𝑦 ,𝑝3.2. Bounding Box Generation. The ensemble YOLO frameworkpredicts the coordinates of bounding boxes directly using fullyconnected layers on top of the convolutional feature extractor.More specifically, with the features extracted from the previousstep, the original input image is split into 𝑀 𝑀 grids. Thecenter of grid cell is used to predict the object location andclass when the object image center falls in the grid center. Thegrid cell outputs a confidence score for depicting the objectcategory, which is defined as 𝐶𝑟 IOUg𝑡ℎ𝑝𝑟𝑒. The confidencescore is obtained as the IOU value between the ground truthbox and the ensemble YOLO model predicted area (see Figure3), and the IOU calculation formula is shown in Equation (3).Note that each grid cell outputs the object category confidence.The parameter 𝐶𝑟 is set to 1 when the object center locatesin the grid cell center, otherwise the parameter 𝐶𝑟 is set tozero. Thus, the grid cell detection results are positively relatedwith IOU value. A larger IOU shows the bounding box (i.e.,detected ship position) is closer to the ground truth, and viceversa. The proposed framework predicts each grid cell whichis represented by x-coordinate 𝑡𝑥𝑝, y-coordinate 𝑡𝑦𝑝, width 𝑡w𝑝 ,𝑝and height 𝑡ℎ of a bounding box, and ship confidence level 𝑡𝑜𝑝. The ensemble YOLO framework detected bounding boxes’information are presented as follows [25]:𝑏w𝑝 𝑝w𝑎 𝑒𝑡w ,𝑝𝑝𝑏ℎ 𝑝ℎ𝑎 𝑒𝑡ℎ ,𝑡𝑜𝑝 𝑆g𝑡ℎ 𝑆𝑏𝑏𝑜𝑥𝑆g𝑡ℎ 𝑆𝑏𝑏𝑜𝑥,(2)(3)where 𝑏𝑥𝑝 and 𝑏𝑦𝑝 are the ensemble framework detection result,𝑝𝑏w𝑝 and 𝑏ℎ are the width and height of the detected box, respectively. The v𝑥 and v𝑦 are the horizontal and vertical distancesbetween the grid cell center point to the input image top leftcorner, respectively. The 𝑝w𝑎 and 𝑝ℎ𝑎 are the weight matrices onthe width and height, respectively. The 𝜎(𝑡𝑦𝑝 ) and 𝜎(𝑡𝑥𝑝 ) are thesigmoid function outputs based on the predicted boundingbox information of the grid cell. The parameter 𝑆g𝑡ℎ is thesquare of ground truth box for the target ship in a maritimeimage, and the 𝑆𝑏𝑏𝑜𝑥 is the counterpart of the detected bounding box. The symbol depicts the overlapping operation, whilethe is the union operator.3.3. Ship Detection and Recognition. The outputs of theprevious step generate a lot of bounding boxes with many ofthem being false alarms, and thus we employ the 𝐾-means
Journal of Advanced Transportation5Ship feature pyramidScaled filtersShip feature extractionBounding box generationyx(tʹʹ), y(tʹʹ)x(tʹ), y(tʹ)# Frame 121x(t), y(t)# Frame 160Find instantaneous positions in xconsecutive ship images# Frame 203Ship is turning rightShip is turning leftShip is sailing straightShipBuoyAnchor box determination and ship detectionShip behavior analysisFigure 2: Ship behavior analysis for the proposed framework workflow.Ground truth ship positionIntersection areaUnion arearespectively. Then, the 𝐾-means algorithm clusters the (𝑟w, 𝑟ℎ)into 𝐾 classes, and the each cluster center is considered as theanchor box. Readers are suggested to refer to [27] for moredetails about 𝐾-means algorithm. In the training procedure,the anchor box with maximum IOU is considered as detectedship positions. We employ the binary cross-entropy costfunction to determine the class of the box (see Eq. (7)).𝑑(𝑏𝑏𝑜𝑥, 𝑐𝑒𝑛𝑡𝑒𝑟) 1 IOU(𝑏𝑏𝑜𝑥, 𝑐𝑒𝑛𝑡𝑒𝑟),Bounding box (predicted ship position)𝑟w w𝑏𝑏𝑜𝑥,w𝑖𝑚g(5)𝑟ℎ ℎ𝑏𝑏𝑜𝑥,ℎ𝑖𝑚g(6)Figure 3: Sketch map of calculating IOU.clustering method to obtain anchor boxes by suppressingthe interference boxes [26]. More specifically, the K-meansalgorithm randomly selects 𝐾 bounding boxes as the initialclustering center, and the distance between each boundingbox to the cluster center is calculated. The conventionalK-means algorithm employs the Euclidean distance as theevaluation measurement, and larger boxes (ships with largerimaging size) contain higher detection false alarms than thesmaller ones. To mitigate the negative influence, we employ thedistance in Eq. (4) for the box clustering rule in the 𝐾-meansalgorithm. The 𝐾-means algorithm obtains the width (height)ratio 𝑟w (𝑟ℎ ) by dividing the bounding box width (height) withthe image width, which are shown as Equations (5) and (6),𝐿𝑦 (4)1 𝑁 𝑦 log (𝑝(𝑦𝑧 )) (1 𝑦𝑧 ) log (1 𝑝(𝑦𝑧 )),𝑁 𝑧 1 𝑧(7)where 𝑑(𝑏𝑏𝑜𝑥, 𝑐𝑒𝑛𝑡𝑒𝑟) is the distance between the boundingbox and the center box, and IOU(𝑏𝑏𝑜𝑥, 𝑐𝑒𝑛𝑡𝑒𝑟) is the intersection over union between the two boxes. The w𝑏𝑏𝑜𝑥 and w𝑖𝑚gare the widths of the bounding box and image, respectively.The ℎ𝑏𝑏𝑜𝑥 and ℎ𝑖𝑚g are the height of the bounding box andimage, respectively. The 𝑁 is the bounding box number, 𝑦𝑧 is
6Journal of Advanced TransportationFrame # 31Frame # 124Frame # 31Frame # 124Frame # 297(a)Frame # 297Target shipTarget shipTarget ship(b)Figure 4: Ship detection results on typical frames of case-1. (a) Initial ship images, (b) Ship detection results.the zth detected bounding box in the image, and 𝑝(𝑦𝑧 ) showsthe predicted probability for the bounding box belonging tothe class.3.4. Ship Behavior Analysis. After obtaining ship locationsin each maritime image via the previous steps, connectingpositions from neighboring images of the same ship is verycrucial for the ship behavior analysis. Considering that shipsare rigid objects, and bounding box on the same ship shouldshare the same motion, we determine the ship location withthe spatial-temporal constraints based method. Note that eachbounding box is presented by its center point. Assume the shiplocation in the image i is presented as 𝑙𝑥𝑖 , 𝑙𝑦𝑖 , 𝜃𝑖, where the 𝑙𝑥𝑖and 𝑙𝑦𝑖 denote the x and y-coordinate of the bounding boxcenter point in the ith maritime image, and the 𝜃𝑖 is the shipsailing direction in the same image. We consider the positionsin the neighboring ith and the (𝑖 1)th images belong to thesame ship when the group constraints in Eq. (8) are met.In addition, the ship behavior analysis is implemented byanalyzing variation tendency of 𝜃𝑖 in the consecutive images.More specifically, the variation between neighboring 𝜃𝑖 witha decreasing trend shows that the ship is turning left, and anincreasing tendency implying the ship is turning right. Theship is considered as sailing straight when the 𝜃𝑖 variationkeeps in slight fluctuations (see Eqs. (9) and (10)). 𝑑(𝑥) 𝑙𝑥𝑖 𝑙𝑥(𝑖 1) 𝛼, 𝑑(𝑦) 𝑙𝑦𝑖 𝑙𝑦(𝑖 1) 𝛽, 2 2𝑑(𝑠) ( 𝑙𝑥𝑖 𝑙𝑥(𝑖 1) ) ( 𝑙𝑦𝑖 𝑙𝑦(𝑖 1) ) 𝛾,𝜃𝑖 (𝑙𝑦𝑖 𝑙𝑦(𝑖 1) )(𝑙𝑥𝑖 𝑙𝑥(𝑖 1) ), 𝑑(𝜃) 𝜃𝑖 𝜃(𝑖 1) 𝜑,where 𝑑(𝑥) and 𝑑(𝑦) determine the ship moving distance inthe x and y direction, respectively. The parameters 𝛼 and 𝛽 arethresholds of determining the maximum pixel distance in thex and y axis. The parameter 𝑑(𝑠) is ship displacement betweenneighboring frames, and the threshold 𝛾 determines maximalneighboring ship moving displacement. The parameter d(𝜃)indicates ship sailing direction variation tendency, and theparameter 𝜑 is the corresponding threshold.3.5. Detection Goodness Measurements. To evaluate theproposed framework detection performance, we compareship detection results with manually labeled ship positions(i.e., ground truth data) in each maritime image. Followingthe rules in the previous studies [28], two statistical indicatorsare employed to demonstrate the framework performance,which are recall rate (𝑅𝑟) and precision rate (𝑃𝑟). The indicator𝑅𝑟 demonstrates the miss-detection performance of theproposed framework. More specifically, the lower value ofthe indicator 𝑅𝑟 implies that fewer objects in the maritimeimages (such as ships, buoys, etc.) are miss-detected by theframework. The parameter 𝑃𝑟 shows the precision detectionrate for the proposed framework. More specifically, the larger𝑃𝑟 demonstrates less detection error, and thus indicting betterdetection performance for our proposed framework. Thedefinitions of 𝑅𝑟 and 𝑃𝑟 indicators are shown as follows:(8)(9)𝑅𝑟 𝑇𝑡,𝑇𝑡 𝑇𝑓(11)𝑃𝑟 𝑇𝑡,𝑇𝑡 𝑓𝑇(12)where 𝑇𝑡 is the number of ships positively detected by theproposed framework. The parameter 𝑇𝑓 is the miss-detectedship number and the 𝑓𝑇 is false-detected ship number.4. Experiments(10)4.1. Experimental Settings. The proposed framework is appliedto the two collected maritime video clips, which have been
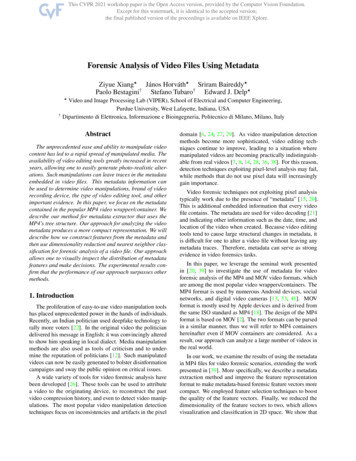
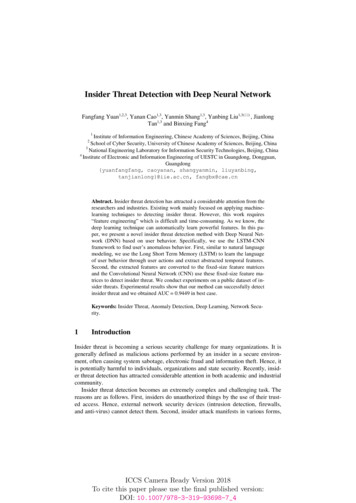
Journal of Advanced Transportation73.553.04d(y) (pixel)d(x) 570460d(θ) (angle)d(s) (pixel)4Time (s)Time (s)3250403020110000246810Time (s)(c)024Time (s)68(d)Figure 5: Ship kinematic data variation tendency at time interval 0.03 s; (a) ship position variation tendency at x-axis; (b) ship positionvariation tendency at y-axis; (c) ship moving displacement variation; (d) ship sailing direction variation.detailed described in the above sections. Our framework wasdeveloped on the Win10 OS with 32G RAM and 3.2 GHz CPU.The GPU version is NVIDIA GeForce GTX 1080 Ti, whichcontains 11 GB RAM. Besides, the simulation platform isTensorflow implemented on the Python (3.7 version). Thoughdifferent versions of YOLO detector are public accessible, wedeveloped our framework based on YOLO v3 for the purposeof accurate ship detection and behavior analysis. We set theanchor box number to 3 considering the tradeoff between timeconsumption and detection performance. The cluster numberwas set to 3 considering that ship, aiding facility (buoy, lightbeacon, etc.), and the obstacles (rock, bridges, etc.) are thethree common types of objects in maritime images. The moredetailed YOLO model setups are suggested to refer to [24].4.2. Experimental Results for Case-1. The outputs of theproposed framework are presented in detail to reveal the modelresults. The ships in each maritime image were detected by theensemble YOLO model, and detection samples were shown inFigure 4. It is observed that the majority of ships in each imagewas successfully detected, and partial small-size ships weremiss-detected by the proposed framework (i.e., ships sailingclose to the water-sky-line maybe miss-detected). The mainreason is that we did not mark out all the small-size ships inthe training images, and thus the proposed model was nottrained by such ship samples. More specifically, consideringthe small size ships cannot be 100% correctly recognized byour naked eyes, we only marked out the ships with discerniblevisual features (contours, edges, etc.) in the training datasetwhen we fine-tuned the YOLO model settings in the proposedframework.Table 1 presents the ship detection performance of theproposed framework. Both of the 𝑅𝑟 and 𝑃𝑟 indicators arehigher than 90%, indicating that more than 90% ships in thecase-1 were successfully detected by our proposed framework.More specifically, the 𝑅𝑟 value in the case-1 is 93.52%, whichimplies that less than 7% ships are failed to be detected by theproposed framework. It is found that the miss-detected shipsare the small size ships which are quite far from the camerashooting area. The 𝑃𝑟 value is 94.16% which indicates that morethan 94% detected ships in case-1 are positive results (i.e., over94% detected ships are the true targets). After carefully checking the framework detection results, we found the false-detected ships mainly consisted of navigation aiding facilities.
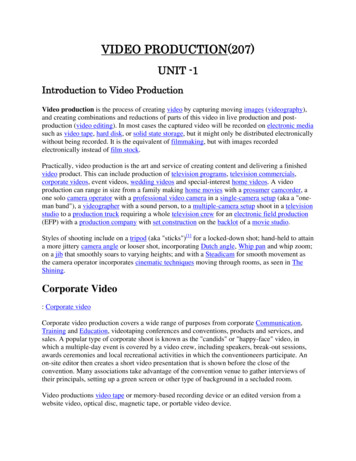
8Journal of Advanced Transportation 14 12d(x) (pixel)4 10 83d(y) (pixel)162641200024680102Time (b)(a)166014401220d(θ) (angle)d(y) (pixel)6Time (s)10860–20–404–602–80020.34s0.50s46Time (s)810020.34s0.50s0.67s1.00s4Time (s)60.67s1.00s(d)(c)Figure 6: Parameter variation tendency with different time intervals. (a) 𝑑(𝑥) variation at different time intervals. (b) 𝑑(𝑦) variation atdifferent time intervals. (c) 𝑑(𝑠) variation at different time interv
Research Article Video-Based Detection Infrastructure Enhancement for Automated Ship Recognition and Behavior Analysis Xinqiang Chen ,1 Lei Qi,1 Yongsheng Yang, 1 Qiang Luo,2 Octavian Postolache,3 Jinjun Tang ,4 and Huafeng Wu5 1Institute of Logistics Science and Engineering, Shanghai Maritime University, Shanghai 201306, China 2School of Civil Engineering, Guangzhou University, Guangzhou .